

Isotherm
-
Posts
7,930 -
Joined
-
Last visited
Content Type
Profiles
Blogs
Forums
American Weather
Media Demo
Store
Gallery
Posts posted by Isotherm
-
-
18 hours ago, bluewave said:
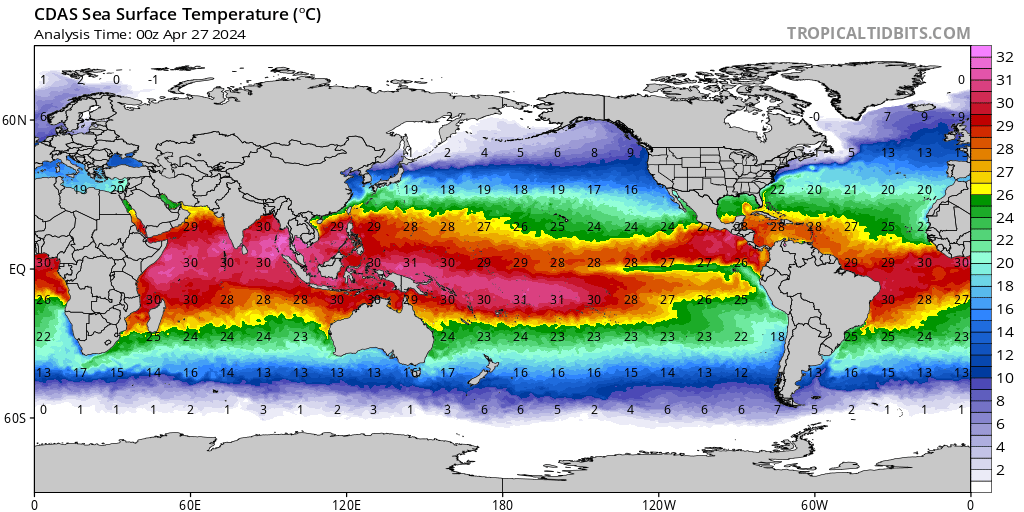
This goes to show how extreme the heatwave driving those SST’s north of Australia has been.
I am uncertain whether I ever recall seeing such an expansive (or any) area of 32C coverage in that part of the world. These are 90 degree F water temperatures to the north of Australia. For such an anomaly in the deep tropics, it yields a significant impact on the energy budget as you know, and concordantly, it isn't surprising to see the modeled high amplitude in phases 4/5 of the MJO. This is akin to throwing gasoline on the proverbial fire. Ambient SST's of 32C/90F are very impressive. This will further serve to enhance the MJO in its unfavorable [from E US perspective] octants.
-
 1
1
-
 2
2
-
 1
1
-
-
18 minutes ago, bluewave said:
The Euro and GFS agree that the MJO could reach a +2 or greater amplitude in both phases 4 and 5. The last rime this occurred during January was 2013 and 2007. It would be nice if the February pattern improves like it did in those winters.


Here's a temperature departure composite of every January since 1990 that featured a MJO phase 4 RMM amplitude of > 2.0 in January:
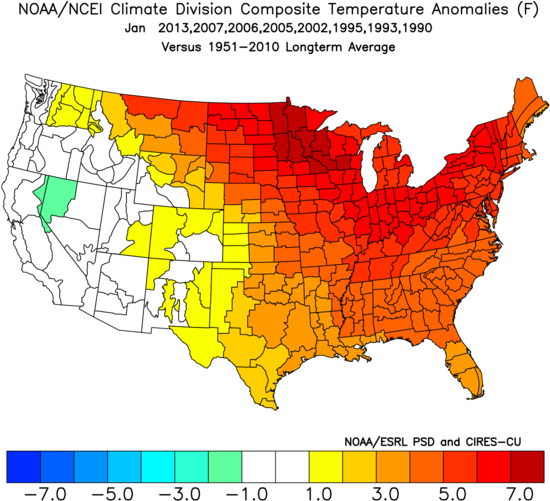
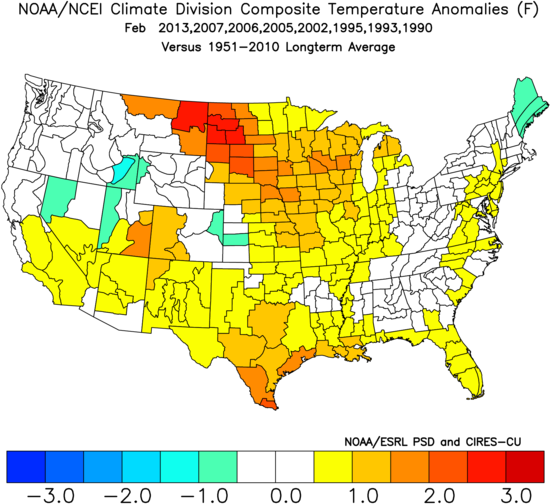
The ensuing February composite -- the resultant was rather mixed -- by my count, 4 warmer than normal, 3 colder than normal, and 1 near normal.
-
2
-
-
35 minutes ago, binbisso said:
Yeah he's off many times as it looks like he usually picks the warmest guidance. There was one point in mid-December where he was three degrees off his 8 day forecast. It's always best to go with a blend of what the models show. If we use the 1991 to 2020 averages this December would probably end up right around normal which would be more appropriate to use as we are in a warmer climate now.
He utilizes the GFS guidance. The forecasts are not his own. The reason for the alteration from the prior day is b/c the GFS guidance prognosticated a high closer to 50F yesterday at NYC, but the resultant was closer to the ECMWF guidance in the lower 40s. Hence, the change. Regardless, most of NJ and the Northeast are finishing slightly warmer than normal for December.


-
16 hours ago, doncat said:
Mean monthly temp here after today is 35.8°...Normal for Dec is 36.2°, so will finish very close to normal.
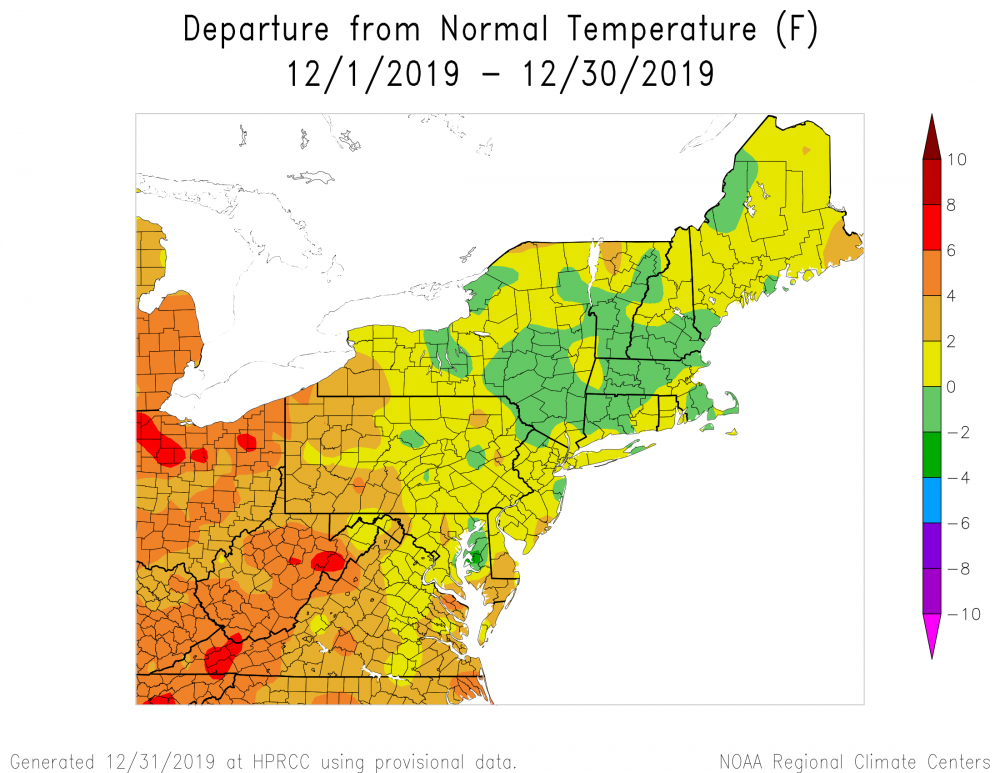
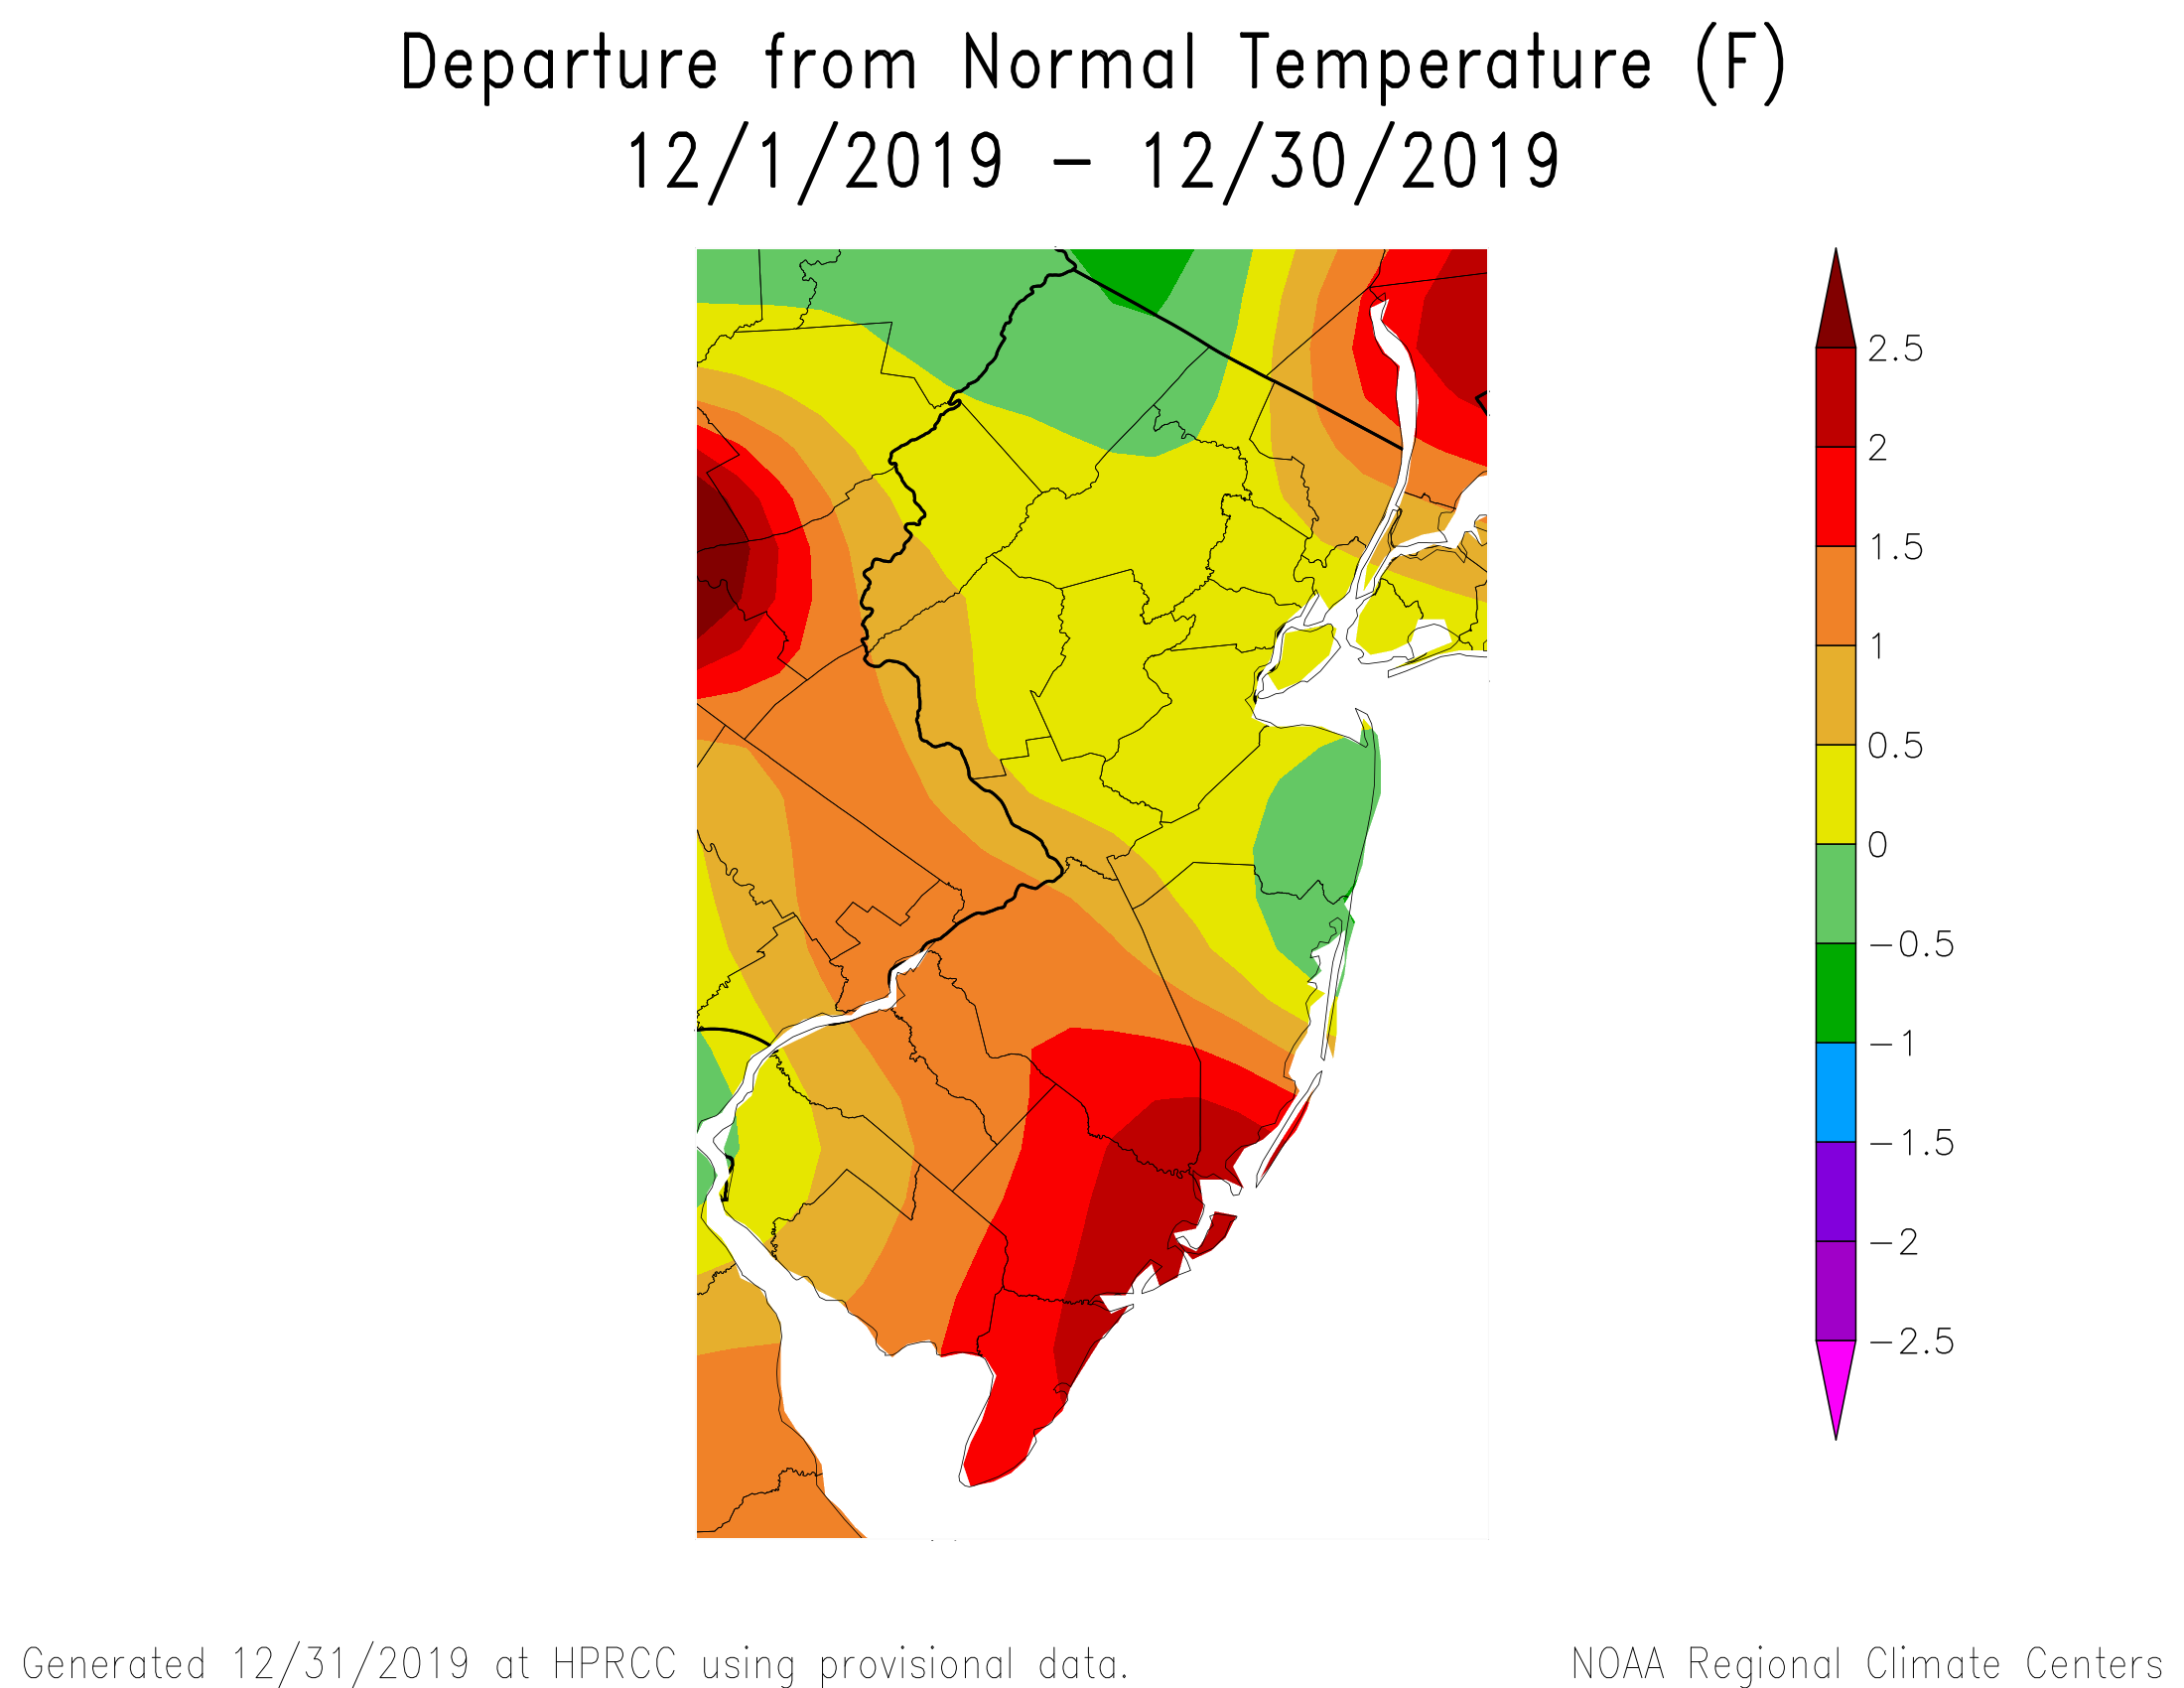
5 hours ago, bluewave said:With two milder days to go, all our stations will finish another warmer than average December. Not much in the way of cold across the US as the Pacific continues to dominate.
Through 12-28
EWR....+0.6
NYC....+0.4
LGA....+0.2
JFK.....-0.1
BDR....+0.3
ISP.....+0.7

Exactly +1.0 here through this morning. After today and tomorrow, likely near 50F, I expect that will be a bit higher. Departures about as I expected nationwide; slightly warmer than normal in the NYC-metro region; a little lower than I had for Dec, but good overall. Snowfall here was 3.7". How much do you both have to date?
-
1
-
-
10 minutes ago, Brian5671 said:
why would the amplitude help in 3/4 with the blizzard?
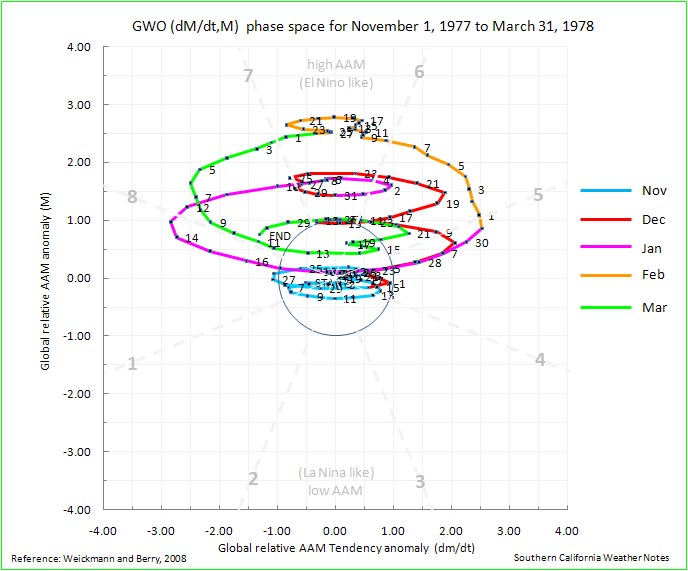
January 1978 featured a much more atmospherically engaged Nino signal than is extant presently. Pre-existing blocking over the high latitudes, in concert with a fairly coherent GWO circuit 7/8 enabled sufficient momentum induction to produce a conducive downstream synoptic.
So, the MJO-4 and concomitant NPAC decay didn't totally extirpate the set-up.
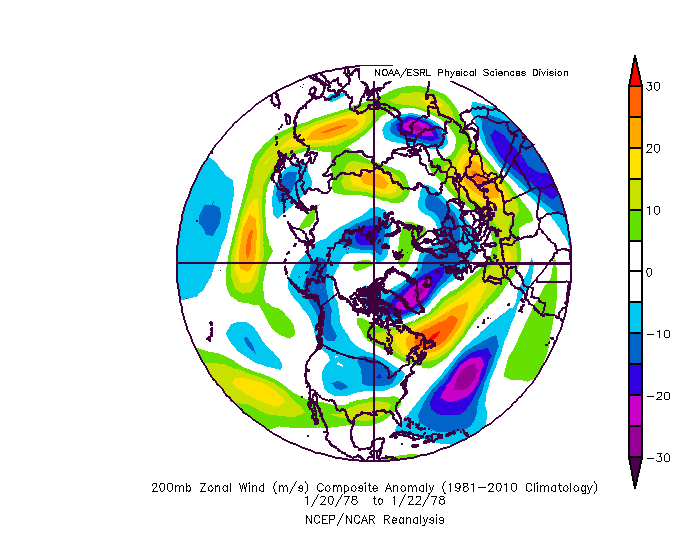
Finally, the southern stream/STJ was quite/more active than normal, again, reflective of much improved Nino engagement.
Blocking already in place across the AO domain:
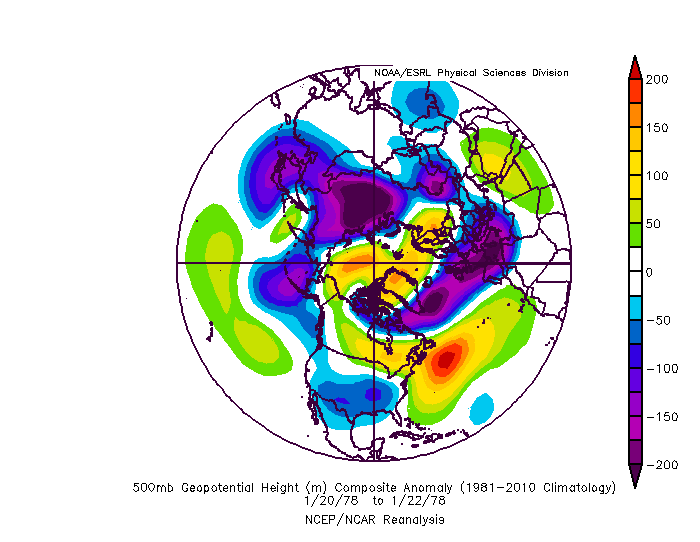
STJ active:
Auspicious GWO circuit:
-
2
-
-
On 12/27/2019 at 5:12 PM, bluewave said:
Thanks, Tom. The ENSO blog summed up several of the points we mentioned here going back to the fall of 2018. They discuss the warmest SST departures over the WPAC relative to further east. Another recent paper showed how the rapid expansion of that warm pool shifted the MJO to more frequent phase 4-6 episodes.
https://www.climate.gov/news-features/blogs/enso/csi-enso-case-missing-central-pacific-rainfall
The following figure shows how sea surface temperatures in the fall of 2018 differed from those of a typical El Niño of similar strength (1). Compared with a typical El Niño, the fall of 2018 featured a warmer sea surface in the western Pacific and a cooler sea surface in the eastern Pacific. This signifies an enhancement of the east-west sea surface temperature gradient relative to typical El Niño conditions. In other words, we failed to see the eastward movement of the warmest surface waters that we usually see with El Niño. It looks like this suspect fits the profile!
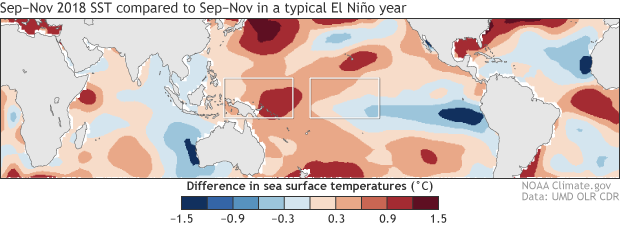
The September–November difference in sea surface temperature between 2018 and a typical El Niño of similar strength. The typical El Niño sea surface temperature pattern was determined as a scaled average of all events since 1979 (13 total). In 2018, the sea surface temperature was warmer than typical over the western Pacific but cooler than typical over the eastern tropical Pacific, which indicates a stronger east-west temperature gradient than typically experienced during an El Niño fall. The white boxes indicate regions used to define a gradient index (west minus east) that measures the strength of the east-west temperature gradient. Climate.gov figure from ERSSTv5 data.
Very nice article, Chris. The sea surface temperature profile projects onto the negative PDO paradigm to a certain extent, so we end up with a quasi Nino/Nina esque signal emanating from the Pacific. Warmer SST anomalies in the West Pacific, adjacent to Japan, and across the spatial domain around 150-60W longitude tend to promote these patterns. November PDO value was -0.36 per ERSST:
https://www.ncdc.noaa.gov/teleconnections/pdo/
The tropical forcing pattern experienced last winter, also mediated in part by z50 QBO modulation. See this study:
-
1
-
-
26 minutes ago, bluewave said:
We really need to lose that Niña-like ridge north of Hawaii for an improved storm track. All the storms since last winter have been cutting or hugging. Each storm kicks up the SE ridge out ahead of it. This is probably related to the warmest SST departures west of the date line and cooler near South America. The warm SST departures in the WPAC also lead to more MJO phase 4-6 forcing.
This winter so far

Last winter

La Niña 500 mb composite

Current SST departures

Chris: nice post. In my post mortem analysis last winter, I noted that the z50 negative QBO in concert with robust BDC and protracted SSW length, likely enhanced the intraseasonal-MJO signal, aiding in deceleration, and thus the resultant anomalous warmth across the East [Dec 2018]. 2018 arose quite a bit in my 'differential diagnosis' of this present winter's factors. One difference is the z50 QBO state, which I think, via that indirect pathway, allowed the MJO to remain a bit less coherent this month versus December 2018, and thus, not as warm on the East Coast. However, many of the precursor variables extant last winter are once again present this year, and so, these largely unfavorable storm tracks are concordant with those variables.
-
1
-
-
2 hours ago, bluewave said:
This week was another great example of the week 2 forecasts not being able to see the SE ridge. But you knew this would happen with such an unfavorable Pacific.
Forecast

Verification

In addition to your veracious comments above -- note ozone concentration propensity, which is highly reflective/comports with the mean z500 structure hemispherically. Increased ozone residence over the WPO/West EPO domains will continue to promote higher geopotential heights, whilst lower ozone concentrations in the means near the North Pole/Greenland will promote the overall +NAO paradigm maintenance, prospectively. When one considers the forthcoming AAM cycling, that too, comports with the NWP's modeled Nina-esque z500 structure in the medium term.
-
4
-
-
7 hours ago, frd said:
@Isotherm Do you continue to favor the idea that a SSWE is not favored this winter season ?
I can see a way to a better pattern without such an event, as I almost worry about the consequence should we experience a SSWE, although I put the odds of an official SSWE as rather low myself.
However, outside of a SSW I would certainly like to see some disruptions to the vortex in January though, along with improvements in forcing, and as you mention above, AAM and the distribution and transport of it. Seems your progression is looking good so far Tom. Still feel we have ample opportunity later in Jan. that may go into March. Time will tell.
@frd, thanks for your comments. Yes, I think the probability remains lower than normal for a SSW this season, although, if there is one, the most likely window would be February. Later winter SSW events are more prevalent in low solar/+QBO backdrop. The tropospheric structure for the next few weeks is largely unfavorable for potent wave driving/trop-strat energy transfer. However, it's possible we might be able to achieve more auspicious torque forcing and momentum uptick later in January via tropical engagement. Nonetheless, even if a SSW were to occur, that doesn't guarantee surface impacts as you know.
-
1
-
-
2 hours ago, psuhoffman said:
wrt isotherms forecast...his ideas wrt to tpv seen good now but a lot of what he used as causality I don’t see. AAM has only been slightly low lately after a short period slightly above normal early Dec. And now it’s rising and forecast to enter a high state soon. Furthermore we have most definitely not been in a Nina like pattern. A lot of what he expected December to lead to where we are now didn’t take place. Yet we may now be where he predicted anyways. Hopefully this isn’t then as a shot at isotherm, it’s simply I am highly skeptical of all seasonal forecasts (anything past 2 weeks) including my own. They are all predictions based on predictions based on predictions. Sometimes $&@& just happens.
Hi, @psuhoffman -- regarding your inquiry. The modality of the AAM, as in, positive or negative, is not most integral - but rather - the distribution and transport of angular momentum through the hemispheres. My analyses pre-season indicated unpropitious transports, that would likely countermand the development and maintenance of significant/sustained high latitude blocking structures for much of the winter season. There's more to the entire methodology as well, so, what is stated in the outlook is only a skeleton of what I've analyzed. But, as said, the AAM distribution in concert with other variables, such as QBO timing/diminution, Hadley, Walker Cell behavior, among other factors, were all utilized. We'll see how the rest of the winter progresses. However, the present model/NWP trending in recent days largely comports with my expectations.
-
1
-
1
-
-
40 minutes ago, 40/70 Benchmark said:
Yes, absolutely. But the notion that substantial negative departures will be eradicated by the new year is dubious, at best.
It's a steeper climb for interior New England, but for coastal stations, like BOS, they're at -1.1 for the month, without accounting for today's 60F. So they've essentially neutralized, with half-month ahead. The departure distribution again evinces the storm track propensity.
-
1 minute ago, 40/70 Benchmark said:
Yes, but I am only concerned with the northeast, so you need to understand the context.
Yes - and the month has not yet finished. We'll see how it looks in two weeks.
-
3 hours ago, binbisso said:
How so? Blue Wave and isotherm are on the warm train. isotherm called for +1 to 2 temperature departures for December. We are -2.3 so far this month with the bitter cold air mass coming Wednesday night through next Saturday. We're probably going to be -3 or better by the 21st not going to make that up the last 10 days. Also they're probably spin it because most of the country is warm except for our area but they specifically forecast for our area. Also if we get a few inches of snow on Monday will be very close to normal for December with two weeks to go.
I will add that isotherm North Atlantic forecast is going to bust if guidance is correct with the Nao and ao. We will have had two episodes of negative Nao and the AO supposedly going to tank the last half of the month. His forecast called for no blocking in the Atlantic for December. And bluewaves mjo forecast is incorrect as it's going to probably miss the warm phases and come out in the cold of phases later this month. If I'm not mistaken he was calling for the same mjo propagation as last year
Incorrect. This is a misinterpretation of my forecast. First, I do forecast for the entire nation, but provide specific departure values for the NYC metro region. Both the AO and NAO have been positive to strongly positive so far this month, pursuant to the forecast. See CPC data. The rest of your first paragraph is speculation with respect to the remainder of the month. Temperature departures for December are presently normal to warmer than normal in the US, except for New England; and the jury is still out re the final numbers. The overall storm track so far has been similar to last year, favoring the interior Northeast for snowfalls, and coastal rain events particularly NYC southward. @bluewave has also been correct on this matter, to date.
I realize that people become quite emotional regarding snowfall, but at the very least, wait until the verification period is over before impugning others' forecasts, and exercise greater care in interpreting those forecasts.
2 hours ago, 40/70 Benchmark said:False.
Isotherm had a benign, mild month.
Not entirely correct, and there are material omissions here. I called for aperiodic injection of polar/arctic air into the Rockies-Plains-MW c/o poleward NPAC ridging, and near normal snowfall in NNE. The nation has been milder than normal to date, save for New England. It remains to be seen how the month finishes, temperature and NAO/AO wise.
-
11 hours ago, 40/70 Benchmark said:
1-3" along I95?
Boston had over 7"...our outlooks are significantly different.
11 hours ago, frd said:Yes, that's true Ray, I believe your seasonal outlook is more positive for snow lovers and you were more bullish on December cold risks than most out there.
The only folks I now that had a normal or even below normal December ( Or seemed more positive about December ) were you, BAMMWX, Analog over at 33 , a met whom posts there, Weather 53 here and HM seemed positive as well. So basically we have two camps on December outcomes. Today even Eric Webb changed his tune as you may be aware.
If I recall correctly I believe your seasonal progression may vary a bit from Tom's too, in the sense he seems more bullish later on in the season while you are more positive about December and Jan, although I think you have a caveat about Feb and March could turn out better.
So far you are doing well !
@40/70 Benchmark - the board I posted that on is geared toward NYC metro, so the 1-3" forecast was specifically for PHL-NYC corridor.
@frd and @Ralph Wiggum, thanks for your comments. And Ralph, that is generally an accurate description of my thoughts. I expect February will be the most conducive, compared to Jan/Dec.
-
1
-
2
-
-
@40/70 Benchmark, great, detailed work as per usual. You are colder and blockier than me overall, but we concur that late season has the highest probability of inducing such action centers.
-
1
-
1
-
-
57 minutes ago, psuhoffman said:
I wasn’t kidding. I suppose I was being a bit flippant in how I said it. But if you read Isotherms winter outlook he is basically saying we will have a Nina like regime with above normal temperatures and below normal snowfall and a very hostile base state for snow here. The pattern he described was not like last year, it’s significantly worse. I suppose if you only look at the raw snowfall expected for Baltimore it’s close but Baltimore was a local snowfall minimum last year with more snow throughout most of our region north/south/west of the city. That’s just bad luck. Regionally we had a near normal snowfall winter last year. Isotherm is predicting a warm below avg snow winter for the whole east south of New England! Not the same.
There were quite a few strong similarities to last autumn/preceding period in the objective data. As far as the major drivers, the disparities are not significant, though there are a couple notable differences. For example, the momentum budget tended a bit more positive last winter, which aided in the DC area occasionally striking luck with snowfall. With a stronger negative momentum signal this year, the snowfall regime may be less favorable than last through the first half. However, the descent of the easterly shear stress is an improvement over last year, which should, a priori, yield a more conducive regime for those on the East Coast south of Boston for February-March compared to last year. So there is a bit of balancing of positives/negatives of this year vs. last year.
-
1
-
2
-
-
17 hours ago, WxUSAF said:
Appreciate your thoughts. Hope you’re wrong, but appreciate your thoughts nonetheless.
Certainly impossible to deny that the SE ridge has been dominant this year and that winter +NAO has been a decadal trend.
What do your analogs show for November? Did they suggest the cold pattern that seems likely to last the first 2-3 weeks of the month at least.
Thanks for your comments. Re November, most of them showed an amplified Pacific ridge w/ some Arctic assist, and a cooler pattern across the North/east, not too dissimilar from this year. The November amplification is quite common within a backdrop of more negative AAM.
-
2
-
-
16 hours ago, frd said:
Wow, this is a huge surprise, and then again not so surprised.
I value your research and insights, thanks for the time in putting this together @Isotherm
Personally I feel we do a generally normal winter but we can revisit this in later March.
Isotherm's Winter Forecast
http://www.lightinthestorm.com/
Much thanks for the kind words, @frd. I realize this is not a popular forecast, and as much as I would have 'wanted' to forecast the alternative, the objective data simply did not allow it. In my opinion, the case is a robust one for the statements opined in the outlook. As usual, it will be interesting to watch evolve.
-
1
-
1
-
-
-
1
-
1
-
-
6 hours ago, frd said:
Some folks are talking about why the seasonal models are going with a mostly positive NAO and a + AO in the winter forecasts.
Simon believes it is due to the models seeing a stronger winter PV.
IMHO I don't see that. Sure, it may, as others stated, get stronger in November, but off the charts strong well I am not so sure.
Also, the pattern supports some attempts at weakening the PV and don''t forget the descending QBO as well. Maybe @Isotherm could comment.
I read from one source that the signal for the + NAO and + AO also may be related as to how the seasonal models see and resolve oceanic SST profiles.
However, a great video from BAMMwx recently mentioned that most model SST forecasts out in time are not correct. I forget the exact wording but he stated they are only correct 19 % of the time.
He also mentioned that the model, NMME or close to that, is notorious for being too warm. So since the oceans play such a huge role in driving the pattern if those seasonal models are off in forecasting future SST profiles, then the seasonal temp forecasts will be off along with other outcomes.
This is also a great addition to this topic, from Zac.
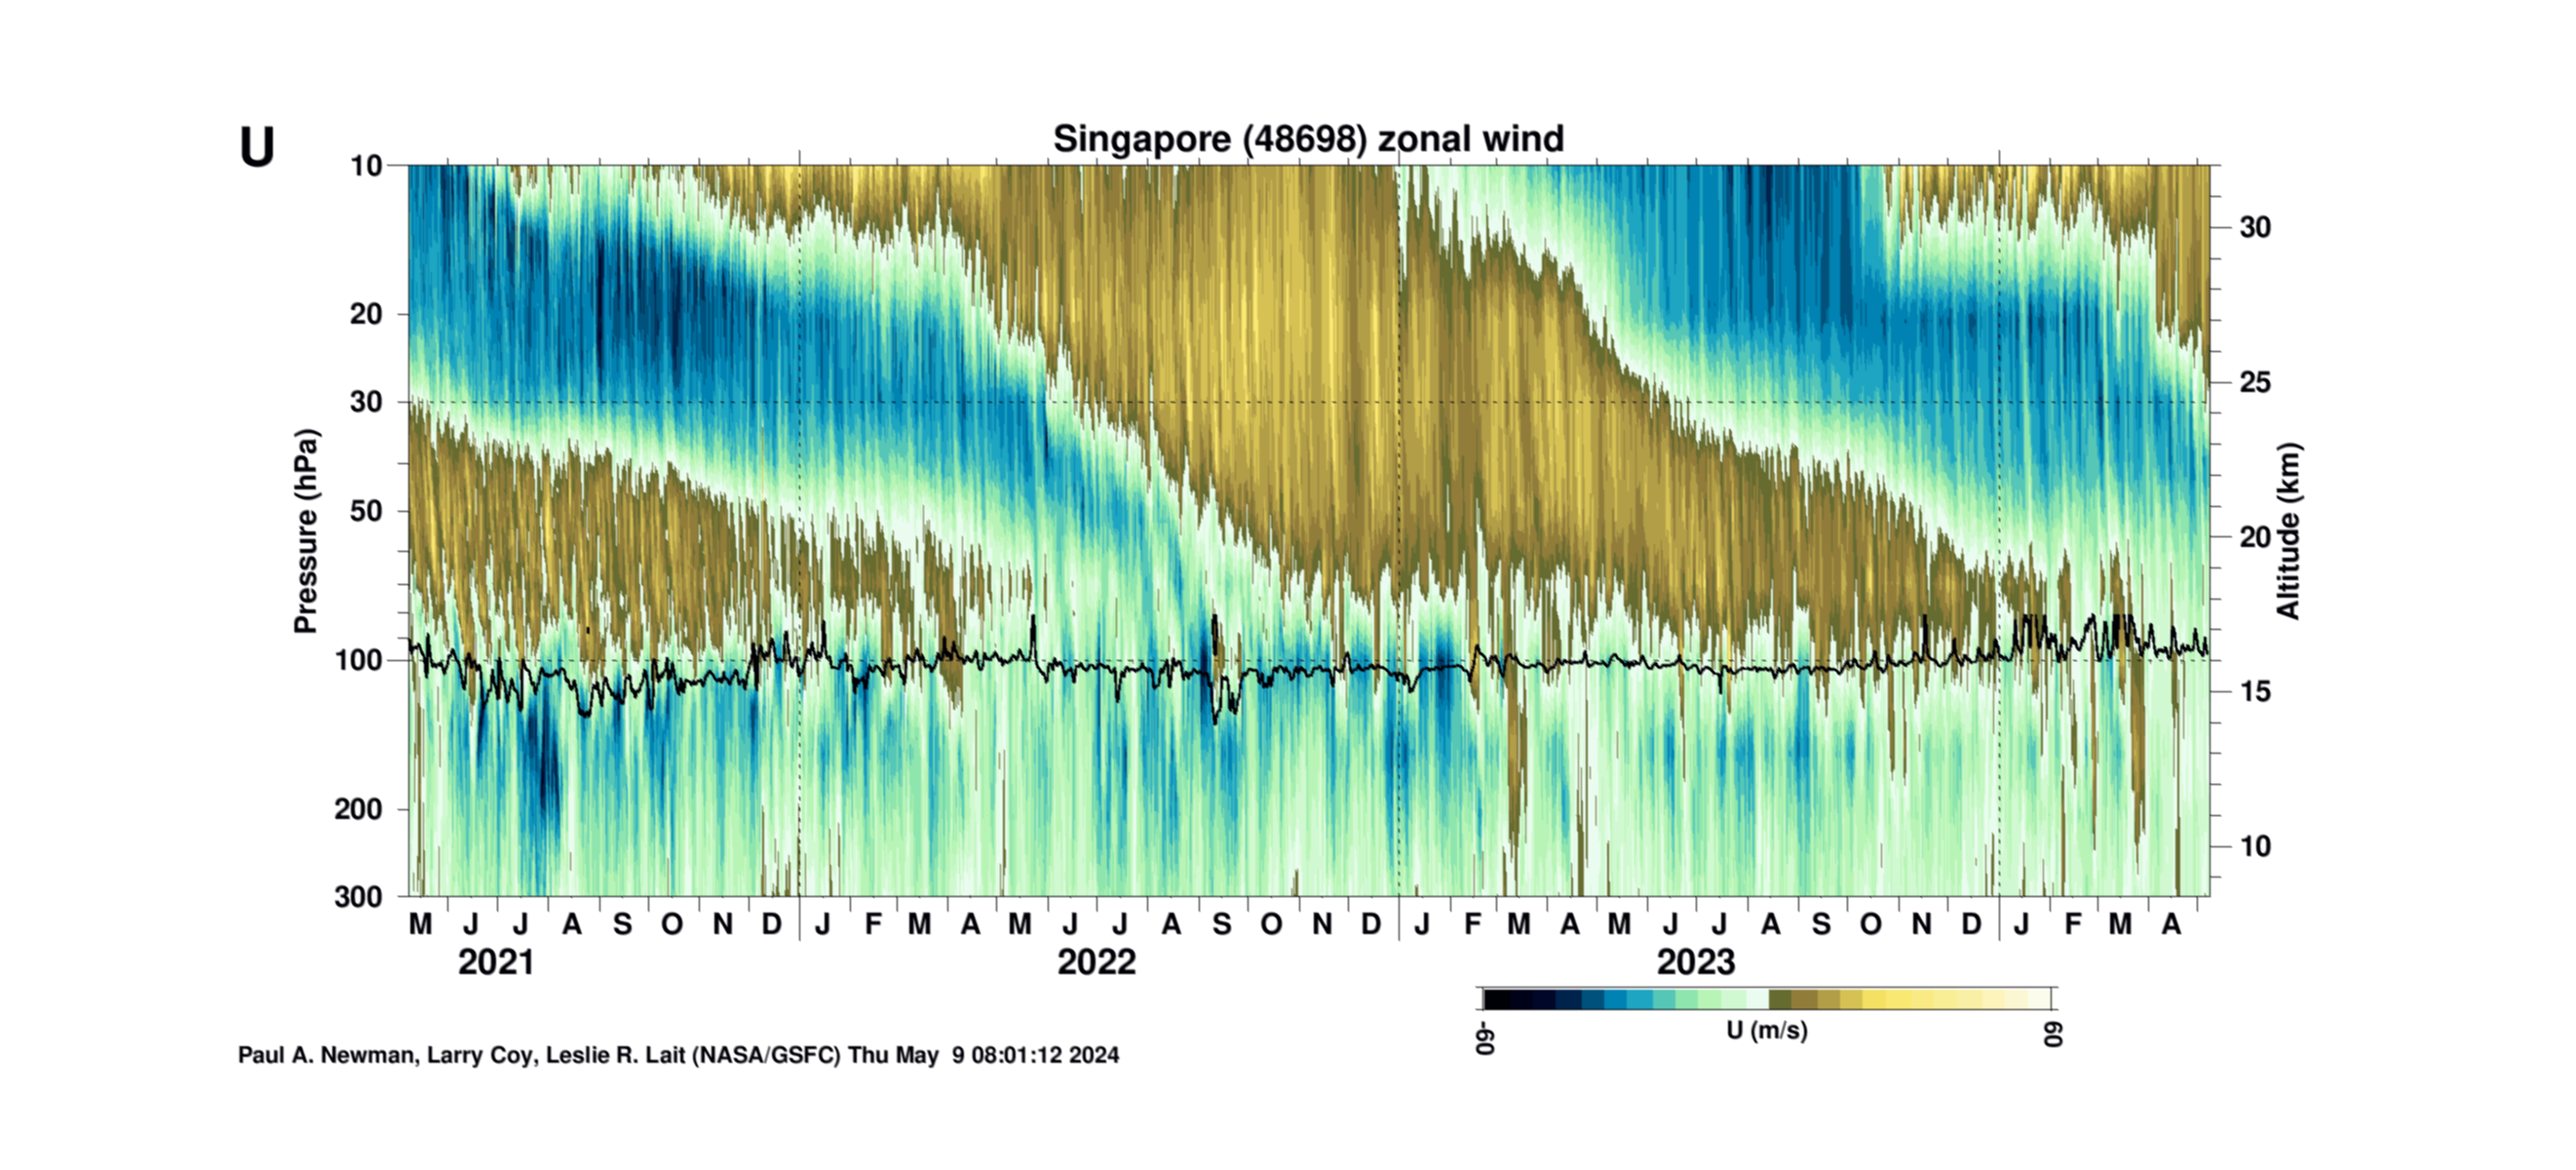
@frd. Below is the latest proxy data on the QBO. Easterly shear stress has propagated slightly below the z20 level at this point. My estimation, given slope and pace of decline in this particular cycle is that neutralization will occur mid-winter. Not much time right now, but I'll have more detailed thoughts on my NAO/AO forecast in my winter outlook, posted in about 10 days. Just waiting on a couple more pieces of data to incorporate into the final formula.
Here's the image:
-
2
-
-
On 10/15/2019 at 12:47 AM, WEATHER53 said:
Yes. Very good again.
When is your winter?
Thanks, @WEATHER53. Should be in approximately 2-3 weeks.
-
A strict construction of the ENSO-oceanic analysis may reveal neutral tending toward weak nino, but inclusion of the GSDM into the analysis yields a different conclusion. The total sum of momentum additions/subtractions evinces an apparent deficit/easterly momentum dominating the tropical/sub-tropical domains, and as such, retrogressive features will be the mainstay of the short to medium term. Whether the GWO neutralizes, thereby comporting more with the oceanic appearance remains to be seen.
-
1
-
-
44 minutes ago, uncle W said:
45 in Central Park this morning...this is no were near what we have seen this time of the year...
Coldest October days to start the month since 1960...
39 on 10/01/1992
38 on 10/02/1974
38 on 10/03/1974
39 on 10/04/1987
38 on 10/05/1965
38 on 10/06/1964
39 on 10/07/1999
37 on 10/08/1988
39 on 10/08/1964
39 on 10/08/2001
37 on 10/09/1988
38 on 10/08/2000
39 on 10/08/1978
36 on 10/10/2000
37 on 10/10/1979
38 on 10/10/1964
34 on 10/11/1964
37 on 10/11/1979
Yes, I agree. The cool down is unimpressive. Only when juxtaposed with the recent week's heat does it seem more dramatic; however, average first frosts are nearing for most of NNJ in suburbia.
As far as drought, my local area is still fine, due the excessive rains we received this past summer.

-
Station indicates a high of 93F for my area today. Today was the hottest October day I can ever remember. There have been memorable days in the mid-upper 80s, but they had a much more "summer in autumn" type feel. Today, to me, was indistinguishable from mid July, if I didn't have a calendar handy.
-
4
-


January 2020 General Discussions & Observations Thread
in New York City Metro
Posted
The MJO will certainly be an integral aspect of the entire momentum budget. As I noted pre-season, there were many variables likely to be fundamentally unfavorable for most of the season. Some of those background indicators should improve late-winter [e.g., the QBO]; however, the amelioration in the pattern may only be into a fair/mediocre one [though this would be improved versus the Dec-Jan mean pattern]. Many (not all) of the analogs I examined pre-season would tend to indicate a MJO circuit through 5-6-7, with diminution in 7+ beyond. As an aside, sometimes the background state overwhelms even a favorable MJO circuit. For example, last winter, we did have a 8-1-2 passage late winter, which improved the pattern, but not significantly so. The momentum transports have been unpropitious this winter, and we would need a quite significant vicissitude in that. All said, late winter should *improve* versus Dec-Jan as I've said.