

Isotherm
-
Posts
7,930 -
Joined
-
Last visited
Content Type
Profiles
Blogs
Forums
American Weather
Media Demo
Store
Gallery
Posts posted by Isotherm
-
-
2 hours ago, LibertyBell said:
why are these mild patterns so stable and last for months while cold snowy patterns only last a few weeks at most? 2010-11 is celebrated as a prolonged cold and snowy winter and it was pretty much just a 5 week deal. And in 1995-96 we were in and out of cold and snowy weather. Never in my memory did we have a cold snowy pattern that was anywhere close to how mild and snowless this winter has been or the likes of 1972-73, 1989-90, 1997-98, 2001-02, etc.
One essential reason is that the mean climatological pattern favors a +AO and +NAO. It's a physical, meteorological fact that it is more difficult to induce and maintain, for protracted duration, a -AO/-NAO. The prevailing polar jet flow is westerly, so the +NAO/AO is effectively an enhancement of the the prevailing, "normal" regime. A -AO/-NAO is an interruption of the mean flow. The frequency of positive AO/NAO winters is higher, actually by quite a bit, when one utilizes a large sample size. There are decadal predilections wherein a -NAO/AO can dominate -- see the late 1950s through the early 1970s, but over the long term, the frequency of +AO/NAO is higher. I just did a rough calculation, and circa 36% of winters since 1950 have been -NAO mean for DJF. So, that's a majority +NAO by a statistically significant margin.
1 hour ago, bluewave said:^^^^^
The small area cold departures across the Northern Hemisphere were focused into Alaska and Greenland under this extreme pattern.
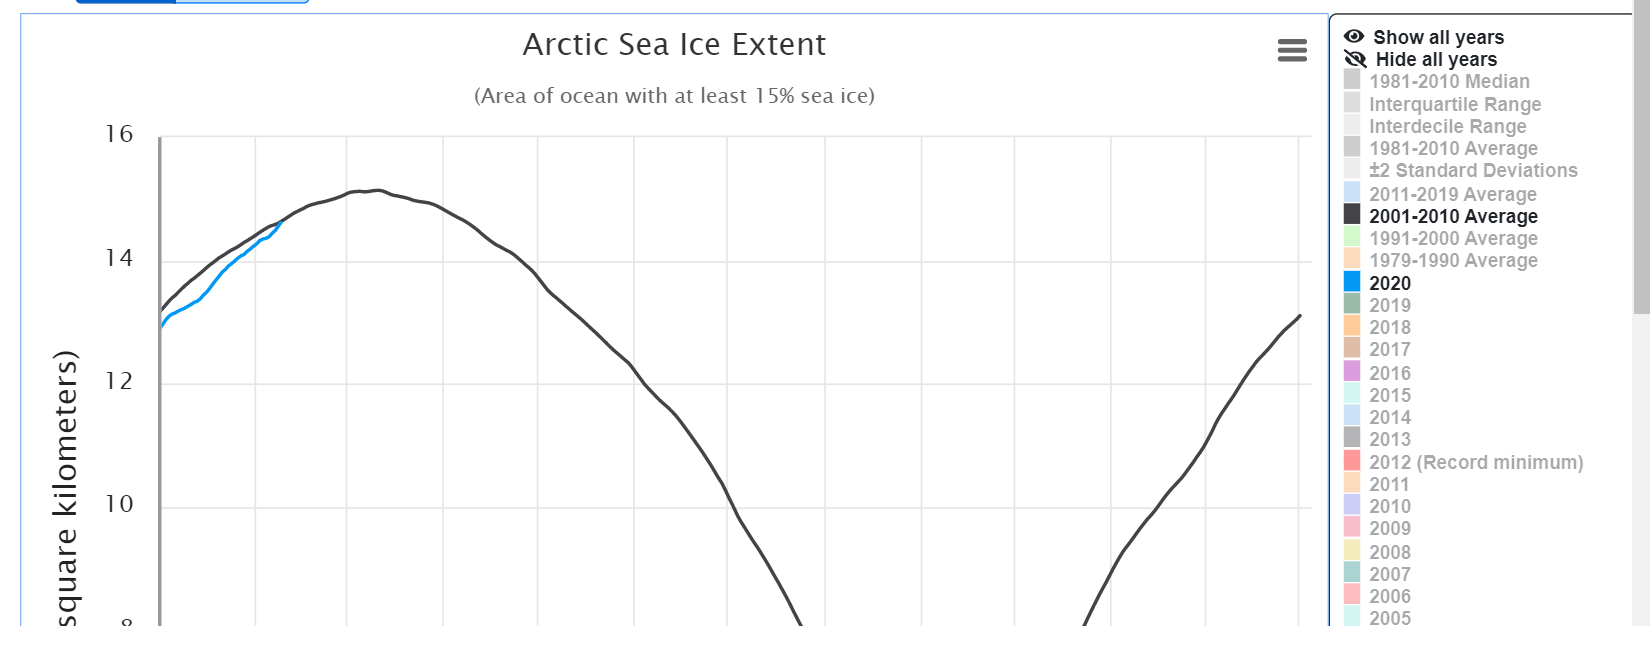
I posted this chart the other day, but it's worth a re-post now, as one bit of good news derived from this persistent +AO/NAO regime is that Arctic Sea Ice Extent has officially touched the 2000-2010 mean line -- quite impressive given how poorly we were faring sea ice wise.

-
 5
5
-
-
12 minutes ago, Allsnow said:
Going to be a shock to the system with how mild it has been. We also have a good snow pack north of our area into upstate Ny. This will prevent the air from modifying too much.
Great outlook from you this year Tom. It really nailed the overall idea for DJF. I hope we can pull off one plowable event (2+ on Pavement) in your window to start March. I really don’t see much to inspire confidence that we might get a event in February. Some signs that we Could enter p1/p2 to start March. Would line up well with your thoughts .
Thanks, Tim. I am happy re the outlook; and it would certainly be nice to see an areawide event prior to the end of the season. I still do believe there will be amelioration near the end of February into March, from hostile to more mediocre. I don't see any indications of a great pattern at this juncture, but all we would need is something serviceable to produce a plowable event in Feb 25-Mar 10, which is still favorable climatology. Post Mar 10 is when probabilities begin decreasing expeditiously.
-
2
-
-
2 minutes ago, Allsnow said:
Straight out of the 1980’s with this cold dry outbreak for next weekend.

For once, it appears the surface high pressure ridge crests with auspicious timing for near ideal/ideal radiational cooling Friday night. There may finally be a hard freeze in the single digits and teens.
-
3
-
-
6 minutes ago, 40/70 Benchmark said:
Agree on everything. I think March is decent. And calling for extreme anonalies months in advance is tough...I hit in February 2018, but its a gamble...you have to be very confident.
Certainly -- agreed. It would remove some of the putative "bite" from minds regarding this winter, if we had at least one DCA-BOS snow event to track prior to season end.
-
2 hours ago, 40/70 Benchmark said:
If we get hardly anymore snow, then that will def. put a dent in my outlook, but I'm happy with my effort. Its been warmer than I had expected, but point me in the direction of the individual that explicitly called for +7 departures from 12-20 through 2-8...tough to predict that magnitude of anomaly at 3 months lead. I did explicitly state that mid winter would blow beginning just before the holidays, and that winter's return would be contingent upon the arctic and Atlantic because the PAC would remain hostile. Arctic and Atlantic haven't helped, so we continue to bake and boring.
Concur. I am very satisfied as well. My index forecasts [+NAO,-PNA,+EPO,-PDO] and hemispheric pattern hit well, as well as the warmth and snow anomalies for much of the country. My primary flaw to date was not going warm enough. As you mentioned, hitting high magnitude anomalies from advanced leads is extremely difficult. I did see some signals for a record type warmth winter -- so my only regret will be not going even warmer. Snowfall wise, the anomalies are doing well, and again, it has actually been a bit less than even I anticipated. However, I do still see *potential* for amelioration toward the end of February and March, i.e., transition from hostile to mediocre. But we shall see.
-
3
-
-
33 minutes ago, donsutherland1 said:
Today's preliminary value for the Arctic Oscillation is +5.180. That would surpass the daily record of +5.147, which was set in 1990.
6 minutes ago, bluewave said:Looks like this is currently the 10th highest reading.

And interestingly, it is not so much an expansive spatial coverage of low geopotential heights, as one might expect with a classical strongly +AO. The absurdly high value is a function of the incredible pressure gradient / geopotential heigh differential between the North Atlantic and Azores region. The magnitude of the cyclone near Greenland in concert with the anomalous subtropical ridging near Azores is mediating this incredible AO spike.
I have not, hitherto, seen such a gradient across the N ATL domain:

-
2
-
-
49 minutes ago, MJO812 said:
What does this mean for our area ?
Any short term effect would be negligible; however, if the trend continues, it would permit a greater reservoir of colder air to the north. That said, a conducive pattern is still required to deliver the air. Note, this is merely an early observation as the trend could also reverse. But greater arctic sea ice in the long term would be salutary in terms of global temperature leveling.
-
 1
1
-
-
One tangential benefit of the semi-persistent +NAM/AO mode this winter is the amelioration of ice growth across the Arctic spatial domain. The current Arctic sea ice extent is the "best" it has been since 2010; still far below the multi-decadal mean, but ahead of all of the past 10 years.

Not far from the 2000-2010 average, either:

-
3
-
-
8 minutes ago, doncat said:
Had a couple gusts to 40 Mph on my vantage... nearby mesonet gusted just over 50.
Underwhelming event here: 39 mph peak gust. Closest ASOS was also 39 mph.
-
1
-
-
If there is a material amelioration of the z500 from hostile to mediocre, it won't occur until very late in February and into March, as I've been delineating in my past couple of updates. So, I wouldn't expect to see anything too striking on the D10-15 EPS right now. I am still monitoring a few indicators [not related to the high frequency intraseasonal signal] which may improve near the end of February and beyond; however, that is not a guarantee. Until further notice, the RNA structure continues: cool NW US/Mid-west, warmer SE US.
-
3
-
-
7 hours ago, bluewave said:
This has been our default February pattern since 2017 as this Niña-like regime continues.


Indeed -- a remarkably persistent regime. I also hope that the past couple of winters have rather debunked the notion that weak El Nino automatically translates to cold/snow for our region. Even with a more central-west based warm SST anomaly this winter, the z500 was quite the inverse of a typical weak Nino regime [not a surprise for either of us]. It will be interesting to see the ENSO vicissitudes of the coming year, as the subsurface presently "could" be indicative of an actual oceanic La Nina. However, as you know, the atmosphere will often behave in ways incongruous with the oceanic state. We'll have to see where we are post spring barrier.
-
2
-
-
The latest PDO value, unsurprisingly, is now strongly negative for January, reflective of the substantial SST cooling across the northern and eastern Pacific. The z500 pattern for February will be quite close to my analog package which featured the composite RNA structure, namely, lower heights toward the NW and higher heights in the SE US.
202001 -1.17 -
2
-
-
26 minutes ago, NittanyWx said:
Which is fine and all, but neither the QBO nor solar cycles are able to exhibit a statistically significant correlation to snowfall and 2mt. Which is what makes this whole exercise challenging and makes me really skeptical about how much we can truly use solar cycles for blocking predictability purposes.
IOD, I'm sure will shoulder the blame and your point about solar minimum in concert with other things potentially affecting high latitude blocking is well-taken. We absolutely should be looking at other things, and I personally was a 'warm' outlier with my seasonal early this year (obviously not this warm) for a host of other reasons. But one look at stratospheric zonal wind tells me that there's a lot more going on here than people want to believe they understand on the solar/PV modulation piece in isolation. It's part of the grey area of the science, and I think we get fooled by noise a lot in this field.
I certainly do not disagree with your comments, and it's much more complicated even than I alluded to in my highly simplified post. I went warmer than normal/less snow than normal this winter as well in my seasonal for numerous other reasons, too -- so that's interesting, potentially we are examining some of the same variables.
Re, correlations to snowfall and 2m temperatures, the issue w/ meteorology, as I'm sure you know, is that many of these relationships are indirect and obfuscated by other contemporaneous signals, so finding the elusive direct correlation to snowfall might be quite difficult [although there are many indicators of high utility in my opinion].
I also disagree with any remarks pinning the blame solely on the IOD.
-
14 minutes ago, Cfa said:
Now that January has ended we get our first look at the 1991-2020 averages.
NYC, LGA, JFK, and EWR now have an average high of 40°F in January, up from 39°F in the 1981-2010 averages. EWR is leading the pack at 40.3°F.
Islip is now “subtropical”, meaning its January mean is at the freezing point 32°F, up from 31°F in the 1981-2010 averages.
Very significant rise at New Brunswick. 1980-2010 had a mean January temperature of 30.4F, solidly in Dfa, and the 1990-2020 January mean is 31.7F, just barely within Dfa. Demonstrates the material warmth of the 2010-2020 period.
-
2
-
-
My final temperature departure here for January was +6.1, mean temperature of 37.0F. December was +1.1, so I am at +3.6 for the meteorological winter thus far. Snowfall: 5.2" (about the same number by this time last winter).
-
5 hours ago, NittanyWx said:
Just wanted to point out that the models today are setting a new record positive AO when I comb through my dataset. I think this winter has done a phenomenal job of disproving a lot of analysis on the 'solar minimum' and it's perceived correlation to blocking. I had my suspicions before this, but this winter is the final straw for me.
Solar activity and its attendant proxies have significant utility if one recognizes how to employ it. Those who argued solar minimum induced blocking for the present winter did so with incomplete knowledge. Solar forcing can modulate high latitude geopotential heights, but it must be analyzed in concert with other variables, such as the QBO for example. Thus, linear correlations between SSN and NAO values will be unimpressive because there are other variables masking and confounding. There is a false belief that low solar activity is both a necessary and sufficient condition for high latitude blocking, but that isn't veridical. It's a much more complex relationship. I did not think the suppressed solar activity would lead to a -NAO/AO this winter.
-
1
-
-
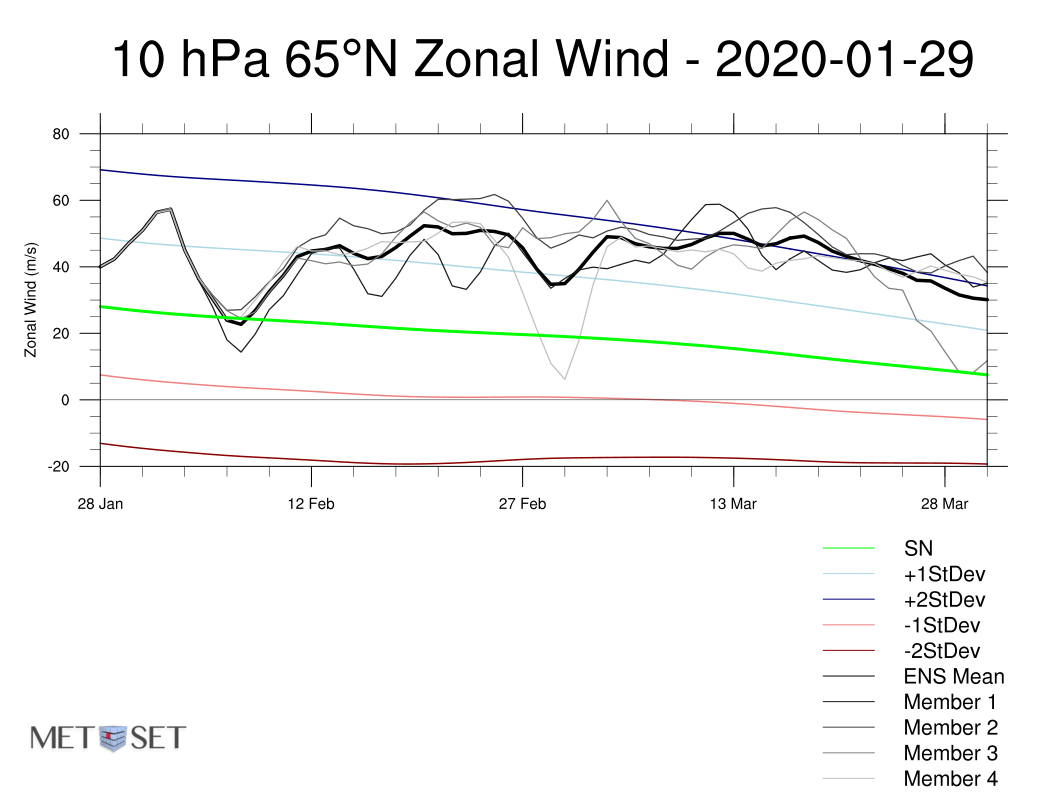
13 hours ago, frd said:
Here is the decent GloSea 5 data showing the next 45 days of zonal winds. Bottom line is the vortex does not weaken, and hence most likely the NAM state remains unfavorable during Feb. and even March. Certainly no SSWE this winter. If you look at some models in the medium range you will see a dip in zonal winds but then they come back up. As stated previously this season, the vortex is very resilient and recovers after attempts to weaken it. Either timing was off in wave 1 and 2 attempts or simply the delivery was not efficient. Bravo @Isotherm
@frd -- thank you.
Additionally, I wanted to provide my thoughts on something I saw posted regarding the IO interference and its attendant correlation to the NAO mode. While I am not asserting that the hypothesis should either be rejected or fail to be rejected, concurrently, I would caution [not you, the individual proposing the hypothesis] attempting to attribute a particular phenomenon to the perturbations of a multifactorial index like the NAO. As I've mentioned in previous posts, the NAO is forced via numerous pathways adjunctively, which is why it is more difficult to prognosticate (IMO) than other indices such as the PNA [much more modulated by Pacific based perturbations]. The Indian Ocean standing wave was certainly a factor, among many others, this winter. For example, another factor includes expanded Hadley Cells, driven in part by the SSTA structure, and the macro-scale propensity to intensify the mid-latitude jet in the West Pacific. The mode experienced was really the inverse of what is desired for the coastal Eastern US.
Also, if interested, I posted an updated in my outlook thread which effectively rehashes the thoughts two weeks ago [no significant changes in thinking]. RNA structure February with potential / putative amelioration end of Feb-Mar.
-
2
-
-
Updated thoughts posted in my outlook thread [essentially a rehash / recapitulation of 2 weeks ago - no material changes in thinking]:
-
1
-
3
-
-
2 hours ago, Allsnow said:
I just think the Pv will corporate as we enter February. We could see a more of a La Niña @Isotherm look mid month but the cold air will be around.
The recent MJO, FT/MT mediated momentum surge and concomitant high-GWO orbit should at least mediate the semi-persistent AK-GOAK low height anomaly --> wave 1 induction --> convergence/pressure onto the SPV. So, the material weakening of the SPV in mid February is likely more genuine than many of the GEFS plots have depicted this winter heretofore. As the stratospheric status begins to improve mid February onward, I am monitoring the next cycle of tropical wave propagation toward the Central Pacific as we reach the last week of February. At which time, better tropical--->stratospheric receptivity could mediate a more favorable pattern than we've seen to date, from approximately late February into March. Speculative/a priori, but as stated, there are signs that end of winter could feature an "improved pattern." Until late Feb, yes, I think RNA-type structure after a very marginal window in early Feb. As mentioned in my update a week or so ago, the pattern in Feb, while still favoring the interior (RNA structure) will probably offer more chances than Dec-Jan. Still watching late Feb-Mar [somewhat lower confidence speculation for now, but it's something to monitor].
-
3
-
 1
1
-
-
15 minutes ago, Drz1111 said:
bluewave you seem like a bright guy so offering this up more so you know in the future. 'climate normals' is a term of art and is different from 'normal'. 'climate normal' is just a synonym for "average" or "arithmetic mean", but applied to a specific period of time. Generally in climatology when we speak of "normal" in the sense you're using it, we mean conditions that are within 1STDEV of the mean (most climate statistics in most locations are roughly normally distributed, so this conceptually works). In other words, it is common for NY to have below average snow, or above average snow, but still within the "normal" range. A year like 1997-1998, on the other hand, was both below average and not normal.
I am aware meterologists use below normal as a shorthand for below average b/c of the NWS terminology and to make it easier to communicate to the public, but it's not a rigorous way to describe it and tends to blur the difference between events that are extraordinary and events that are typical.
This is a very confused communication of statistics. In statistics, a normal distribution includes 68% of the observations falling within 1 standard deviation of the mean. However, Bluewave was specifically employing the term, "climate normal" which signifies an average over a given time frame.
https://scied.ucar.edu/blog/what’s-new-climate-normal
The average snowfall for the given time period in question was as he stated. So, I fail to see the issue with his post.
-
3
-
-
19 hours ago, frd said:
Nice to hear confirmation about these features. I believe last winter, along with you, Tip from the NE Forum brought this point up as well. He mentioned that the SST structure/expanse in the Pac was more so a swashing bathtub effect with warm waters over a large area, but no real focused anomaly.
Some are saying we need some type of major Pac event to re-set the table. I am not sure whether the talks focused the need on Nina or Nino.
19 hours ago, frd said:Tom, if you are able to comment would love to hear if you have any thoughts about a change in the NAO cycle over the next few winters.
I have read research about ocean cycles and the AMO as well as lagged Ocean currents in the NW Atlantic as related to the solar minimum. Some are saying we might make an abrupt move to a multi-year cycle of - NAO over the next few years. ( I assume they mean a winter -NAO not a warm season - NAO ) . That would, in my opinion, be a remarkable achievement based on the last 5 years of more.
Of note, and whether it is a clue, or even important, not sure, but how about the record number of consecutive days the NAO was negative from late Spring to summer last year. A lot of talk back then of warm season blocking, but not as much -NAO action during the meat of winter.
At one point I believe in August 2019 even bluewave posted and commented on the robust deep dive of the NAO and how it effected sensible weather leading to cool weather in the East, during an otherwise hot(est) part of the year.
Thanks as always.
@frd, I have read that research to which you refer, and believe it to hold value. There is a documented lagged-oceanic forcing, part of feedback cycle with the atmosphere. The interesting aspect about the NAO, as to why it is such a difficult 'beast' to forecast is its highly multifactorial nature. Unlike the PNA for example, which can be primarily forced by MJO or tropical Pacific disruptions, the NAO is forced by way of many disparate variables. That being said, there are propensities and correlations that can aid us in prognostication. Certainly, solar forcing is involved. As I believed I may have mentioned here before, there is a tendency for increased -NAO episodes immediately following the solar minimum point. Conversely, the years immediately preceding a solar minimum are often more +NAO slanted. This is not always the case but the tendency is quite noticeable.
So, along those lines, yes, from a statistical and also physical forcing perspective, I think we will probably enter a period in which 2 or potentially 3 years out of the next 6 feature a -NAO in the means.
-
2
-
-
On 1/3/2020 at 8:12 PM, Isotherm said:
Thanks, Chris. In addition to that warm pool to which you describe, another issue, IMO, was the transport of momentum generally south of the equator w/ that intraseasonal MJO passage last February. Note the z850 zonal wind anomalies; most of which were directed south of the equator [circa 5-S latitude], so we didn't benefit as much in the northern hemisphere.

Indeed - My total snowfall after February 15th last winter was 6.9", while the entire Dec 1-Feb 14th period featured 2.8". Certainly an improvement - though not to a very favorable regime - but better than nothing. It will be interesting to see how the rest of this season evolves.
In the spirit of self-reflection/verification, I simply wanted to inject my two-cents, in that the primary issue here, AAM/MJO wise, is the partitioning of momentum predominantly into the S Hemisphere. I cited and broached this issue on January 3rd, in reference to last year's distorted MJO-7-8 response in late winter. As it turned out, this year's response wasn't too dissimilar. So it was very much foreseeable from my standpoint.
Note on the MJO u-div and also the convection cross-section, the preponderance of the momentum is directed southward. Additionally, the anomalous AAM spike is a function, partially of the MJO-tropical component, but also the intense frictional and mountain torque production. But note the partitioning of that torque activity; again, principally in the southern hemisphere. This is therefore insufficient as it pertains to the induction of material stratospheric - and by extension - tropospheric vortex deceleration/diminution.
As such, the resultant z500 is a distorted conglomeration of Nino-esque and Nina-esque features in the northern hemisphere.
-
2
-
-
And yes, I also agree with your point, @psuhoffman, regarding the altered base state, i.e., negative PDO structure, SSTA distortion in the WPAC, and this was certainly a variable in my winter outlook as well. When the waters are warmer in the macro-scale sense, the typical canonical weak Nino/neutral composites become much less meaningful. The jet flow is disrupted, hadley cells expand, among other things.
-
1
-
1
-
-
5 hours ago, frd said:
Very sad indeed. We had the record breaking - NAO in the late Spring and summer. Getting blocking in the wrong seasons now.
Also goes to show you using any kind of SAI or NA , even NH snow cover is totally useless.
All that crap about the Siberian High in the Fall and other Judah stuff is useless in this new warmer climate.
I take Tom's work over Judah's any day. His understanding seems o be more relevant and useful to what we are facing these days globally from a weather perspective.
I never want to hear about snow advance or record breaking snow cover again. Two years in a row and zero relationship to the winter. Even record NA snow cover is a non factor as well. Same as last year.
4 hours ago, psuhoffman said:Notice I never even factor the snowcover/ice stuff into my thinking in the fall lately. Its useless. IMO it shows backwards correlation because it was useful as a predictor during the colder regimes. But with ice and snowcover reaching record low totals almost every fall now...we will naturally see a significant "increase" once the cold season sets in at high latitudes. So that is less useful as a predictor of what the pattern is actually doing. I don't need a ton of statistics to tell me that, its common sense.
Tom nailed the PV. Absolutely 100%. And his equation shows predictability way above climo which is rare for long range seasonal forecasting. I have just begun to dip my feet into some of the factors he incorporates. I am not even close to where I want to be yet...but I will get there. I will do a lot more reading and research in the dead time next summer. I think there is definitely something to it.
From my limited understanding of the correlation between AAM global phases and the pattern... what sticks out so far, incorporating some other resent studies and observations...is that there seems to be less coupling between the older typical indicators like enso, north pac sst, atlantic sst...and the MJO and other tropical pattern drivers. This decoupling will result in non typical results if we just look at things like the enso state because the forcing they were associated that actually impacted the pattern is no longer the same.
Now I don't think this is true of a strong enso event. We have seen canonical nino results from years like 2003, 2010, and 2016. But in years with a weaker enso signal...its more likely for other factors like the AAM to not be in alignment with historical expectations. The warmer base state and changes in the IO and western PAC SST are causing other factors to be more dominant than enso when its a weak signal imo.
One troubling thing... some of those changes are biasing those other factors towards what we would typically associate with a nina atmospheric response in the Pacific. If that is the case, and it seems to be some truth to that, we will lose "enso neutral or weak warm" years as a good probability for snow. In the past enso neutral or a weak nino was a decent chance for a cold/snowy winter. Not as good as a moderate nino of course...but still a way better odds for a snowy year than a nina. But lately those years are skewing warm also.
Obviously we will need more time to confirm this...and reasearch...but just thinking out loud... if this is all true what our new climo would be would likely be even more extremes. The warming does seem to be increasing our chances of hitting BIG storms when the pattern is conducive...but we are spending less and less time in a conducive pattern. So the result of that could be bigger big years and worse years when its not one of those. In the end our "avg" might not change much but how we get there will become even more skewed between crazy snowy years and crap years in between.
4 hours ago, frd said:I like that train of thought.
I can see extreme snowfall when the conducive patterns return. Some years huge, well above climo and several below, but in the end averaging to climo.
Tom's work is enlightening. The thing that sticks in my mind about his work is the focus he has on the eventual hand off to players that guide a favorable pattern, or reasoning they will not. He and others in his clan of strat enthusiasts focus on energy transport, GLAAM, AAM, the TPV, etc, unusual methods to provide a clue to the coming season. Learned a lot reading his work about coupling, the TPV, energy transport, etc.
It should have worked last year, and this year he basically went with the disconnect and he is so far doing very well. He call about NAO is right on target. For him to really do a complete seasonal call and get icing on the cake would be for the pattern to turn snowy and cold in his window which if memory serves me correctly is after Feb 20th to early March. @Isotherm please correct me if I am mistaken regarding my previous statement.
If anything the new warmer base state has made the study of meteorology even more difficult , and even more so in the long range field.
Thanks for the kind words re: my forecast. And Frd, that is correct. The window of opportunity would probably arise later February forward. As said, no guarantees, but certain variables may ameliorate by then.
Re, the NAO. It now appears almost a lock that the Dec-Jan-Feb mean NAO modality will average positive [in fact, per CPC data, I don't believe we have had more than 1-3 -NAO days since December 1st].
This will bring my formula to 90% exactly as far as the success/verification rate utilizing the years 1950-2019. As I've said prior, the formula is multifactorial. And yes, to PSU's note, the AAM periodicity/fluctuations is certainly involved in the formula, along with other variables. I had contemplated publishing a paper on the formula, but I'd like several more years of observing its performance.
-
2
-
1
-


WINTER 2019/2020 BANTER
in New York City Metro
Posted
Utilizing NOAA data, I did a couple of quick calculations. NYC-Central Park's mean snowfall for 1990-2020 is 30.1", and their median snowfall is about 27". The median, as you know, is a very indicative number, as it represents the relative frequency of above versus below normal snowfall winters. So, the 27" is fairly good, given the proximity to the mean, suggesting that there's an almost equal split of snowier than normal versus less snow than normal winters in NYC (I would guess probably 45% snowier than normal / 55% less snow than normal). The farther south one heads, the worse the median. For example, Washington DC sees much more below normal snowfall winters than above normal, so their mean snowfall is arguably inflated by a relatively small number of major winters. Conversely, I would guess Boston's median is almost identical to their mean.