donsutherland1
-
Posts
23,763 -
Joined
Content Type
Profiles
Blogs
Forums
American Weather
Media Demo
Store
Gallery
Everything posted by donsutherland1
-
July 2025 Discussion-OBS - seasonable summer variability
donsutherland1 replied to wdrag's topic in New York City Metro
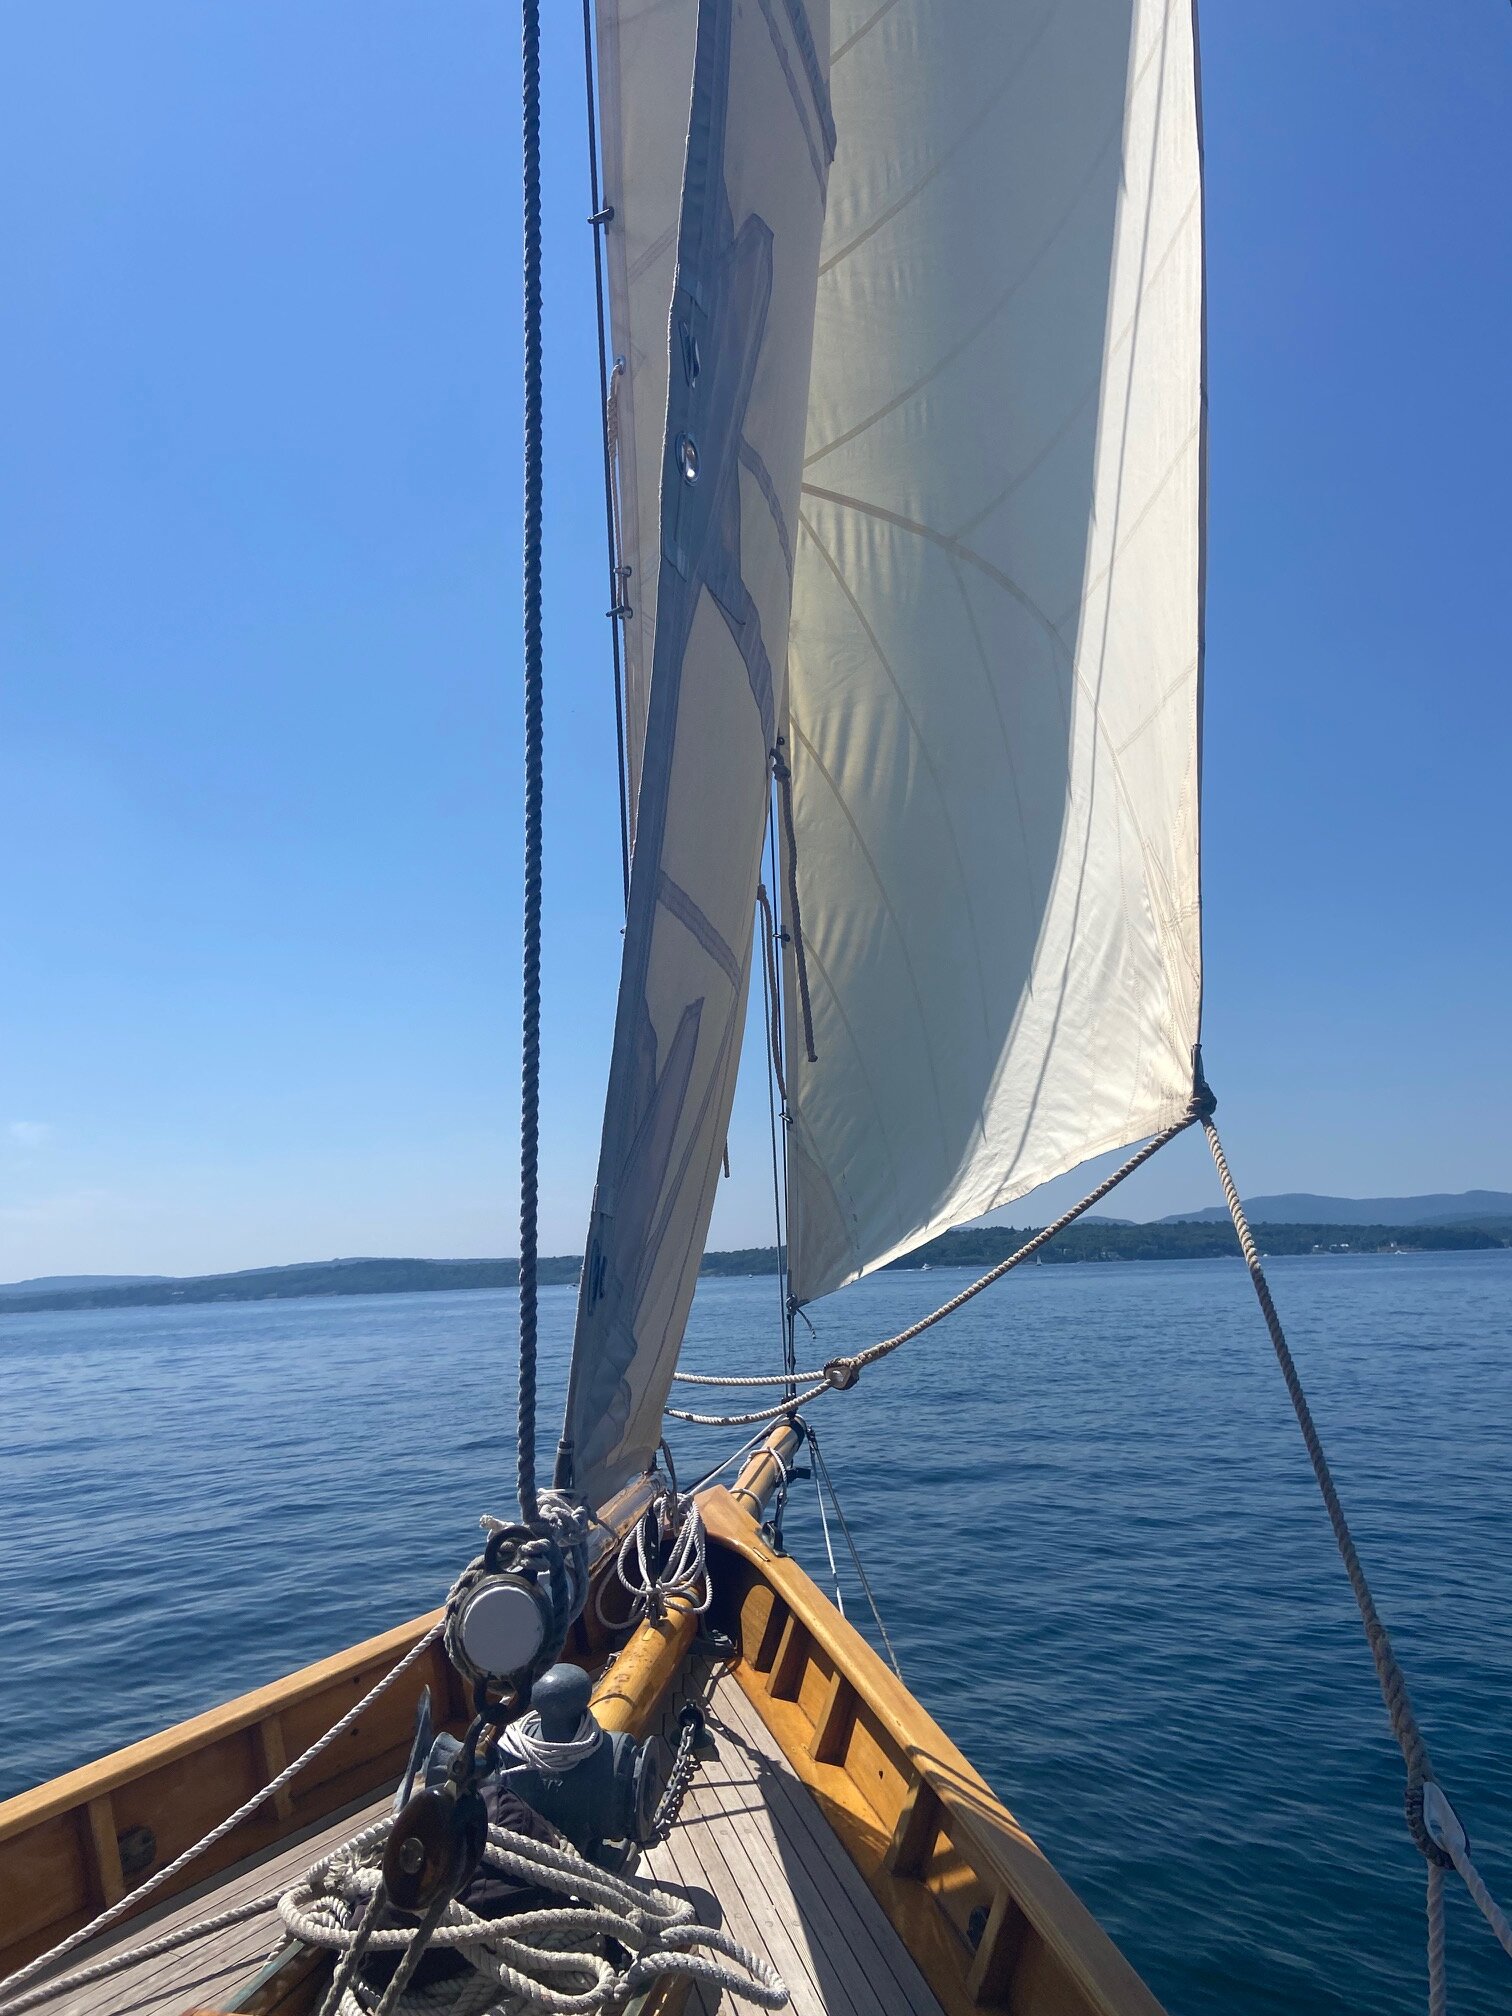
I avoided the forecast smoke in Downeast Maine. The smoke has passed west of the Camden-Rockland areas. It’s a gorgeous sun-filled day with a refreshing sea breeze. -
Winter cancelled/uncancelled banter 25/26
donsutherland1 replied to Rjay's topic in New York City Metro
78 and sunny off Camden, ME. There’s a refreshing sea breeze.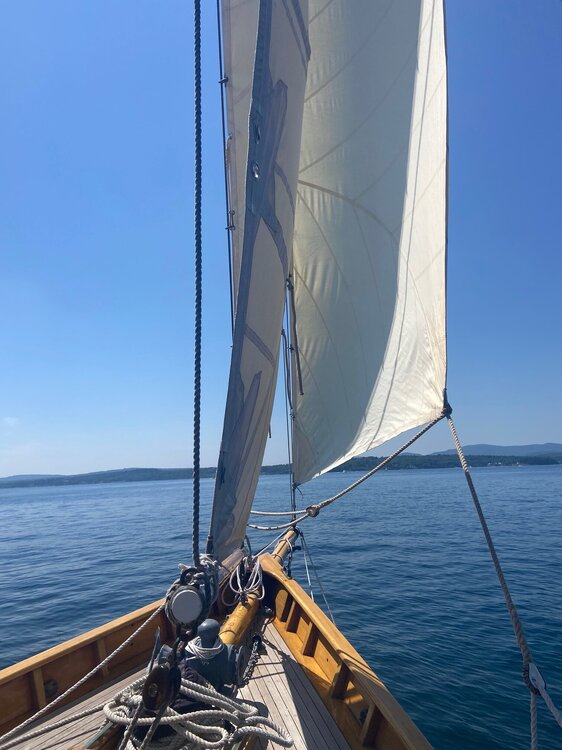
-
2025-2026 ENSO
donsutherland1 replied to 40/70 Benchmark's topic in Weather Forecasting and Discussion
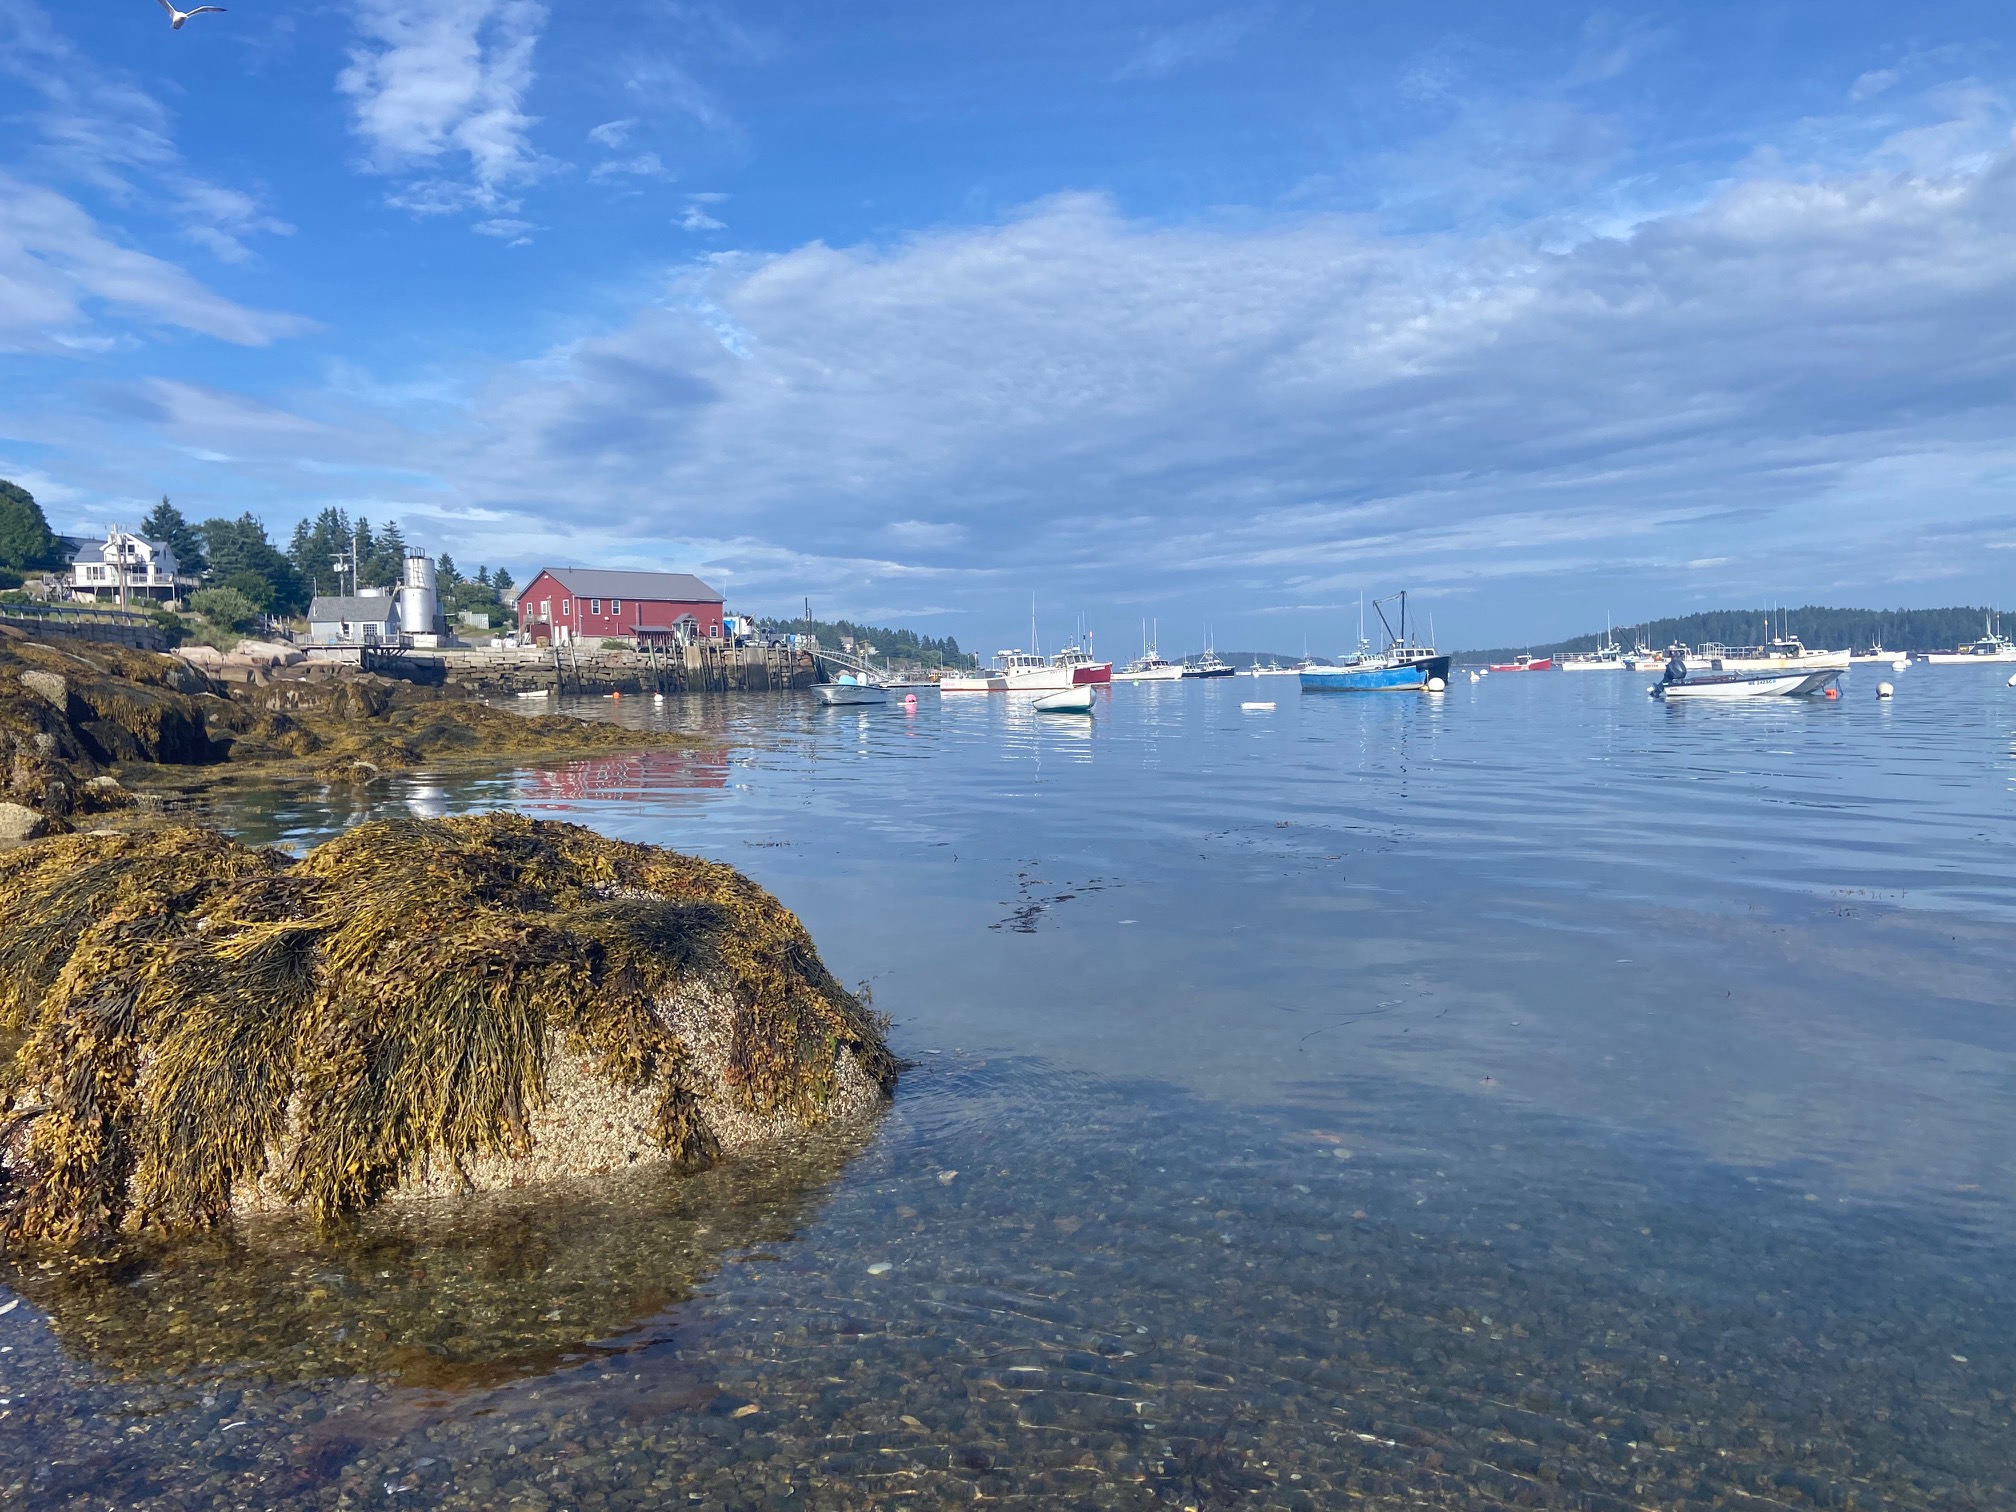
I don’t believe he is aware of the origins and flaws of the chart. Moreover, he isn’t a troll. In the meantime, a photo from Stonington, ME where it got to 84. Portland hit a record-tying 91, but the heat was tempered here thanks to some showers and considerable cloud cover. The clouds broke during the late afternoon.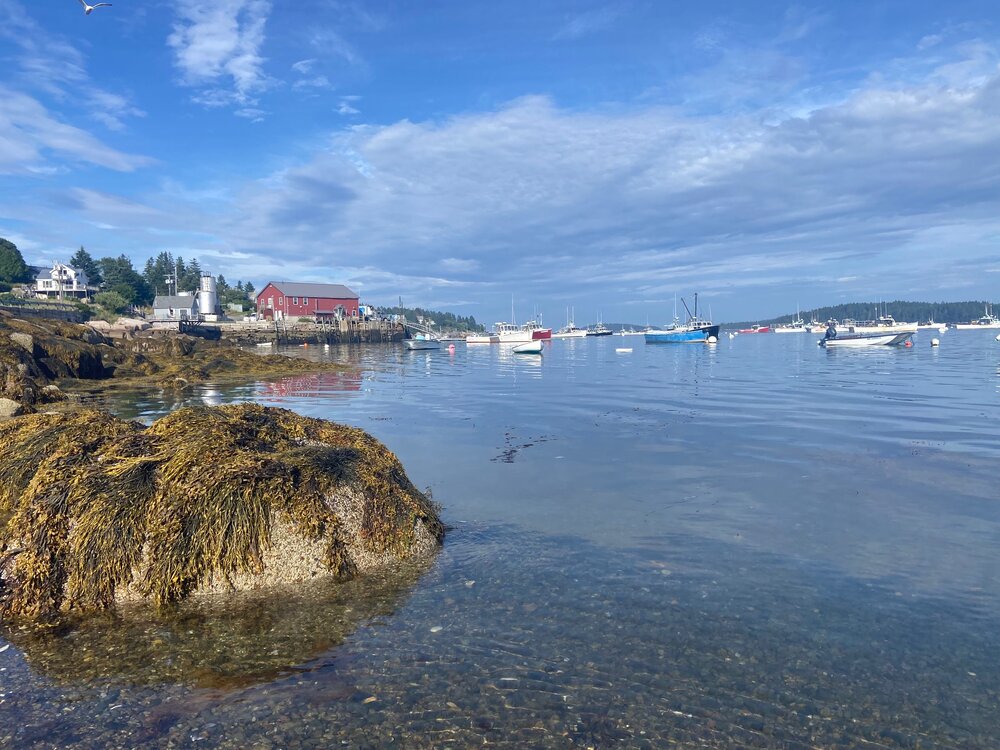
-
July 2025 Discussion-OBS - seasonable summer variability
donsutherland1 replied to wdrag's topic in New York City Metro
Newark: 100 (old record: 99, 2016) -
July 2025 Discussion-OBS - seasonable summer variability
donsutherland1 replied to wdrag's topic in New York City Metro
Congratulations on your wife’s pregnancy. -
July 2025 Discussion-OBS - seasonable summer variability
donsutherland1 replied to wdrag's topic in New York City Metro
I was told that it was an I.T. issue, but no further details were provided. -
July 2025 Discussion-OBS - seasonable summer variability
donsutherland1 replied to wdrag's topic in New York City Metro
Thank you. I will have to check it out once I get back from Maine next week. -
July 2025 Discussion-OBS - seasonable summer variability
donsutherland1 replied to wdrag's topic in New York City Metro
Is that Xmacis? -
July 2025 Discussion-OBS - seasonable summer variability
donsutherland1 replied to wdrag's topic in New York City Metro
Mostly XMacis. -
2025-2026 ENSO
donsutherland1 replied to 40/70 Benchmark's topic in Weather Forecasting and Discussion
Philadelphia had a nice snowstorm on December 8, 2013. People were caught by surprise. I was there and snapped this photo of Independence Hall.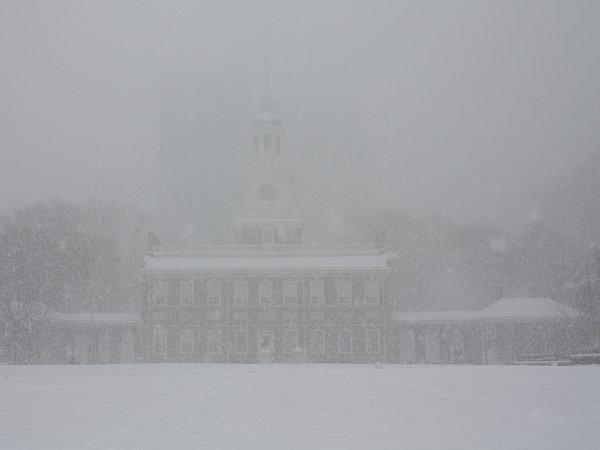
-
Occasional Thoughts on Climate Change
donsutherland1 replied to donsutherland1's topic in Climate Change
Not very warm. Up to 1944, it was the 33rd warmest or 17th coolest summer. Through 2024, it is the 108th warmest or 22nd coolest summer. -
Occasional Thoughts on Climate Change
donsutherland1 replied to donsutherland1's topic in Climate Change
Sign of the times in Portland, ME: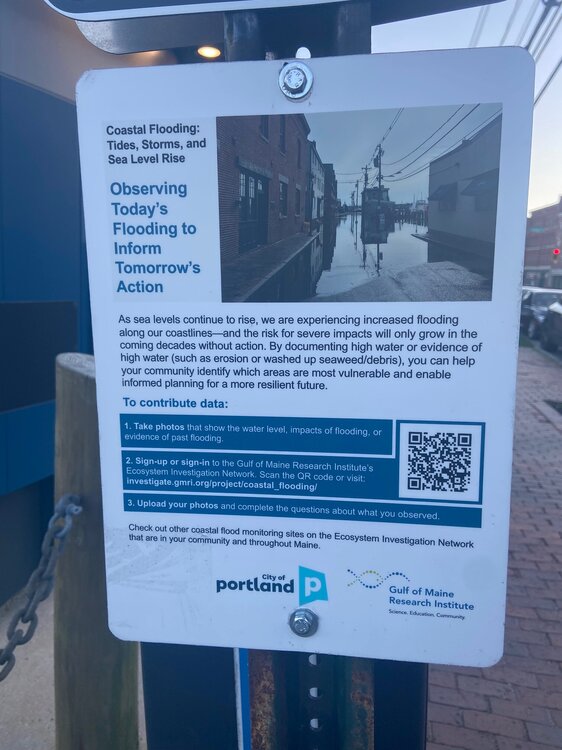
-
I am truly sorry to learn of your father’s passing. He was a very good person who helped make this place special. May he rest in peace and may his memory always brighten the world.
- 83 replies
-
- 10
-

-

-
July 2025 Discussion-OBS - seasonable summer variability
donsutherland1 replied to wdrag's topic in New York City Metro
It was July 8, 2024. -
July 2025 Discussion-OBS - seasonable summer variability
donsutherland1 replied to wdrag's topic in New York City Metro
If so, the last time Central Park was warmer than Bridgeport, Islip, JFK, LaGuardia, and Newark was May 1. -
July 2025 Discussion-OBS - seasonable summer variability
donsutherland1 replied to wdrag's topic in New York City Metro
Thanks Bluewave. I will have to check out Nickerson Beach. -
Yes. I tweeted about it. It was also the second this year (March 6: 72-62 was the other).
-
2025-2026 ENSO
donsutherland1 replied to 40/70 Benchmark's topic in Weather Forecasting and Discussion
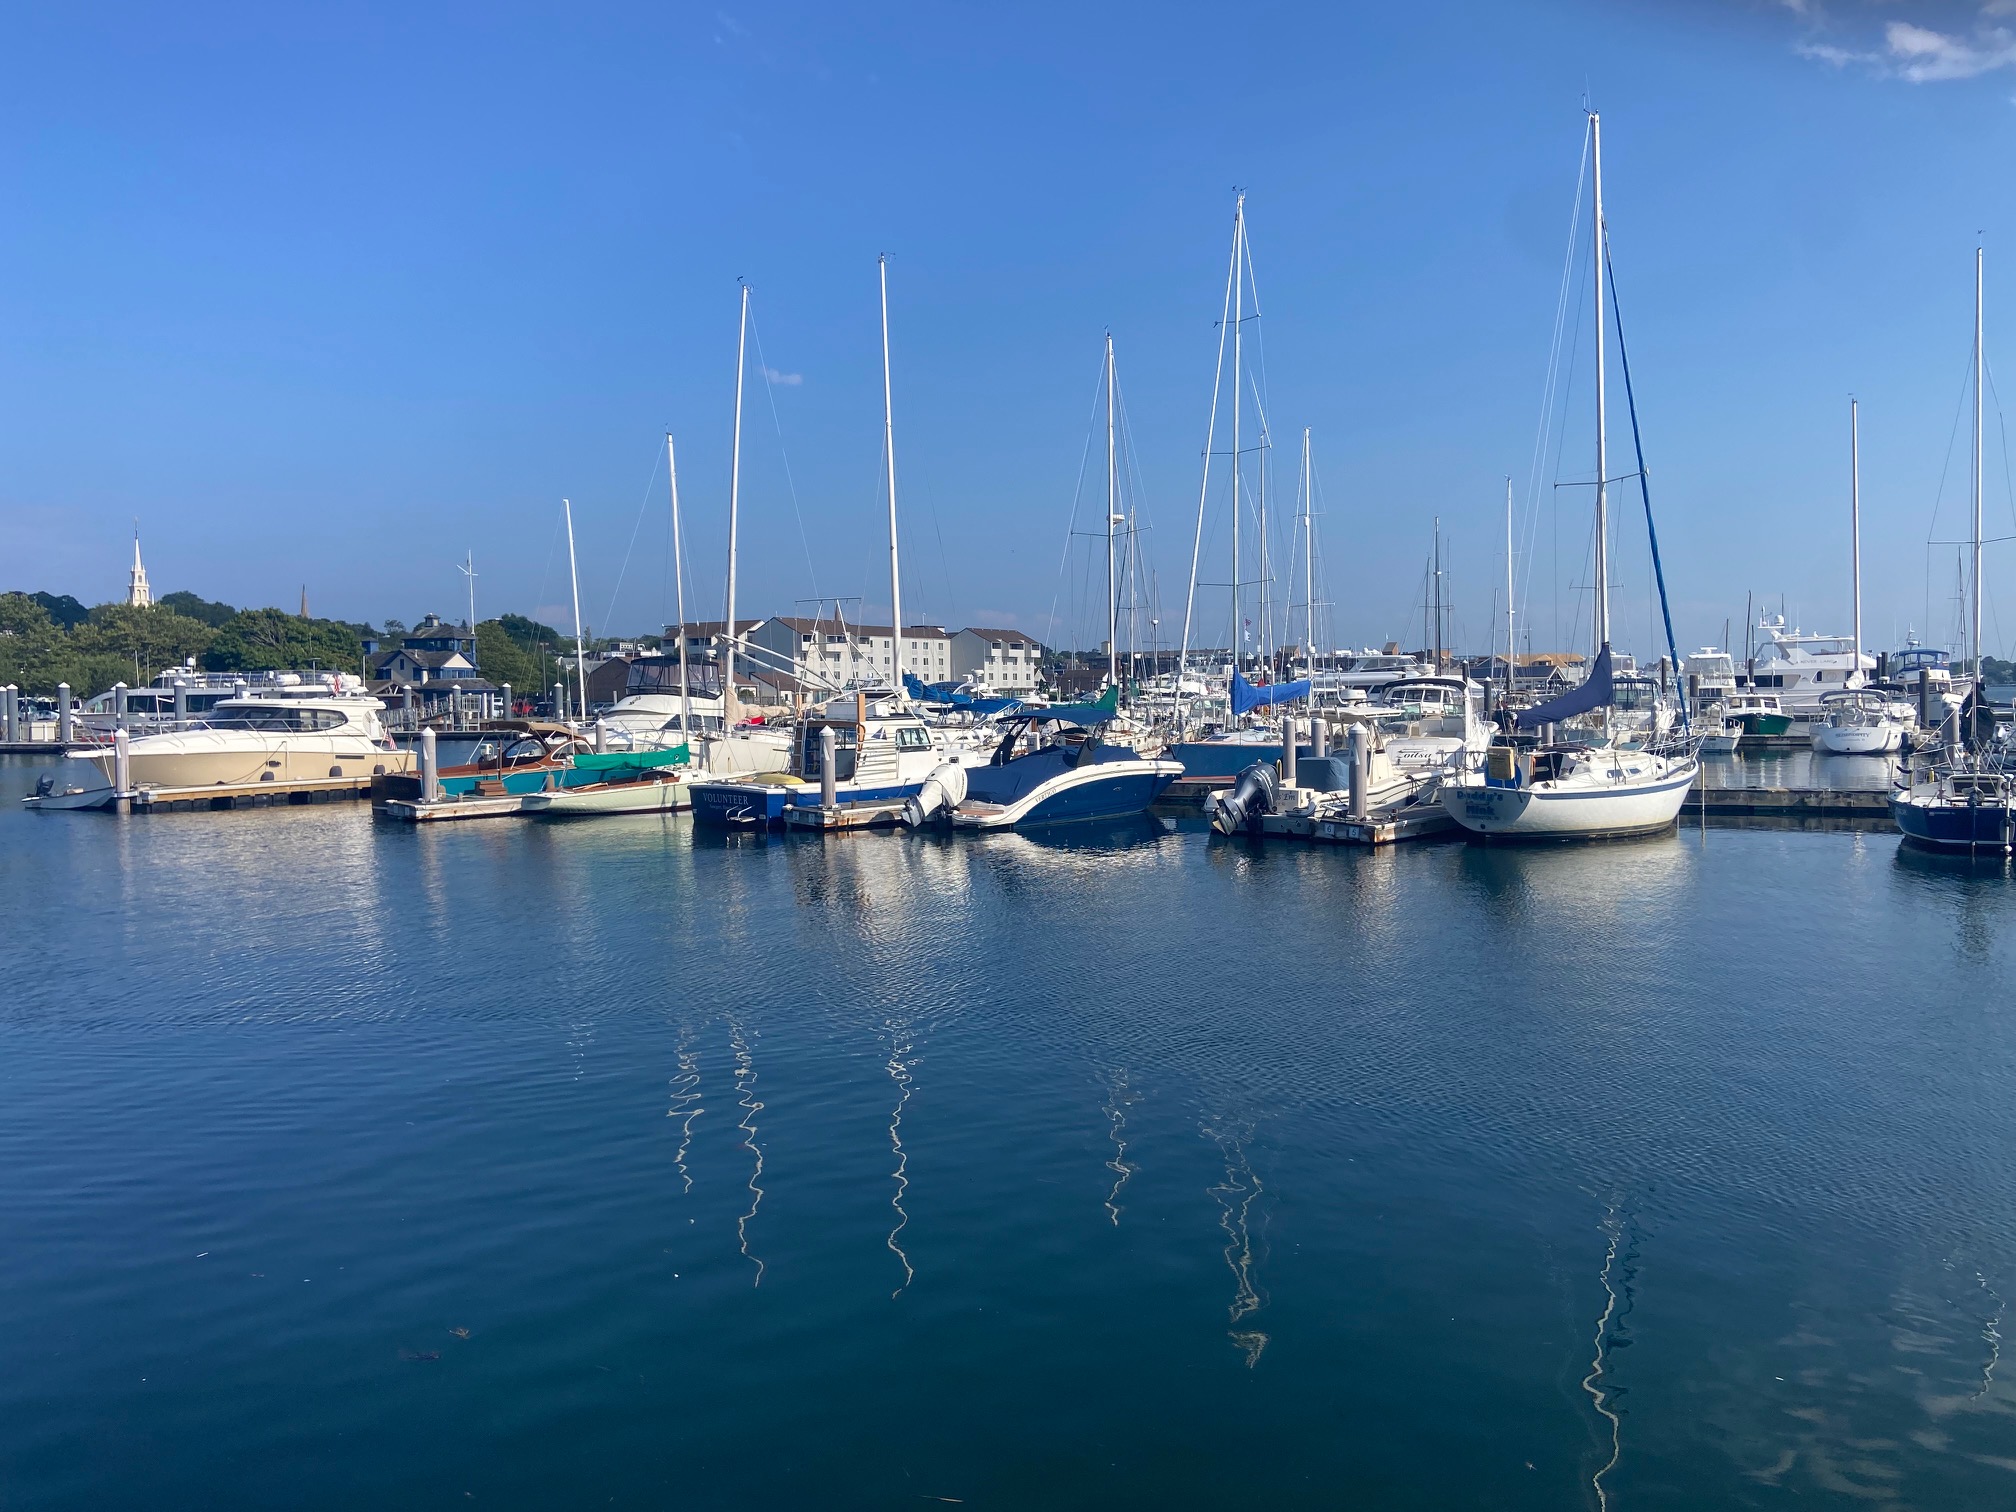
I just arrived in Newport on the first leg of my vacation. However, 1885-86 had 31.9” of snow. Its biggest snowstorm was 5.3”.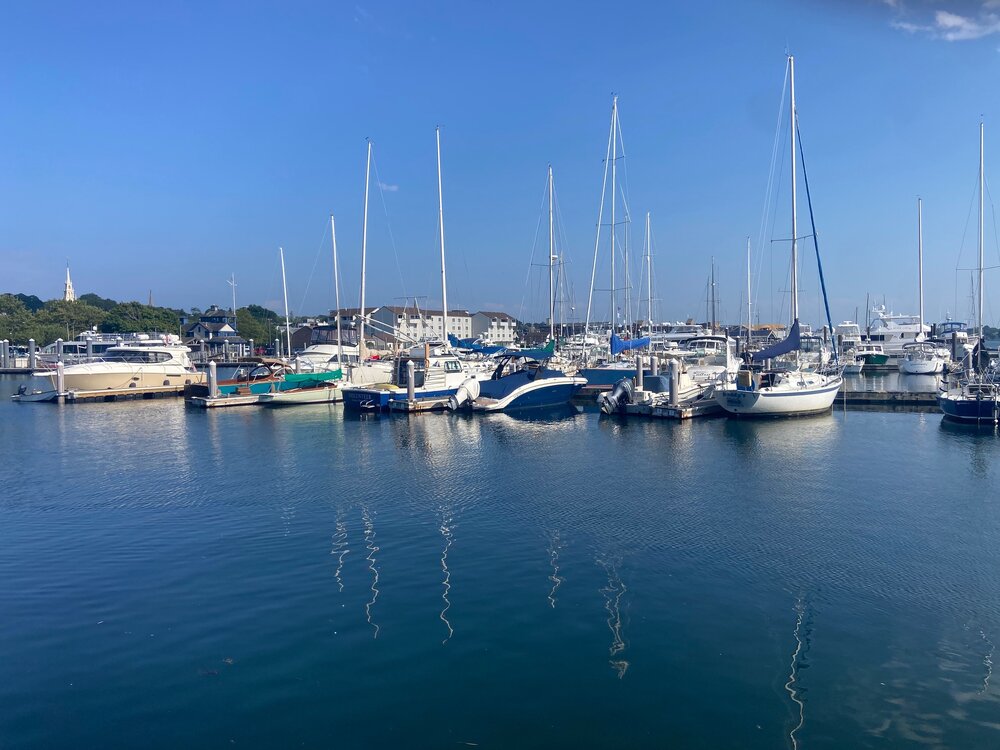
-
July 2025 Discussion-OBS - seasonable summer variability
donsutherland1 replied to wdrag's topic in New York City Metro
Parts of the region saw the mercury soar into the lower 90s today. LaGuardia Airport (92°) and Newark (94°) both reached 90° or above. A front will cross the region this evening. It could trigger some scattered showers and thundershowers. Behind the front, it will turn cooler and much less humid for tomorrow through the middle of next week. Tomorrow through Wednesday should feature bright sunshine, low humidity, and pleasant temperatures topping out mainly in the lower 80s. Low temperatures on Tuesday and Wednesday morning should be in the lower and middle 60s in New York City. Some outlying areas could see lows fall into the upper 50s, especially on Tuesday morning. A brief surge of heat is likely for Thursday through Saturday. Much of the region will see the temperature top out near or above 90° during these days. Friday will likely be the hottest day with temperatures reaching the middle 90s in New York City and upper 90s to near 100° in the hot spots, including Newark. Afterward, it will turn cooler, but readings will likely remain somewhat above normal. The ENSO Region 1+2 anomaly was +0.4°C and the Region 3.4 anomaly was 0.1°C for the week centered around July 9. For the past six weeks, the ENSO Region 1+2 anomaly has averaged +0.52°C and the ENSO Region 3.4 anomaly has averaged +0.07°C. Neutral ENSO conditions will likely continue through the summer. The SOI was +14.28 today. The preliminary Arctic Oscillation (AO) was -0.456 today. Based on sensitivity analysis applied to the latest guidance, there is an implied 80% probability that New York City will have a warmer than normal July (1991-2020 normal). July will likely finish with a mean temperature near 79.1° (1.6° above normal). -
July 2025 Discussion-OBS - seasonable summer variability
donsutherland1 replied to wdrag's topic in New York City Metro
Yesterday was yet another day that saw Central Park record the lowest high temperature among Bridgeport, Islip, JFK Airport, LaGuardia Airport, Newark, and White Plains. It was also the 11th time this summer. That is tied with the record for June 1-July 19 that was set in 2017. The summer record is 17 days during summers 2007 and 2017. -
Yes, it’s a fairly new station.
-
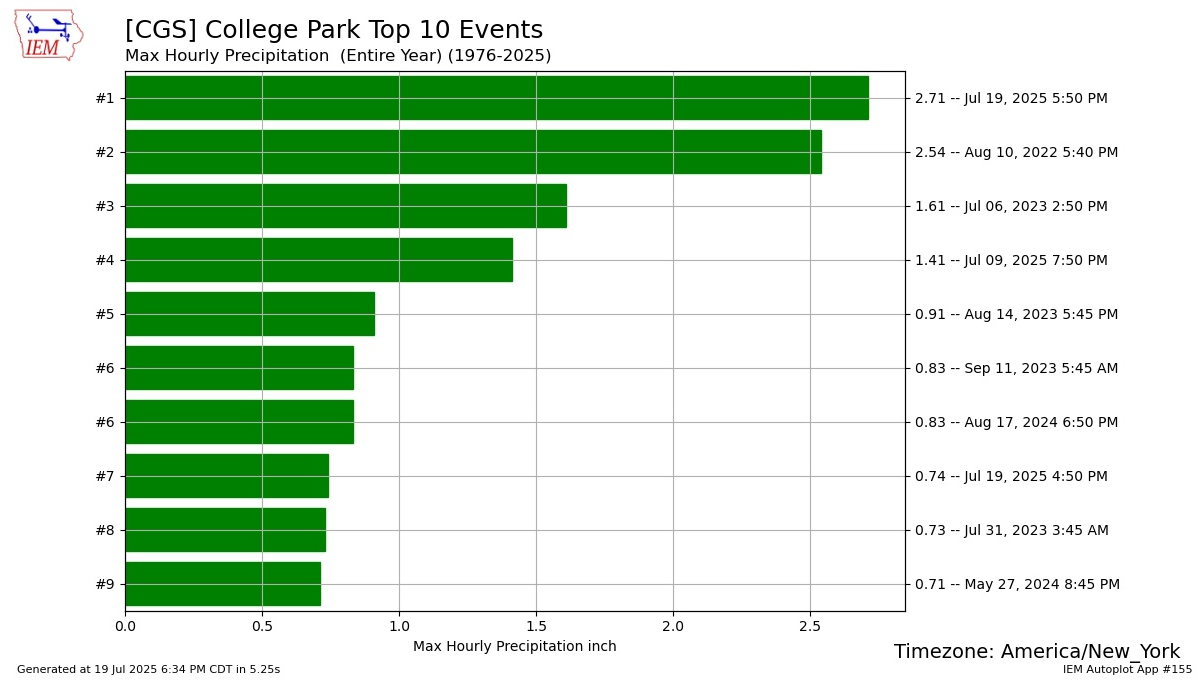
College Park picked up an hourly record 2.71".

-
July 2025 Discussion-OBS - seasonable summer variability
donsutherland1 replied to wdrag's topic in New York City Metro
A few parts of the region could see a shower or thundershower this evening or overnight. Tomorrow will be steamy with highs in the middle and perhaps upper 80s. A few of the hot spots could reach 90°. Additional showers and thunderstorms are possible tomorrow evening into Monday morning as a cold front moves across the region. Behind the front, it will turn somewhat cooler and much less humid through the middle of next week. Monday through Wednesday should feature bright sunshine, low humidity, and pleasant temperatures mainly in the lower 80s. Low temperatures on Tuesday and Wednesday morning should be in the 60s in New York City. Some outlying areas could see lows fall into the upper 50s on Tuesday morning. No widespread and sustained excessive or record-challenging heat appears likely through the first three weeks of July. However, some of the guidance continues to show a brief surge of high heat late next week. The last three cycles of the ECMWF and EPS are particularly bullish with the potential heat. The ENSO Region 1+2 anomaly was +0.4°C and the Region 3.4 anomaly was 0.1°C for the week centered around July 9. For the past six weeks, the ENSO Region 1+2 anomaly has averaged +0.52°C and the ENSO Region 3.4 anomaly has averaged +0.07°C. Neutral ENSO conditions will likely continue through the summer. The SOI was +14.40 today. The preliminary Arctic Oscillation (AO) was -0.452 today. Based on sensitivity analysis applied to the latest guidance, there is an implied 78% probability that New York City will have a warmer than normal July (1991-2020 normal). July will likely finish with a mean temperature near 79.0° (1.5° above normal). -
2025-2026 ENSO
donsutherland1 replied to 40/70 Benchmark's topic in Weather Forecasting and Discussion
The snowiest city could be Valdez, AK with average annual snowfall of 325.3" of snow. -
2025-2026 ENSO
donsutherland1 replied to 40/70 Benchmark's topic in Weather Forecasting and Discussion
Yes. I recall it. I was visiting my sister in Patchogue.