Quincy
-
Posts
6,220 -
Joined
-
Last visited
Content Type
Profiles
Blogs
Forums
American Weather
Media Demo
Store
Gallery
Everything posted by Quincy
-

Central/Western Medium-Long Range Discussion
Quincy replied to andyhb's topic in Central/Western States
The Euro indicates some severe risk for Sunday into Monday across the Plains and perhaps extending into the lower Missouri/upper Mississippi Valley regions. With an upper level trough digging, an increasing low-level jet and one or more surface lows developing along a front, there could be some potential. The GFS also points at an increasing threat at this time frame. A lot can change, but it's worth keeping an eye on. -
Central/Western Medium-Long Range Discussion
Quincy replied to andyhb's topic in Central/Western States
Some similarities to June 17th especially, at least given the slow/lazy storm motion and proximity to the NE/SD border. 00z NAM and GFS are still onboard. They're actually in fairly good agreement with the severe parameters near the warm front in southeastern SD by mid to late afternoon. Strong turning in the lowest 1-1.5km, a weakening cap and plenty of instability - assuming there's at least some clearing during the day. Both the GFS and NAM are showing >200 m2/s2 0-3km and >100 m2/s2 0-1km helicity. This combined with 30-40 knots (or more) of shear and as mentioned, there could be significant severe. I'm very interested to see the HRRR come into range. The 4km NAM simulated reflectivity shows a somewhat messy storm mode firing around 7-8 p.m. Will the window be that narrow/will initiation be that late? We'll see how the high resolution models trend. Either way, it's looking very interesting from far northeastern Nebraska into southeastern South Dakota, up to about or just north of I-90. Even the forecast soundings for KFSD look impressive with enlarged hodographs. Intriguing for any time of the year, but especially for August.
-
There was a lot of anticipation leading up to July 15th. Some argued there was a "very impressive" severe setup unfolding for (southern) New England, but there was plenty of disagreement with the placement and potential severity of such an event. For a quick summary, the severe weather parameters in place (both forecast prior and during) the event were marginal compared to past severe events in southern New England. Not one important severe weather parameter was terribly impressive and there were many pieces to the puzzle that were missing here. As of July 17th, there have only been a handful of severe wind reports, centered over a small geographical area between far northeastern Massachusetts and adjacent far southeastern New Hampshire. There were a few damaging wind reports in downeast Maine, along with two marginally severe hail reports. Although there were several tornado warnings in the area, only one tornado has been confirmed so far. That was an EF-1 in Somerset County, Maine. (this blog post will be edited if any additional tornadoes are confirmed) Flooding was more of a widespread issue across much of New England and extending down into the NYC metropolitan area and New Jersey. There are some misconceptions as to what constitutes as a “significant” or “impressive” severe setup in New England. Generally almost all significant severe outbreaks occur with a west to northwest flow aloft and an anomalously strong overlap of shear (speed and directional) and instability. While it’s not uncommon to see strong instability and significant wind shear in this part of the country, they don’t often coincide with each other. There are other setups too, which are usually more marginal, sporadic and difficult to forecast. While some southwest to southerly flow events have produced severe, unless key ingredients are in place, those events usually only result in widely scattered or isolated severe reports. This event was well-modeled in the synoptic view. There was an anomalously strong upper level cutoff low moving into the Great Lakes. Ahead of this feature, there was a surface cold front advancing through Pennsylvania and New York with a pre-frontal/lee-side surface trough axis across New England by the morning of July 15th. While this may sound like a good setup, as often is the case in this part of the country, many additional things have to line up just right. If one or two (or more) variables don’t pan out right, then the whole setup will likely underperform compared to expectations. Timing was also another issue, as with the cutoff low displaced so far west from New England, the best forcing would also remain further west. The mesoscale models were predicting anywhere from 500 to 1,250 J/kg of MLCAPE (with somewhat greater SBCAPE) coinciding with 30-40 knots of bulk shear across central New England and portions of western southern New England. While both parameters are what can be considered “elevated,” they are on the low end (lower 50 percentile) for what has been observed in the Northeast in prior tornado cases. When looking at severe producing supercells in general (all types/modes), the values mentioned above are actually even less significant. Consider that the mean bulk shear value for supercells in the southwestern New England window* is 44 knots with a mean MLCAPE value of 1,421 J/kg. So, there were two key parameters in place that were elevated, but not terribly impressive in comparison to past severe events. There is another piece here that made the whole setup look even more marginal. Storm relative helicity or SRH (effective) was very meager on the computer forecast models for July 15th across most of the area. The progs were only between about 50 and 100 m2/s2. This is again on the low end, when considering that the mean SRH value for tornado and supercell cases alike in the area is 139 m2/s2 (which some cases over 300 m2/s2). While looking at this forecast setup from a strict numerical standpoint, while the threat of tornadoes and other severe weather were somewhat elevated, it was clearly a “below average,” or in other terms, an “unimpressive” setup. As far as the model simulated radar guidance, the NAM struggled to develop much in the way of discrete cell activity across southern New England, instead favoring a line of thunderstorms moving in from eastern New York by late afternoon and evening with stronger forcing ahead of the cold front. The HRRR was a bit more alarming, with a line strong to severe cells and clusters moving into southwestern New England by late afternoon. The HRRR by the 11z and 12z runs were showing some weak convection along the pre-frontal trough giving way to stronger convection further west later on. The morning of July 15th: Convection was already firing along the pre-frontal trough by midday, but due in part to limited heating, and weak forcing, the activity across Connecticut and south-central Massachusetts never reached severe limits. The HRRR continued to show stronger activity later in the day, but later runs gradually backed off on that idea. It was clear from the start that there was also a fairly unidirectional shear pattern with not much backing of low-level winds. Surface observations through the entire event, including the early to mid morning hours, showed surface winds S to SW. It cannot be overlooked that a small area from northeastern Massachusetts into southeastern New Hampshire and much of Maine did see scattered strong to severe thunderstorms develop later on during the afternoon. Analyzing the severe weather parameters on July 15th: The models did a good job of predicting wind shear, as the SPC mesoscale analysis showed an average of about 40 knots of bulk shear across the area, with more across northern and northwestern sections and less across southern and southeastern sections. MLCAPE was also close to model guidance with generally 1,000 J/kg, on average. The pre-frontal activity did decrease instability across Connecticut with a noticeable uptick in CIN, especially in the vicinity of the trough. It was across northeastern Massachusetts and points northwest where less CIN and more significant SBCAPE values supported more in the way of storms being able to reach marginally severe limits. Taking a step back, the mid-level lapse rates were fairly unimpressive across the area and this was acknowledged by SPC leading up to the event. The reanalysis showed lapse rates of 5.5 C/km or less across much of southern New England, with some lapse rates over 6 C/km across Maine. Upper level considerations: Analogs very strongly favored a relatively low-end severe event, especially given the position of the upper level low and the fact that the flow aloft was out of the SW. The RAP analysis from July 15th shows that the most significant vortmax was located very close to the upper level low, which was west of even western New York. There was some positive vorticity advection across northern New England, which likely was a factor in boosting some of the severe thunderstorms north and northwest of Boston, Mass. The mesoanalysis showed a weak, elongated vortmax between 18z on the 15th and 00z on the 16th, but this was up across northern Vermont and the northwestern Maine/Canada border. Finally, when also looking at the upper level flow, it was once again below climo levels with respect to significant severe events. The GYX and OKX soundings showed just 40 knots and 39 knots respectively of 500mb flow at 12z on the 15th. The upper level flow actually decreased notably at OKX to 31 knots by 00z on the 16th. While severe events can occur in the Northeast with limited upper level flow, the more impressive events typically have much stronger flow aloft. It should also be mentioned that the 850mb jet was unimpressive, with wind speeds of just 20 to 30 knots. Only one run of the Euro showed a signal of a strong jet and that was 144 hours prior, when it was predicting 45-55+ knots of 850mb flow. The relatively weak flow and generally unidirectional shear pattern can be seen clearly in the 12z July 15th OKX sounding: Considering the mesoscale models: The HRRR performed poorly on the larger scale, as it did not show pre-frontal activity contaminating the environment across southwestern New England. Instead, it was more optimistic in terms of severe and even showed somewhat alarming significant tornado parameter values over 1 across much of Connecticut. Although some convection did cross over from Long Island into Connecticut, this wasn’t until late at night and most of that activity was marginally severe or below severe limits. Some fairly weak storms did fire across eastern New York by late afternoon, but those merged with other convection to form a very messy storm mode, one that favored training of heavy rains and flash flooding. The models also showed more backing of low-level winds than what was observed on the morning of July 15th and through the event. In summary, what went wrong? While it’s easy to blame the entire bust on early day convection across Connecticut, consider again the forecast parameters in place that verified very closely to the actual analysis. Instability was somewhat elevated, but still modest at best with around 1,000 J/kg of MLCAPE. Shear was also elevated, but 40 knots of bulk shear is somewhat below the average for past severe cases. One of the most glaring parameters missing from the equation was helicity. Helicity was expected and verified to be quite low on the spectrum, with 100 m2/s2 at best, while tornado activity favors more than that. With a SW flow aloft, a more strongly backed low-level wind profile would have supported a greater threat of severe. Instead, any backing was minimal, with the mean low-level wind flow being S to SW. It would have been one thing if mid-level lapse rates were impressive, to offset some of the other marginal parameters, but 5.5 C/km is not going to make up for everything else. *
-
June 16-18 Tornado Outbreak
Images added to a gallery album owned by Quincy in Members Albums Category
Here are some images from the tornado outbreak that affected portions of the Upper Plains with several violent tornadoes from June 16th-18th of 2014. Some are photos and others are screen-grabs from video. -
-

From the album: June 16-18 Tornado Outbreak
I stand for a picture with a tornado in Alpena, SD, just a few minutes before it roped out. -

From the album: June 16-18 Tornado Outbreak
The tornado that tracked from Lane to Alpena, SD can be seen here near the beginning of its cycle. -
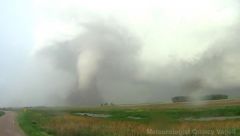
From the album: June 16-18 Tornado Outbreak
The Alpena tornado appears fairly large at this point. -

From the album: June 16-18 Tornado Outbreak
The Alpena tornado spins in a field next to a twisted road sign. -

From the album: June 16-18 Tornado Outbreak
A violent tornado near the end of its cycle in Alpena, SD on June 18th. A few uprooted trees can be seen in the foreground. -

From the album: June 16-18 Tornado Outbreak
On June 17th, several tornadoes continued into the night, not far from Laurel, NE. -

From the album: June 16-18 Tornado Outbreak
The tornado mentioned previously in Laurel appeared to have multiple vortices at times. -

From the album: June 16-18 Tornado Outbreak
A series of tornadoes tracked erratically on June 17th from the late afternoon hours and lasted well into the evening. This was most likely the first of this family of tornadoes, a wedge in the vicinity of Laurel, NE, -

From the album: June 16-18 Tornado Outbreak
My view of the icon and historic twin tornadoes in the vicinity of Pilger, NE. -

From the album: June 16-18 Tornado Outbreak
The first tornado was just beginning to rope out at this point. A short time later a wedge tornado dropped about 90 degrees to the right. A second wedge would form minutes later just to the right of that vantage point... -

From the album: June 16-18 Tornado Outbreak
The first of a family of violent tornadoes touches down in Stanton, NE on June 16th. This is within a minute or so after the tornado first touched down. -
Here are some filtered snowfall maps that I created using reports from various sources. Many of the reports came from this forum and the National Weather Service. Only social media reports that passed through quality control were considered. After early afternoon highs in the lower 60s across much of Connecticut on April 15th, a strong cold front moved through the area at night. Rain quickly changed to sleet and snow across the higher elevations of western Connecticut between 8 and 11 p.m. Although a changeover eventually took place from west to east across most of the state, the heaviest snow fell across western Connecticut. Snow ended before the pre-dawn hours on the 16th. Snowfall amounts of 1 to 2″ were common across northern Fairfield and Litchfield Counties. Although there was a gap in the data, it is possible that there were more reports of greater than 2″ across the Litchfield Hills. With this relatively small sample, the highest amounts were from Redding to Roxbury with 2 to 3″ or so. The radar image above left shows a band of heavy snow across northwestern Connecticut shortly after 12:30 a.m. on the 16th. As of 2 p.m. on April 16th, temperatures across the higher terrain in western Connecticut were only in the mid to upper 30s. As is often the case with early spring snowfalls, unseasonably cold air followed the snow. Here is a black and white version of the map: Click here for a complete list of snowfall totals used in these maps.
-
Following up a cold winter across much of the country, April has proven to be a transition month. Although the month started mild for a large portion of the country, much cooler air has moved in for the middle of the month. There are signs, however, that any negative temperature departures after April 20th into the start of May will be relatively insignificant. Before looking at May, it makes sense to look at the April forecast. For the most part, everything is going to plan from the forecast that was made on March 15th. Although portions of the Northeast have been milder than forecast for the month as a whole, one and perhaps two shots of cool air to finish the second half of April will likely counteract the present offsets. As far as the models go, the Euro MJO prediction of moving into phase 2 and 3 verified very well, although the MJO has since looped back around into phase 5 an 6. Click here for a follow-up to the April forecast. Going forward, there continue to be signs of the remnant winter pattern of troughs across the East Coast breaking down. The Euro shows no clear move with the MJO, although it tries to keep it in the vicinity of phases 4-6 to even neutral. Each of those phases would suggest near to slightly above average temperatures for much of the center and eastern portion of the country with slightly below average temperatures across portions of New England. The GFS ensembles move toward phase 8 and 1, suggesting more of a northern Plains warm-up with near to even below average temperatures near the Gulf States. With no strong signals with respect to the MJO, focus shifts toward the Euro and CFS. The Euro weeklies show a fairly zonal pattern with only near to slightly above average temperatures for much of the area. Much like the MJO projections, such a pattern could yield near average temperatures across the Gulf States. The CFS is robust with warming across the upper Plains and yields near to slightly above average temperatures for most other areas. While the CFS keeps the upper Great Lakes below average, this may be overdone due to below average water temperatures. Final considerations and forecast: The thinking is that the persistant drought across the desert Southwest and adjacent lower Plains will continue. This will especially be the case if the CFS is correct with pronounced ridging in the area. The dry soil will tend to favor above average daytime temperatures. So while there may only be substantial confidence in slightly above average temperatures in the range of 1 to 2F across the mid-Mississippi and Ohio Valleys, a +2 to +3F anomaly forecast has been introduced for portions of the western lower Plains. Ridging could extend into the Great Lakes, but still below average water temperatures should mitigate any warming, especially downwind of a prevailing west-southwest flow. There is moderate confidence in some cooler than average temperatures hanging on across northeast New England, so a small area of -1 to -2F anomalies are included for Maine. Severe thunderstorms: A forecast graphic is not being made for this outlook with respect to severe thunderstorms. The year 2014 continues to follow a near-record low number of severe thunderstorm events and tornadoes. A series of severe weather events, which may or may not be significant, are possible between April 23rd and 25th. Beyond that, a fairly zonal flow with some above average heights in the Plains and Midwest does not look overly impressive for severe activity. However, the pattern will favor at least an increase to near average activity through the month of May. In summary, the severe thunderstorm forecast is close to climatology and has little confidence in specifics. Prior years that saw very low activity through mid-April did see an increase in activity by late April. A close analog to 2014 is 2010. That season saw an uptick in severe reports between the end of April and through the month of May.
-
Severe thunderstorms are likely today across portions of the Plains and Mississippi River Valley. Ongoing thunderstorms early this morning may be marginally severe across portions of Iowa, northern Missouri and Illinois. Additional showers and thunderstorms are likely from late morning into the early afternoon hours further south before a more serious threat develops. Sunday afternoon, low pressure will be in the vicinity of the central border between Texas and Oklahoma. An upper level shortwave will begin to rotate through the area with a vortmax swinging into eastern Oklahoma. Thunderstorms will likely fire just ahead of a dryline during the afternoon hours. These thunderstorms can explosively develop, producing large hail, damaging winds and at least a few tornadoes. The greatest potential for tornadoes will be from extreme northeast Texas into eastern Oklahoma. There is some uncertainty with respect to how far north this threat will extend, but the area south of the KS/OK/MO tri-state border has the highest probability of seeing tornadoes. There is high confidence that there will be numerous severe reports, but it is not clear over how large of an area the most intense storms will extend. Climatology suggests that the tornado threat could extend further east into Arkansas and southern Missouri late Sunday night into early Monday. Although this is possible, a loss of heating and a cold front overtaking the dryline should mitigate the risk after 12 a.m. Monday.
-
The potential exists for a low-end severe weather outbreak across portions of the Plains this weekend, April 12th-13th. The first focus is on Saturday afternoon into the overnight period across the central Plains. Surface low pressure is forecast to move to a position in the vicinity of the Oklahoma panhandle by 00z Sunday. Now while there is good agreement among the models of destablization in the warm sector, capping will likely mitigate any convective activity for most of the day. However, by late afternoon and into the evening hours enough of the CAP may erode to allow for some isolated severe thunderstorms. In the upper levels, a broad positively-tilted trough is projected to be crossing the Rockies late Saturday. The NAM and GFS show an embedded, but small vortmax being ejected northeast from Kansas toward the Missouri/Iowa border Saturday night. Wind fields are not overly impressive and the 18z NAM low level jet appears overdone. With that said, at least 30 knots of bulk wind shear is modeled. CAPE values via the NAM and GFS exceed 2000 J/kg from Oklahoma up into Kansas and northern Missouri. The Euro has increased instability somewhat from the 00z run, but only maxes out values around 2000 in eastern Kansas. Given the amount of CIN that has to be overcome, the severe potential here is marginal at best. Given the time-frame three days out, the exact positioning and severity of this threat could shift. A somewhat more favorable severe setup may develop on Sunday. As the upper level trough digs into the southern Plains, surface low pressure deepens and slides southeast through Oklahoma and into northern Texas. With the trough axis approaching a neutral tilt, the overall dynamics alone become supportive for severe thunderstorms. At the surface, low pressure matures across far northern Texas Sunday afternoon as a strong cold front quickly dives south. A moist southerly flow will aid with moisture transport as dew-points move into the mid and upper 60s. The GFS also shows lifted indicies as low as -12. Ahead of the dryline, a moderately unstable air-mass is forecast on both the GFS and Euro. The GFS has 1500-2500 J/kg of CAPE across eastern portions of Texas into southern Oklahoma with the Euro showing similar instability levels. There should not be much capping, so convective can initiate ahead of the dryline with isolated supercells possible in the warm sector as well. Kinematic support increases with bulk shear in excess of 50 knots possible further south of the low across Texas. While damaging winds and hail may be the most significant threats, the setup may also be supportive of at least a few tornadoes. Severe thunderstorms could continue into early Monday, with at that point the cold front should have overtaken the dryline. The result would be more of a squall line with potentially damaging winds than discrete supercell structures. If the somewhat faster GFS is correct, the threat would extend further east into Arkansas and Louisiana. While confidence is greater in the severe threat on Sunday, a faster-moving cold front or weaker storm system could alter the forecast. There is relatively narrow window during the second half of Sunday that this system must align with in order for severe weather to be a significant concern. A quick note that the 18z GFS has trended toward stronger kinematic support for Sunday.
-
A colder than average pattern may persist into April across the Great Lakes and Northeast. Based on the information I've been reviewing over the past several days, I have enough confidence to post a temperature outlook for the month of April. As I see it, below average temperatures will likely continue from the Great Lakes into interior New England and up toward Hudson Bay Canada. I expect a continuation of troughiness extending from southeast Canada into portions of the Northeast. While the heart of the Arctic air should remain well north of the U.S. border, there are other factors coming into play. With the current Great Lake ice coverage being significantly above average, it is going to take quite some time for the ice to melt and for lake-water temperatures to rebound. This means that any wind flow over the lakes will likely bring at least locally cooler temperatures, with transport from cold water to the adjacent land. For portions of the Deep South and especially into the southern Plains, I am expecting slightly above to moderately above average temperatures. A gradual re-emergence of a "Southeast Ridge" combined with a general storm track (with shifting entirely possible) through the Ohio Valley and Northeast, warmer air should be able to extend from the lower Mississippi Valley toward the lower Appalachians. Further west, the long-term drought over the central and southern Plains may persist, which is return would tend to allow for higher daytime temperatures than what is observed on average. Temperatures along the immediate Gulf Coast may be able to remain near average, as sea-surface temperatures in the area are running somewhat below average. Further speculation into the potential severe weather season leads me to believe that a relatively slow start to the season will continue. With that said, I can see a scenario where the region from the Ark-latex into Mississippi and Alabama has the opportunity for at least a few severe weather outbreaks into the month of April. This is supported by climatology as well, but places such as Kansas, Oklahoma and western Texas may not see a marked increase in severe weather activity until the second half of April. Severe weather forecasting is challenging, because all it takes is one major event to leave a mark. 2013 is a great example, as while the overall year saw below average severe storm reports, there were at least a few particularly damaging events. Other supporting references: The Euro weeklies and now the extended day Euro ensembles show the Northeastern U.S. trough relaxing north with some ridging (above average temperatures) across the Gulf States. (this is for the final days of March leading into the start of April) The CFS up until late last week had a strong lean on well below average temperatures continuing across the Northeast. There has not been the greatest run-to-run continuity, but as of March 18th, there was at least moderate agreement with warming by the 2nd week of April. The extended CMC ensembles do show some troughing in the East to start April, despite substantially above average heights in the final days of March in the same area. The MJO is forecast by the Euro ensembles to move into Phase 2 and perhaps even Phase 3. The GFS ensembles move the MJO toward the edge of Phases 8 and 1, with the end of the curve clustering into Phase 1. More lean is placed on the Euro solution, however it should be noted that Phase 1 of the MJO favors below average temperatures in the eastern U.S., especially the Great Lakes. Phase 8 is closer to neutral/average. Phases 2 and 3 both match up more closely to Phase 1, with below average temperatures in the East and well below average temperatures from the Great Lakes into New England and southeastern Canada. The 1993-94 seasonal analog has matched up in more ways than not to 2013-14. April 1994 saw a return to near and slightly above average temperatures in the East, with some stations reporting well above average temperatures in the Deep South and southern Plains. March 1967 has several days that match up closely to the predictions for the latter half of March 2014. April 1967 featured considerably warmer than average temperatures across the southern Plains. With all of the factors considered, I think this is a fair forecast to make at this point. Since we're talking about temperatures averaged out for the entire month of April, it's possible that an overall colder than average pattern lingers into the beginning of April before shifting. It is likely that even in such a pattern, we could see a couple of bouts of warmth. A good example is at the end of March. While as of March 18th there was a strong signal for an East Coast low around March 25th-26th, the consensus at this point is that some above average temperatures reach the Northeast once the low passes. On Saturday, I said this: There is a growing signal of a late-season winter event from March 25-26. However, given the overall troughy pattern expected to start April, there could be yet another winter event between April 1-5. I contemplated putting together a precipitation forecast, but rain/snowfall can vary substantially over a region, especially this time of the year. I think the pattern will remain active and perhaps some of this activity could help relax the drought in the Plains come later this spring. This was outlook was originally created on Saturday, March 15th, but I have added a few things here and there as new data as arrived. The maps and overall thinking have not changed. This is my first stab at a formal long-range forecast, so a lot will be learned by watching how the trends pan out.
-
Here are some filtered snowfall maps that I created using reports from various sources. Many of the reports came from this forum and the National Weather Service. Only social media reports that passed through quality control were considered. Flurries and light snow moved into Connecticut around daybreak on February 18th as low pressure formed east of New Jersey. The snow moved east and began to develop into a steadier area of snow across New Haven and Middlesex Counties. As a compact, but potent low pressure system developed over Long Island, a band of heavy snow formed near and just east of I-91 from the New Haven area up to the Massachusetts border. Snowfall rates of 1 to 2 inches per hour were observed in many locations. The snow changed to a bit of rain across extreme southeastern Connecticut before ending. Some mixed snow and ice pellets were also noted near the shoreline from New Haven and points east during the afternoon. Snow ended in northeastern Connecticut by late afternoon. A general 3 to 6 inch snowfall was observed for the eastern half of the state. Less snow fell in western Connecticut and across southeastern sections. There was a narrow band of 6"+, extending from near Meriden, northeastward up to Somers. Here in New Haven, the total snowfall was 4.1" Toward the end of the storm, 1.2" of snow fell in just one hour from noon to 1 p.m. The precipitation ended as snow pellets shortly after 1 p.m. Here is a black and white version of the map:
-
Here are some snowfall maps that I created using reports from various sources. Many of the reports came from this forum and the National Weather Service. Only social media reports that passed through quality control were considered. Light snow overspread the state from southwest to northeast shortly after midnight on February 5th. This was ahead of a low pressure system that was moving into the eastern Ohio Valley. The snow quickly became heavy at times around daybreak, with snowfall rates of 1 to 3 inches per hour. A gradual change to sleet and freezing rain also took place through the morning from south to north. Warmer air flooded in aloft, although there was a cold layer that was very slow to erode near the surface. Around midday, there was a break in the action with just some spotty drizzle and light mixed precipitation. The shoreline and parts of eastern Connecticut did briefly rise above freezing. A glaze of ice was observed between I-95 and I-84, with the most significant icing across the climatologically favored sheltered areas of Fairfield and New Haven Counties in the vicinity of Route 15. An inch of sleet was reported in many areas and the size and intensity of sleet that I observed was the most impressive I can ever recall. During the afternoon, colder air moved in as a secondary low developed just south of Long Island. Precipitation ended as a few snow showers on the night of the 5th, with a few flurries into the early morning hours on the 6th across eastern Connecticut. Snowfall totals between 8 and 10 inches were common. Somewhat less snow fell along the immediate shoreline and in eastern Connecticut. The higher totals were around a foot across central and northwest portions of the state. Here is a black and white version of the map with filtered reports:
-
Here are some snowfall maps that I created using reports from various sources. Many of the reports came from this forum and the National Weather Service. Only social media reports that passed through quality control were considered. Flurries began to move into Connecticut shortly after daybreak on January 21st. The snow gradually overspread the state from southwest to northeast and light accumulations were noted across southwestern Connecticut by midday. As an area of low pressure developed off the mid-Atlantic coast during the afternoon, a band of heavy snow developed along a SW to NE axis from Philadelphia into Long Island. This band of heavy snow lifted northward and made it about as far as I-84 in Connecticut. Drier air won out on the northwest side of the storm as snowfall totals across Litchfield and Hartford Counties were generally lower than forecast. Areas southeast of the I-95 corridor from Bridgeport to the Rhode Island border also saw less snow, as the heaviest band of snow lifted inland. The below radar image demonstrates where the heavy band of snow maxed out. Most of the higher-end snowfall totals were observed in the green shading: With low pressure moving eastward early on January 22nd, snow tapered off from west to east during the pre-dawn hours. By daybreak, the accumulating snow was over and air temperatures had dropped into the single digits above, and in some cases, below zero. Liquid-to-snow ratios with this storm were fairly impressive. Ratios were commonly in the 20-25:1 range, although some locations observed even greater ratios. Here is a sampling of some of the ratios that were reported: North Grosvenordale: 30:1, Oakdale: 26:1, Stratford, 26:1, Portland: 20:1, Essex: 19:1, West Hartford: 18:1. The result was a very light and fluffy snow that was very easy to move and shovel. The fluffy nature of the snow also resulted in settling and compaction. Here in New Haven, the final snowfall was 8.0". Most of the snow fell before 10 p.m. Snowfall rates averaged around 1" per hour from about 4 p.m. to 7 p.m. when the band of heavy snow moved through the area. The depth of snow as of the afternoon on January 22nd was approximately 6". Liquid equivalent precipitation amounts were generally less than modeled across Connecticut. Common values were near 0.2 to 0.3", with lower amounts across north-central and northwestern parts of the state. The SREF data did an excellent job at nailing down a region for heavy snow from the northern half of New Jersey into southwestern Connecticut. It was here that the model showed strong frontogenetical forcing and was eluding to a snowfall maxima. With that said, the SREF and many other models were too generous on the northwest side of the storm for precipitation amounts. Here is a black and white version of the map with filtered reports:
-
Here's a recap of the 2013 tornado season across the Northeast. Connecticut had four reports of tornadoes during 2013, which is roughly twice the average amount of about two. Keep in mind that 2012 had no tornadoes in the state, so one could argue that this was nature's way of balancing itself out. Elsewhere, New Jersey was the only other state in the Northeast with above average tornado reports. (They average two per year, but had three in 2013) Maine is not pictured here, but Maine had at least two tornado reports. Since they average two per year, that's right at average. Massachusetts also saw an average year with one tornado report. Vermont and New Hampshire typically average about one tornado per year, but both states saw no tornadoes this year. New York was well below average with just four tornadoes. The average there is 10 per year. Pennsylvania reported nine tornadoes, also well below their average of 16 per year. Averages based off of 1991-2010 reports, per NCDC. April 19th: An EF-1 tornado touched down near Bainbridge, N.Y. and was on the ground for 3.2 miles. (link) May 9th: A weak EF-0 tornado touched down near Stoughton, Mass., but the length of damage was less than 0.5 miles. This was a cold air funnel case and not a "classic" tornado. (link) May 28th: There were four tornado reports across northwestern Pennsylvania. Three of the tornadoes were rated EF-1s and one was an EF-0. The longest tracking tornado was an EF-1 that touched down near Edinboro and had a damage path of 18 miles long. May 29th: Two tornadoes were reported in eastern New York State. One was a significant, long-track tornado (EF-2). It was on the ground for 17 miles and the damage path was up to 1 mile wide. Another tornado, a weaker EF-1, was reported just to the southwest of that storm. (link) June 2nd: Two brief and weak EF-0 tornadoes were reported in Maine. June 27th: Two EF-1 tornadoes were reported in central Pennsylvania. July 1st: A somewhat unusual morning tornado (EF-1) was reported in extreme northeastern New Jersey. The same storm that was responsible for that tornado resulted in three tornado reports across Connecticut from late morning into early afternoon. The first report was an EF-0 that touched down in Greenwich. The most notable tornado was the second one, which was an EF-1 in the Windsor and Windsor Locks areas. A weak, brief EF-0 tornado was the third report in Enfield. (link) July 10th: A brief EF-1 tornado was reported near Moravia, Penn. during the afternoon. Less than an hour later, an intermittent EF-1 tornado was reported in Connecticut between Andover and Mansfield. The damage path of that tornado was 11.2 miles long. July 27th: An EF-1 tornado was reported in north-central Pennsylvania near Borie. That same storm dropped another EF-1 tornado in adjacent New York State about an hour later. The second of those two tornadoes was on the ground for 14 miles. August 7th: A minor EF-0 tornado was reported in southwestern Pennsylvania near Ralphton. August 13th: A weak EF-0 tornado was reported near Manahawkin, N.J. October 7th: An EF-1 tornado was reported near Paramus, N.J. The tornadoes pictured above across Delaware, Maryland and Ohio were not included in the above time-line. As might be expected, the strongest and longest-tracking tornadoes across the Northeast this year were across New York and northwestern Pennsylvania. Those areas are climatologically favored for significant tornadoes, at least when compared to areas further east. With that said, there have certainly been cases of strong tornadoes in southern New England. The most recent case was the deadly EF-3 tornado that tracked across south-central Massachusetts on June 1st of 2011. The above image is a composite that is not perfectly to scale. United States tornado seasons: Through then winter, the Gulf States are favored for tornado development. There was a minor event this past Sunday, on January 12th, that featured a few EF-0 tornado reports in extreme southeastern Virginia. Into spring, the focus shifts toward the Midwest and late spring into early summer is when the Northeast most commonly sees tornadoes.
-
Here are some snowfall maps that I created using reports from various sources. Many of the reports came from this forum and the National Weather Service. Only social media reports that passed through quality control were considered. Blowing and drifting snow made it difficult to obtain an accurate measurement. Some towns had multiple reports and totals that appeared to be too high based off of surrounding reports were not used. Some warm-advection snow lifted into Connecticut as early as the night of January 1st, the vast majority of the accumulating snow began on January 2nd. From morning through afternoon, flurries and periods of light snow moved from south to north across the state. By afternoon, some areas, mainly across the northern half of the state, reported an inch or two of snowfall. The 12z sounding from January 2nd at OKX indicated somewhat of a dry layer aloft, while ALY was more saturated. The best snows early on were measured from central New York into portions of interior Massachusetts. During the evening, low pressure eventually developed off of the mid-Atlantic coast and an area of snow filled in across Connecticut. It was from about 9 p.m. to 4 a.m. that the heaviest snow fell. The bands of heaviest snow wound up remaining south of Connecticut and there were even more impressive snowfall totals across eastern Massachusetts. There, ocean-enhancement was a key role in significantly higher snowfall amounts. In Connecticut, accumulating snow ended by mid-morning on January 3rd, with most areas receiving anywhere from 4 to 7 inches of snow. There was a narrow band of 7 to 7.5 inches across the northern part of the state, where additional snow during the beginning of the event increased overall totals. Close to the coast, there were also a few totals of 7 to 7.5 inches, where some towns were grazed by heavier snow toward the end of the event. While there were a few snowfall totals reported in the range of 8 to 9+ inches, those did not line up with other totals in the same or neighboring towns. Strong winds caused blowing and drifting snow, which was the most likely cause for the totals that were assumed to be erroneously high. One variable that was generally missed by the computer forecast models was lower liquid-to-snow ratios. While these ratios are generally close to 10:1, model forecasts predicted anywhere from 15-20:1 ratios, or even higher. If higher ratios had been observed, snowfall totals across Connecticut would have been higher. In the end, ratios were fairly close to 10:1. It was quite cold during the storm with temperatures falling into the lower 10s and single digits by the morning of January 3rd. Although there is a loose correlation between surface temperatures and snow ratios (colder yielding higher ratios), it was the snow growth above the surface that did not promote higher ratios. Surface temperatures alone have no impact on snow ratios, unless the temperatures are near or above freezing, then they can actually lower the ratios. If any amounts you reported conflict with these amounts, please comment back with your total(s). Here is an alternate black and white version of the map: