weatherwiz
-
Posts
81,150 -
Joined
-
Last visited
Content Type
Profiles
Blogs
Forums
American Weather
Media Demo
Store
Gallery
Everything posted by weatherwiz
-

Tracking February 6. Light to moderate event potential
weatherwiz replied to Typhoon Tip's topic in New England
I just got through looking at some soundings...maybe the freezing rain isn't much of a concern as the main ptype outside of snow may be sleet...though I do wonder if just inland of coastal areas would stand a chance...this is where there is a better chance of warming the llvls enough while the sfc stays below freezing. -
Tracking February 6. Light to moderate event potential
weatherwiz replied to Typhoon Tip's topic in New England
Forecast soundings are pretty wild. Good support for a pretty solid burst of snow for just above everyone (even coast) and probably even enough for something like 3-4" then its an interesting transition of precip type...some areas (especially inland) may flirt with sleet/snow depending on lift/rates. Some soundings looks pretty unstable too. -
Tracking February 6. Light to moderate event potential
weatherwiz replied to Typhoon Tip's topic in New England
Probably going to be a very narrow area but there may be some spots looking at a decent ZR event. This is going to end up on the colder side in terms of sfc -
Fixed
-
I am now hoping for 60" of snow between now and mid March...raising from 50". In fact, I'll count last night so technically I only need another 57.5".
-
Excellent post! Maybe the data will prove me wrong here but I am not the snow climo encyclopedia like Will is, but I would think that more often that not, our winters which are either average in terms of snowfall or maybe a standard deviation higher are composed of numerous small-to-medium sized events. If you want to talk about the upper echelon of winters (your top 3) that's when you need to get multiple large events along with numerous medium sized. But your point about the deltas...this can't be overstated and quite frankly, isn't discussed enough. Too often things are looked at in a static state...the NAO is this, the PNA is that, here is what the D7-10 500mb mean shows...the static state doesn't matter, it's the delta...it's what is going on between time point A, time point B, time point C, ..., etc. that ultimately matters. It's understanding how these deltas are all contributing to the shape and make of the pattern and then incorporating smaller-scale and even mesoscale features which influence the evolution on the shorter time scale.
-
Yup...we don't see stretches like what is being modeled too often. This is what makes winter to me...I would rather have several small-to-medium sized small events versus one large one. I know that is one of the bigger debates here but we endure a long cold season across these parts...may as well spread the wealth around. Several medium sized events can rack up the seasonal totals quickly.
-
Let's just fire the cannons right through February. I love active February's...by this time I am definitely ready for Spring/warmer weather so when you get an active February you 1) Are getting nailed with snow which is fantastic 2) It makes the time go by faster This pattern is like the equivalent of the ring of fire pattern during the summer...as Tampa Bay Bucs fans say, "FIRE THE CANNONS"
-
Sunday Evening/Night Light snow event Disco/Obs
weatherwiz replied to Sey-Mour Snow's topic in New England
About 2.5” here or so. We all white again -
We’ve made it to February. Only two full months to go 89 days
-
Let’s fire the canons and get bombarded with snow threats until about mid March then tip toe to 70’s. Hoping for about 50” in this span
-
I may invite the Bruins over for extra practice.
-
Backyard turning into a pond...lots of standing water.
-
POURING here
-
New England Winter 2024-25 Bantering, Whining, and Sobbing Thread
weatherwiz replied to klw's topic in New England
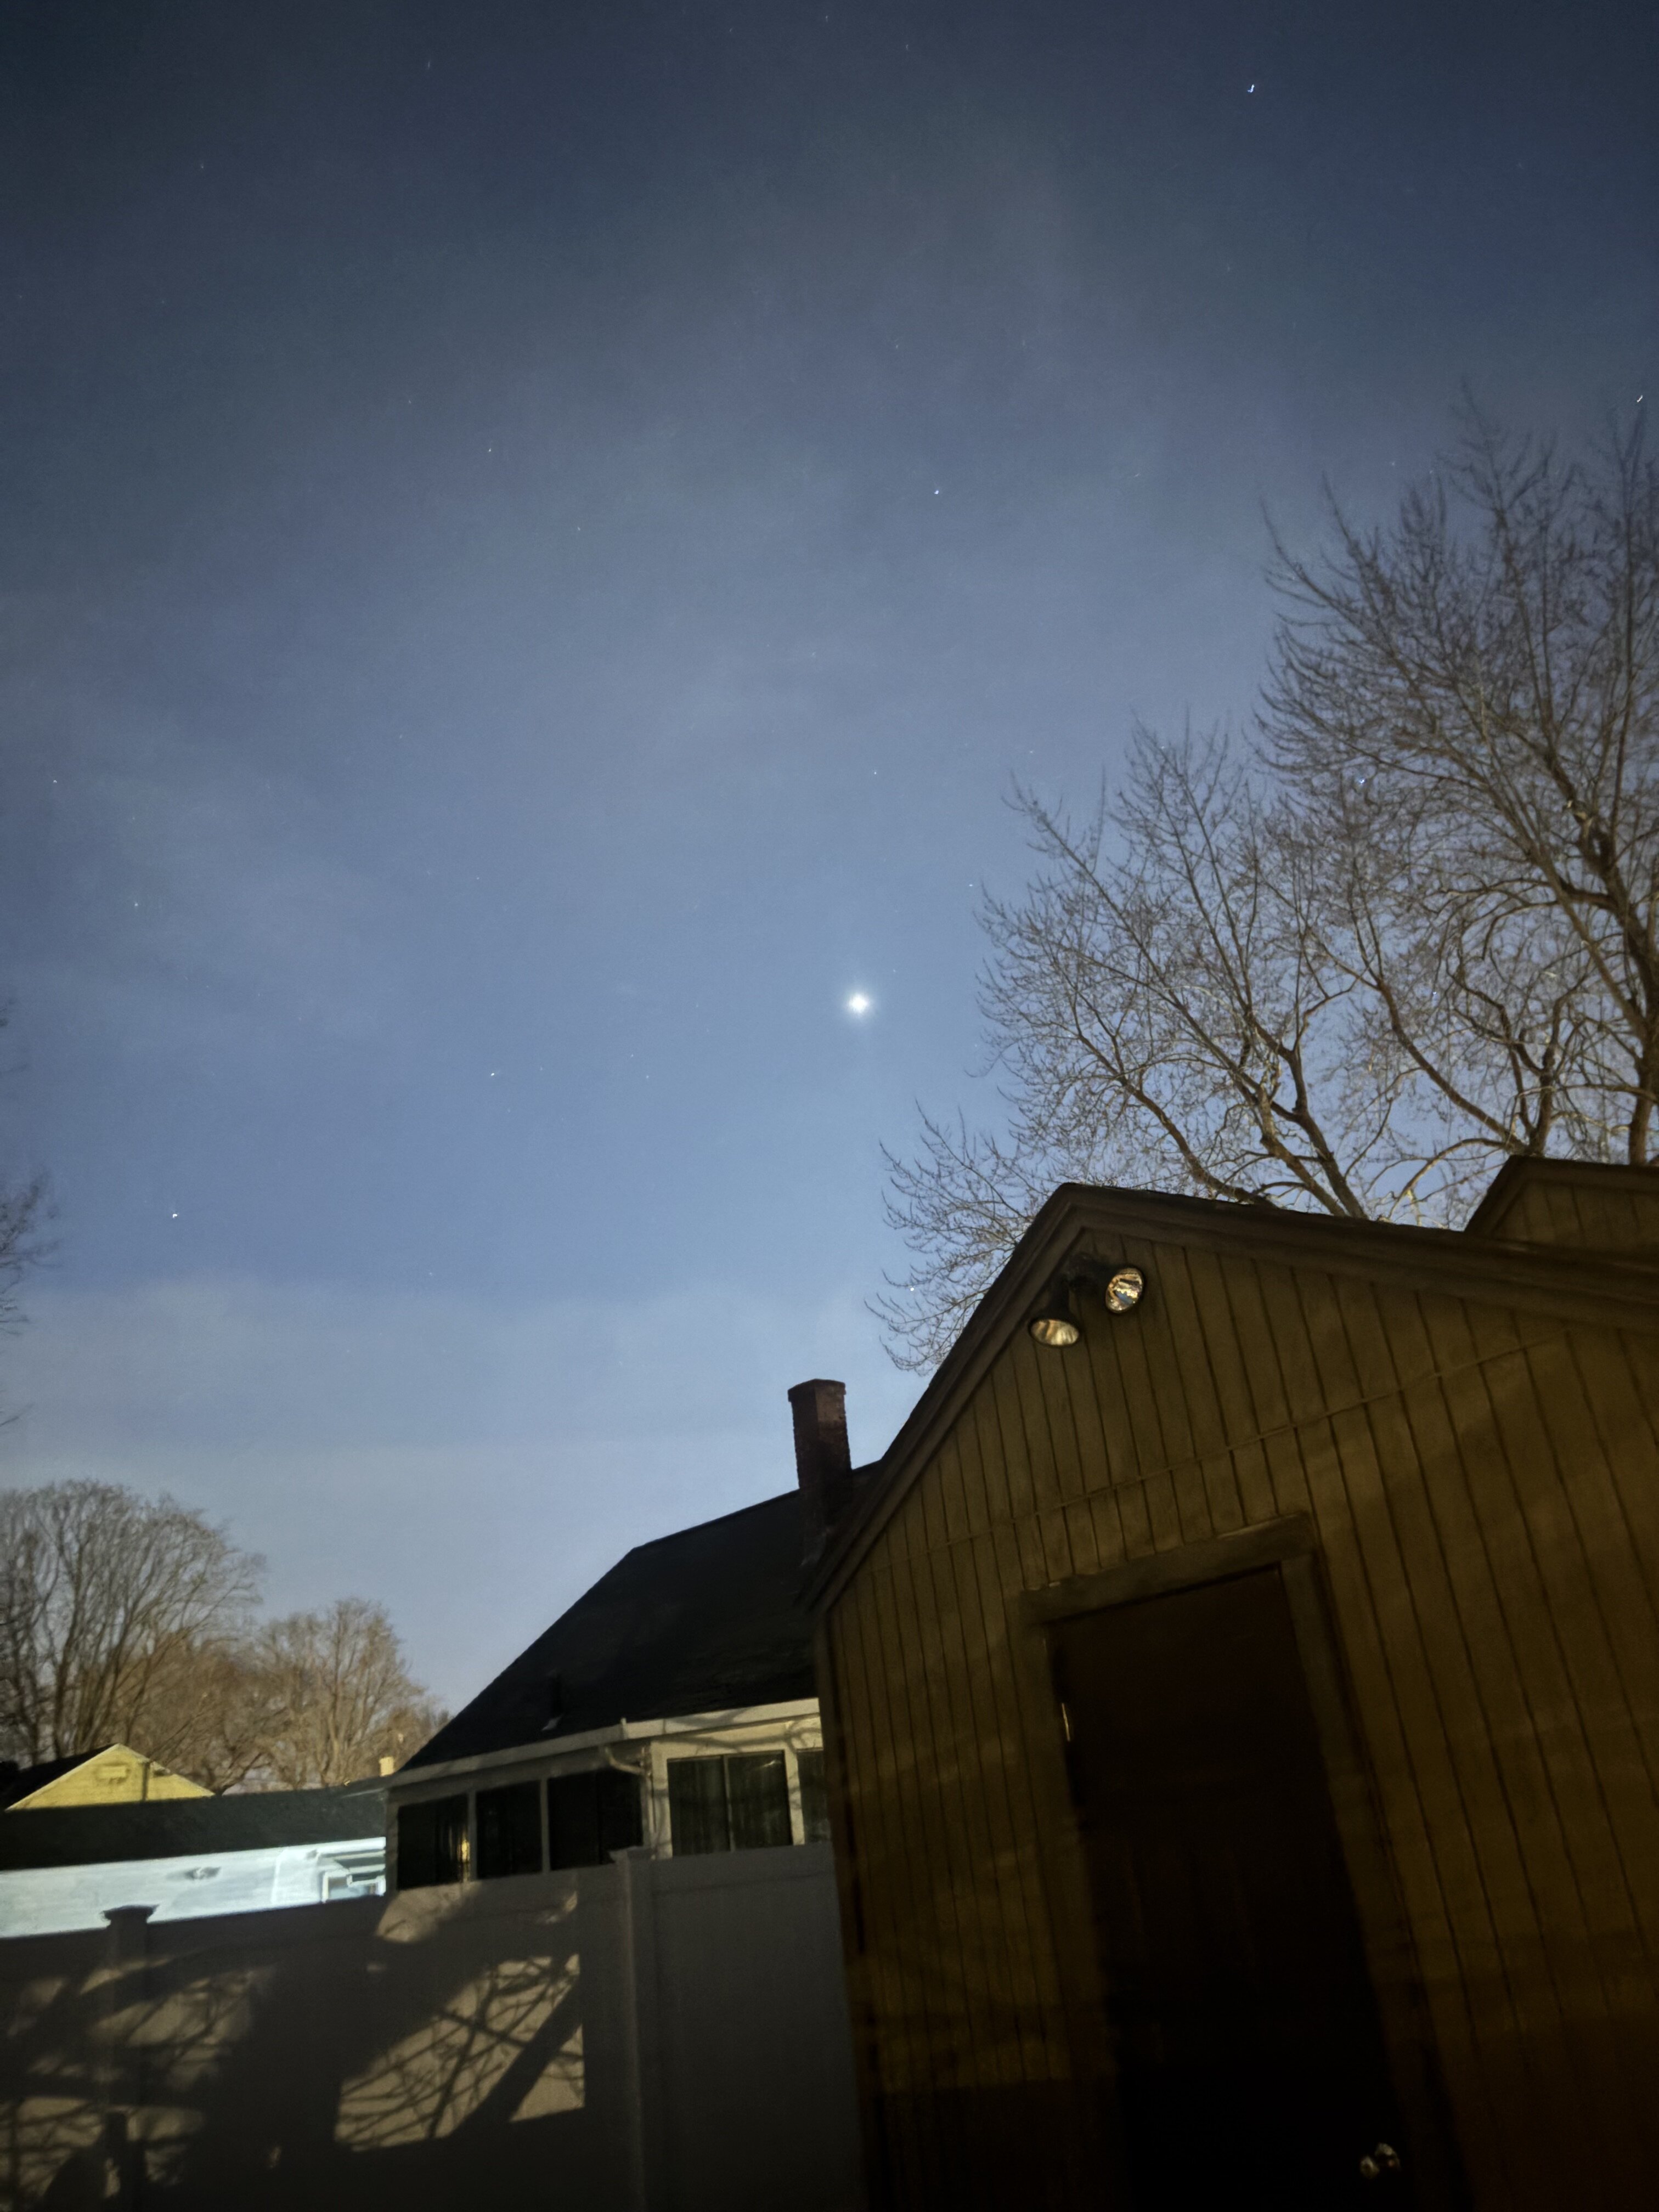
assuming this is Venus but it seems awfully bright tonight
-
I remember...maybe it was 2016 or 2017 or 2018...one of those years, they had like extremely anomalous +500 height anomalies across the central U.S. but they had a stout Arctic high and were breaking cold records left and right.
-
Yeah the upcoming pattern is one that isn't definitively cold or warm and more rollercoaster like. I kind of like the period of 10th-20th but we're going to be setting up a hell of a battle ground in terms of north-south temperature gradient across the country and we look to be right along that zone.
-
That's the thing with cold...it sucks. It doesn't have to be 5F to suck. 20's with a breeze sucks, 30's with a breeze sucks. Not only that but it gets old after a while.
-
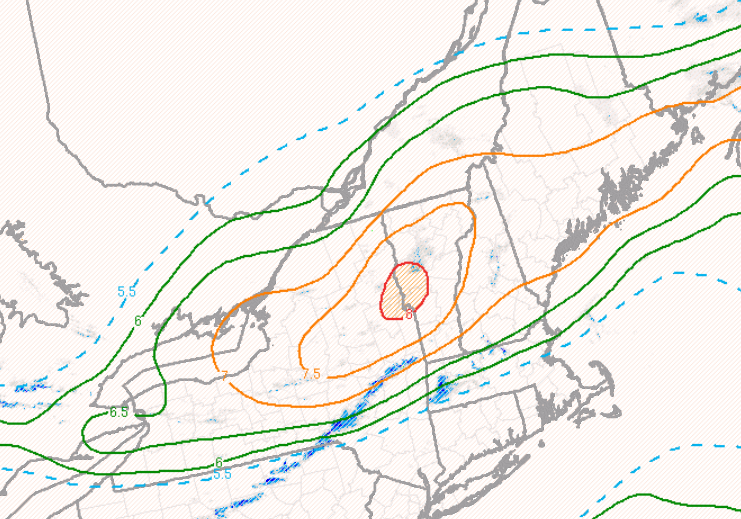
May be the best snow growth/flake size I've seen all winter
-
I am, yeah that wind is roaring and it kicked up quick. Bet those gusts were pushing 45-50. It's probably not the best metric for here but curious to see what CEF reports. A mixture of precipitation but it is quickly becoming all snow.
-
Its like a summer time severe squall line gust front!!!!
-
Lightning up around North Adams
-
Went outside to bring in the garbage can before the snow derecho gets here, though I will say a part of me would have loved watching it blow down the street. Anyways, I went outside in just a light jacket...was beautiful to be able to do that.
-
I hope we get mlvl lapse rates like this in May-June-July
-
What the hell, January 28-29 2025 FLURRIES
weatherwiz replied to Baroclinic Zone's topic in New England
Lightning west of BGM!!!