

wncsnow
-
Posts
8,859 -
Joined
-
Last visited
Content Type
Profiles
Blogs
Forums
American Weather
Media Demo
Store
Gallery
Everything posted by wncsnow
-
2.52 and climbing
-
Over 2 inches now!
-
Heaviest rain we've had since last year at least. Right at an inch since it started Wednesday night.
-
Up to .65 with the latest shower. Radar looks promising
-
.35 now total since Wednesday. I was really hoping for 3 to 4 inches from this stretch.
-
I'm almost to .25 since Wednesday. Lots of drizzle now.
-
.12 overnight...
-
In shock about Kyle Busch. He was so young and I hate it so bad for his family.
-
Still only .11 here. Hope tomorrow is much more fruitful
-
Looks like most of McDowell just got a little light rain and the old west/east split.
-
Nasty storm in west Asheville. Worst lightning I have seen here since I have worked here.
-
We got on the board with .11 last night.
-
It will never be the same.
-
Can't wait to watch the cumulus build over the Blue Ridge the next few weeks
-
That's my concern. Some models are pushing those heavier totals west with this strong Bermuda High. TN Valley looks inundated for sure but how much makes it east of the Apps?
-
Best look the EPS has had in ages. Hope its locked in and doesnt waffle
-
36 with light frost on elevated surfaces
-
More water restrictions in McDowell. Next week not looking as stormy.. not good
-
Late next week is trending drier again east of the Apps. Less than an inch of rain for many through 15 days.
.thumb.png.ee718fb1e25a0ef9f6ec0918b4993a30.png)
-
I think we still need the NAM. Time to start a petition
-
Sprinkles earlier but rain missed us again, this time to the north
-
Its getting comical at this point
.thumb.png.73d6ff8fdb311f08917ef5fc983470fc.png)
-
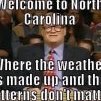
Did the pattern ever change?
.thumb.png.a5189c9b0130fb5b4552994f01e4d191.png)
-
There's brown grass here but it's due to drought and people mowing too often
-
I expect only minor changes to the drought map after this event. We still need a lot of rain for meaningful changes.


.png.41215b1b7a6f649ef93e1e89aaa25c0f.png)

.png.f2038a1e09d8b4e7474140bea524ccb7.png)

.png.7d42e6f24ddd636ee831244604dfe29f.png)