-
Posts
11,286 -
Joined
-
Last visited
Content Type
Profiles
Blogs
Forums
American Weather
Media Demo
Store
Gallery
Everything posted by ChescoWx
-
E PA/NJ/DE Summer 2026 Obs/Discussion
ChescoWx replied to PhiEaglesfan712's topic in Philadelphia Region
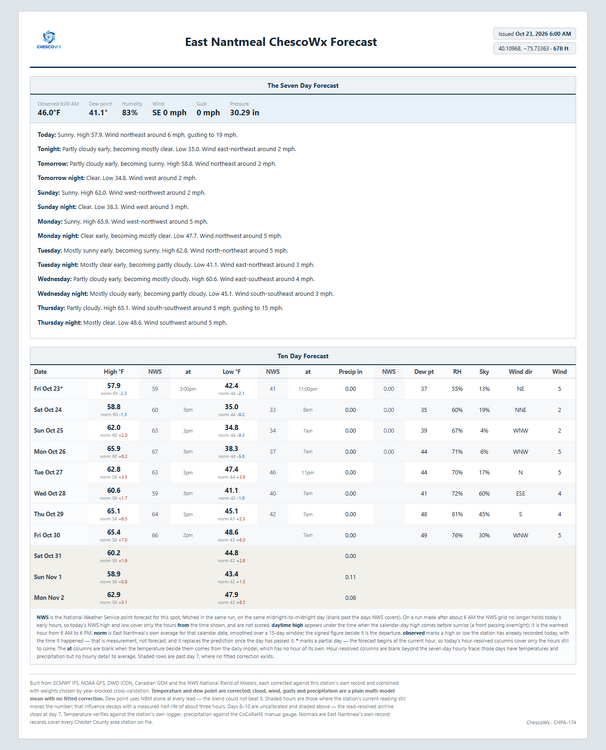
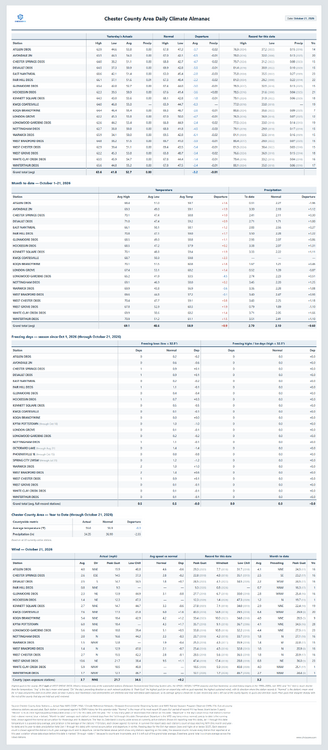
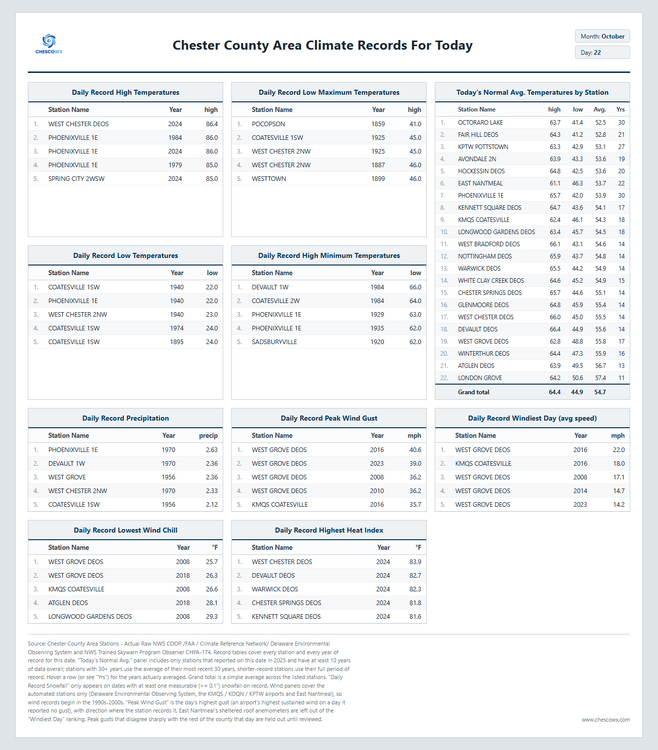
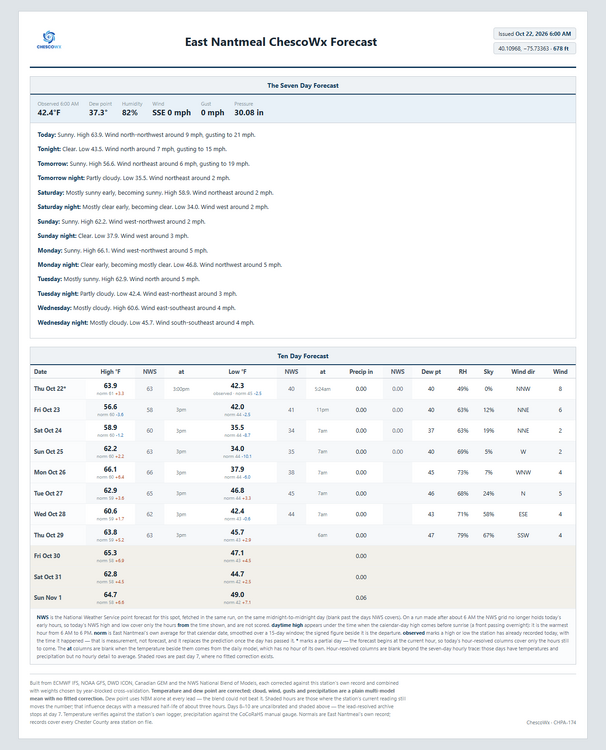
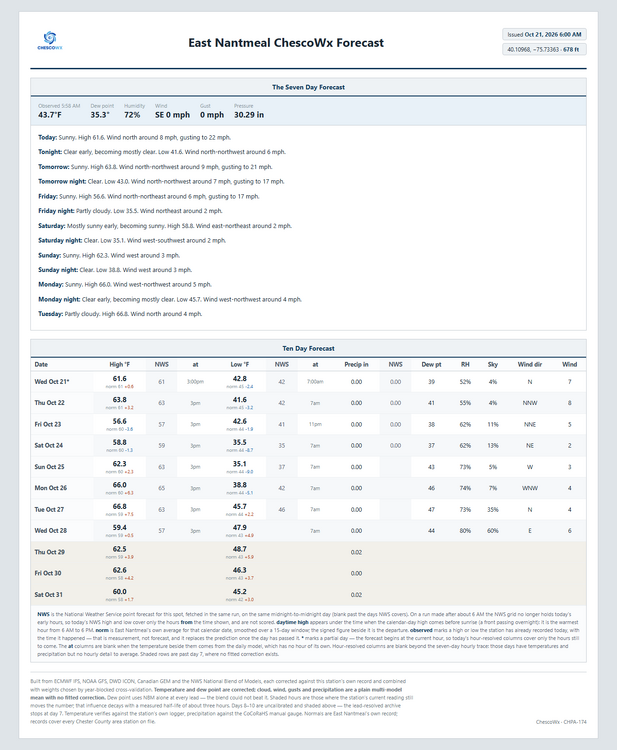
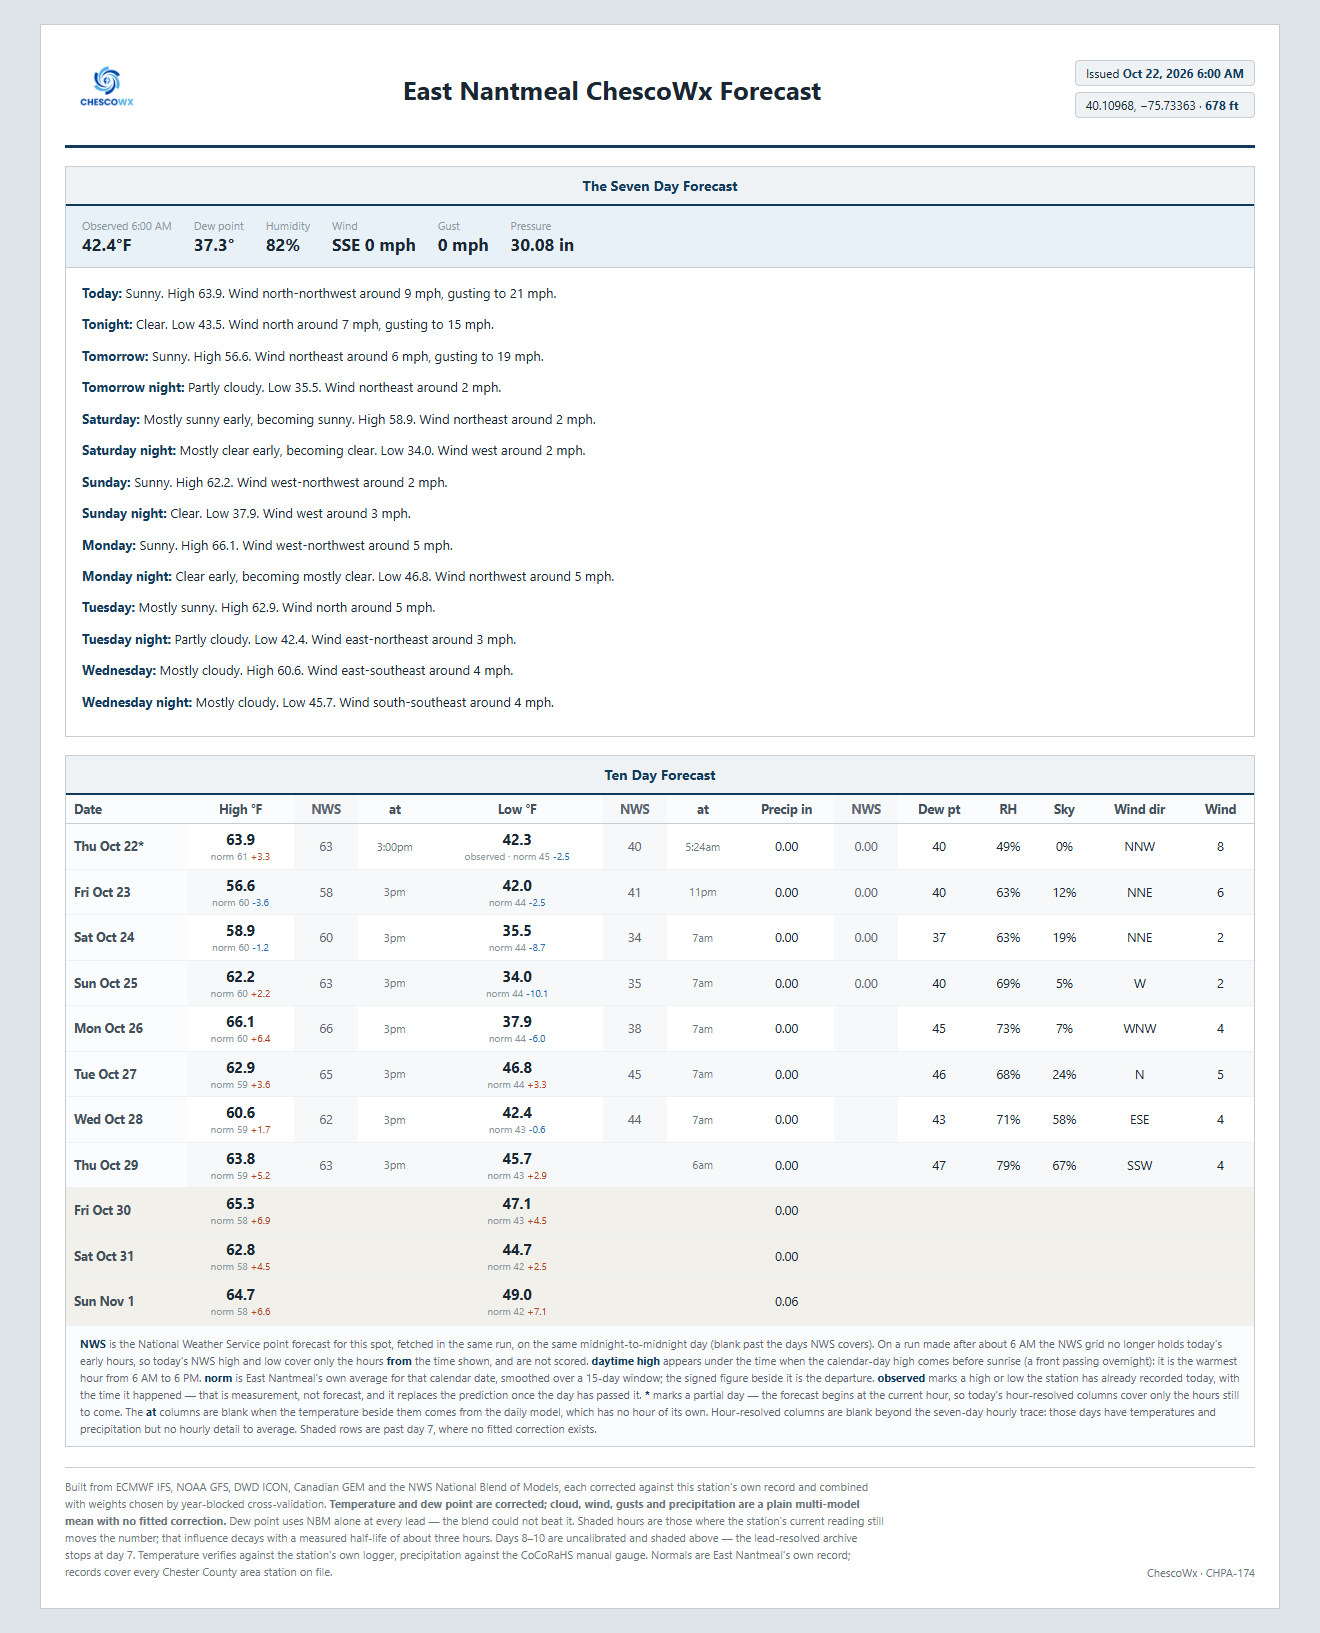
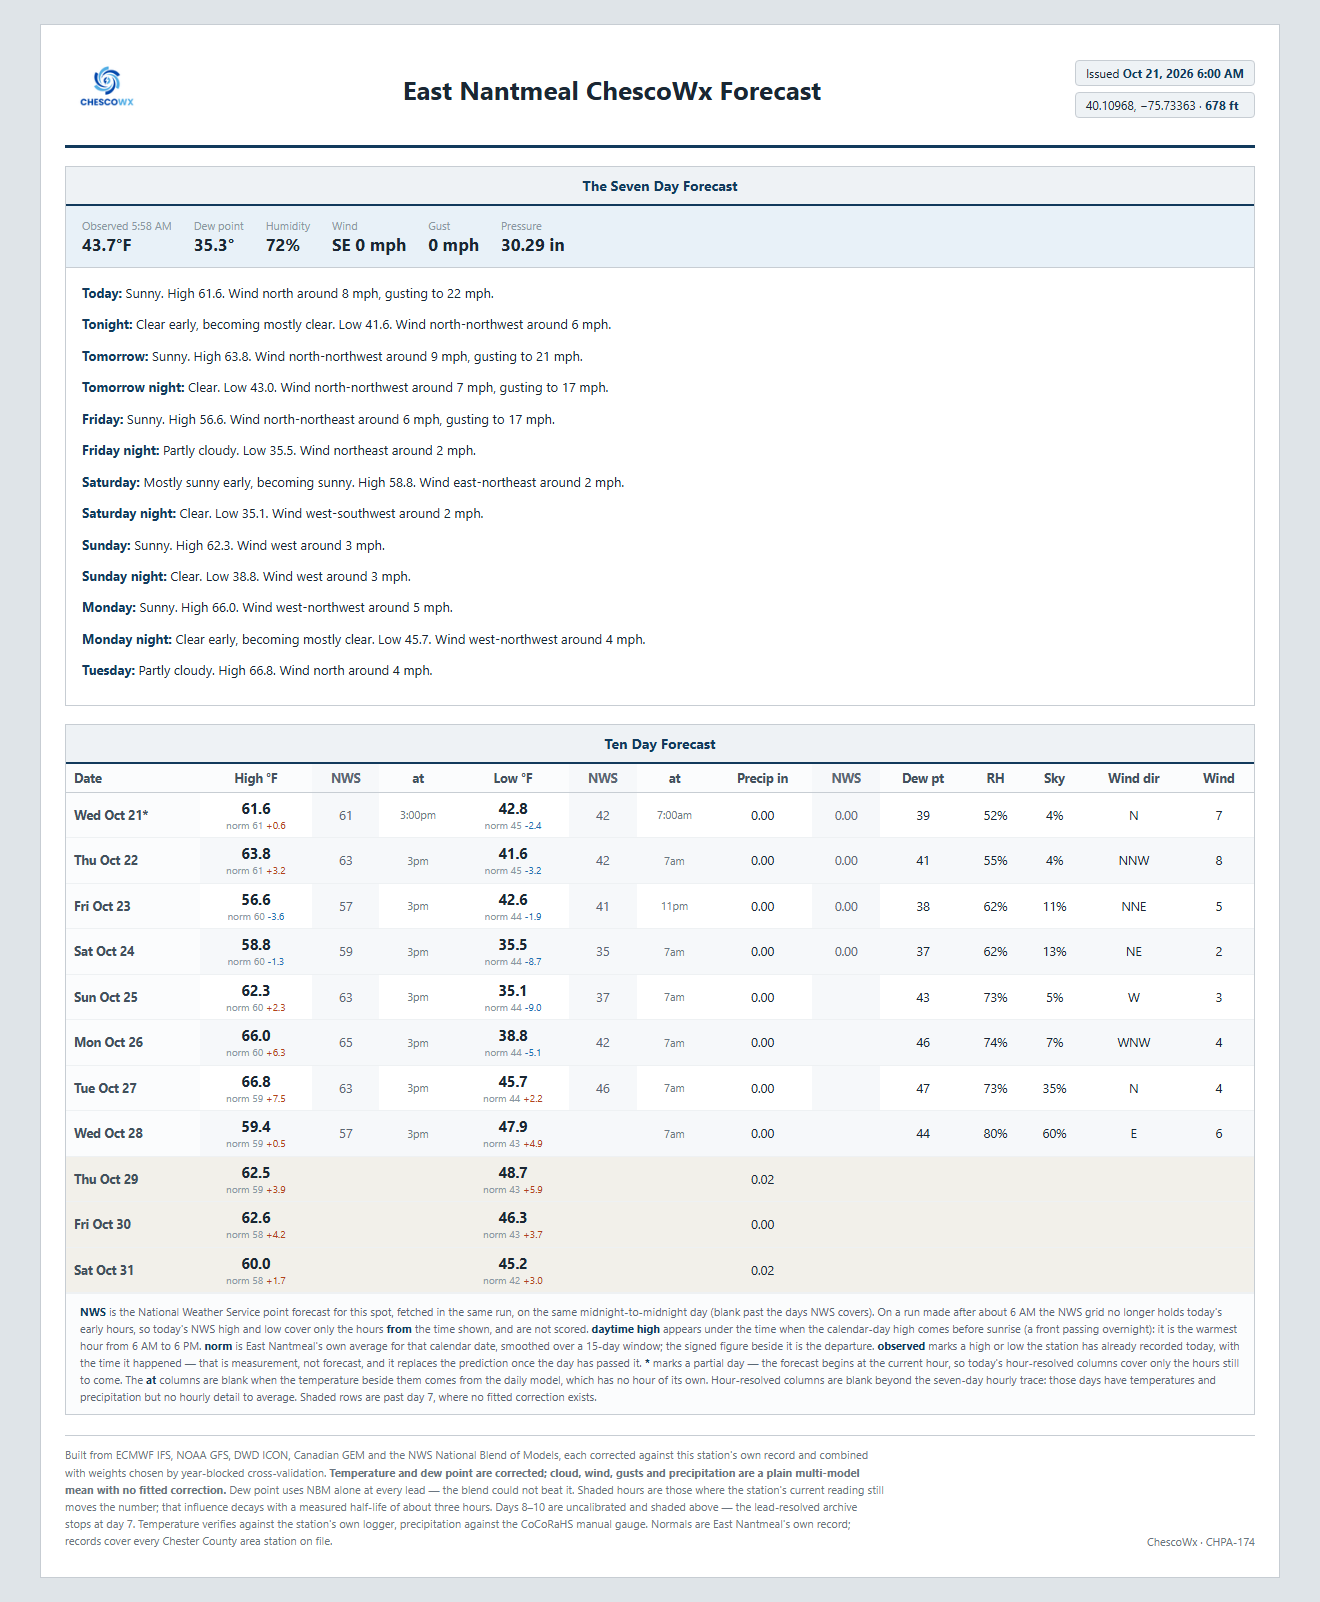
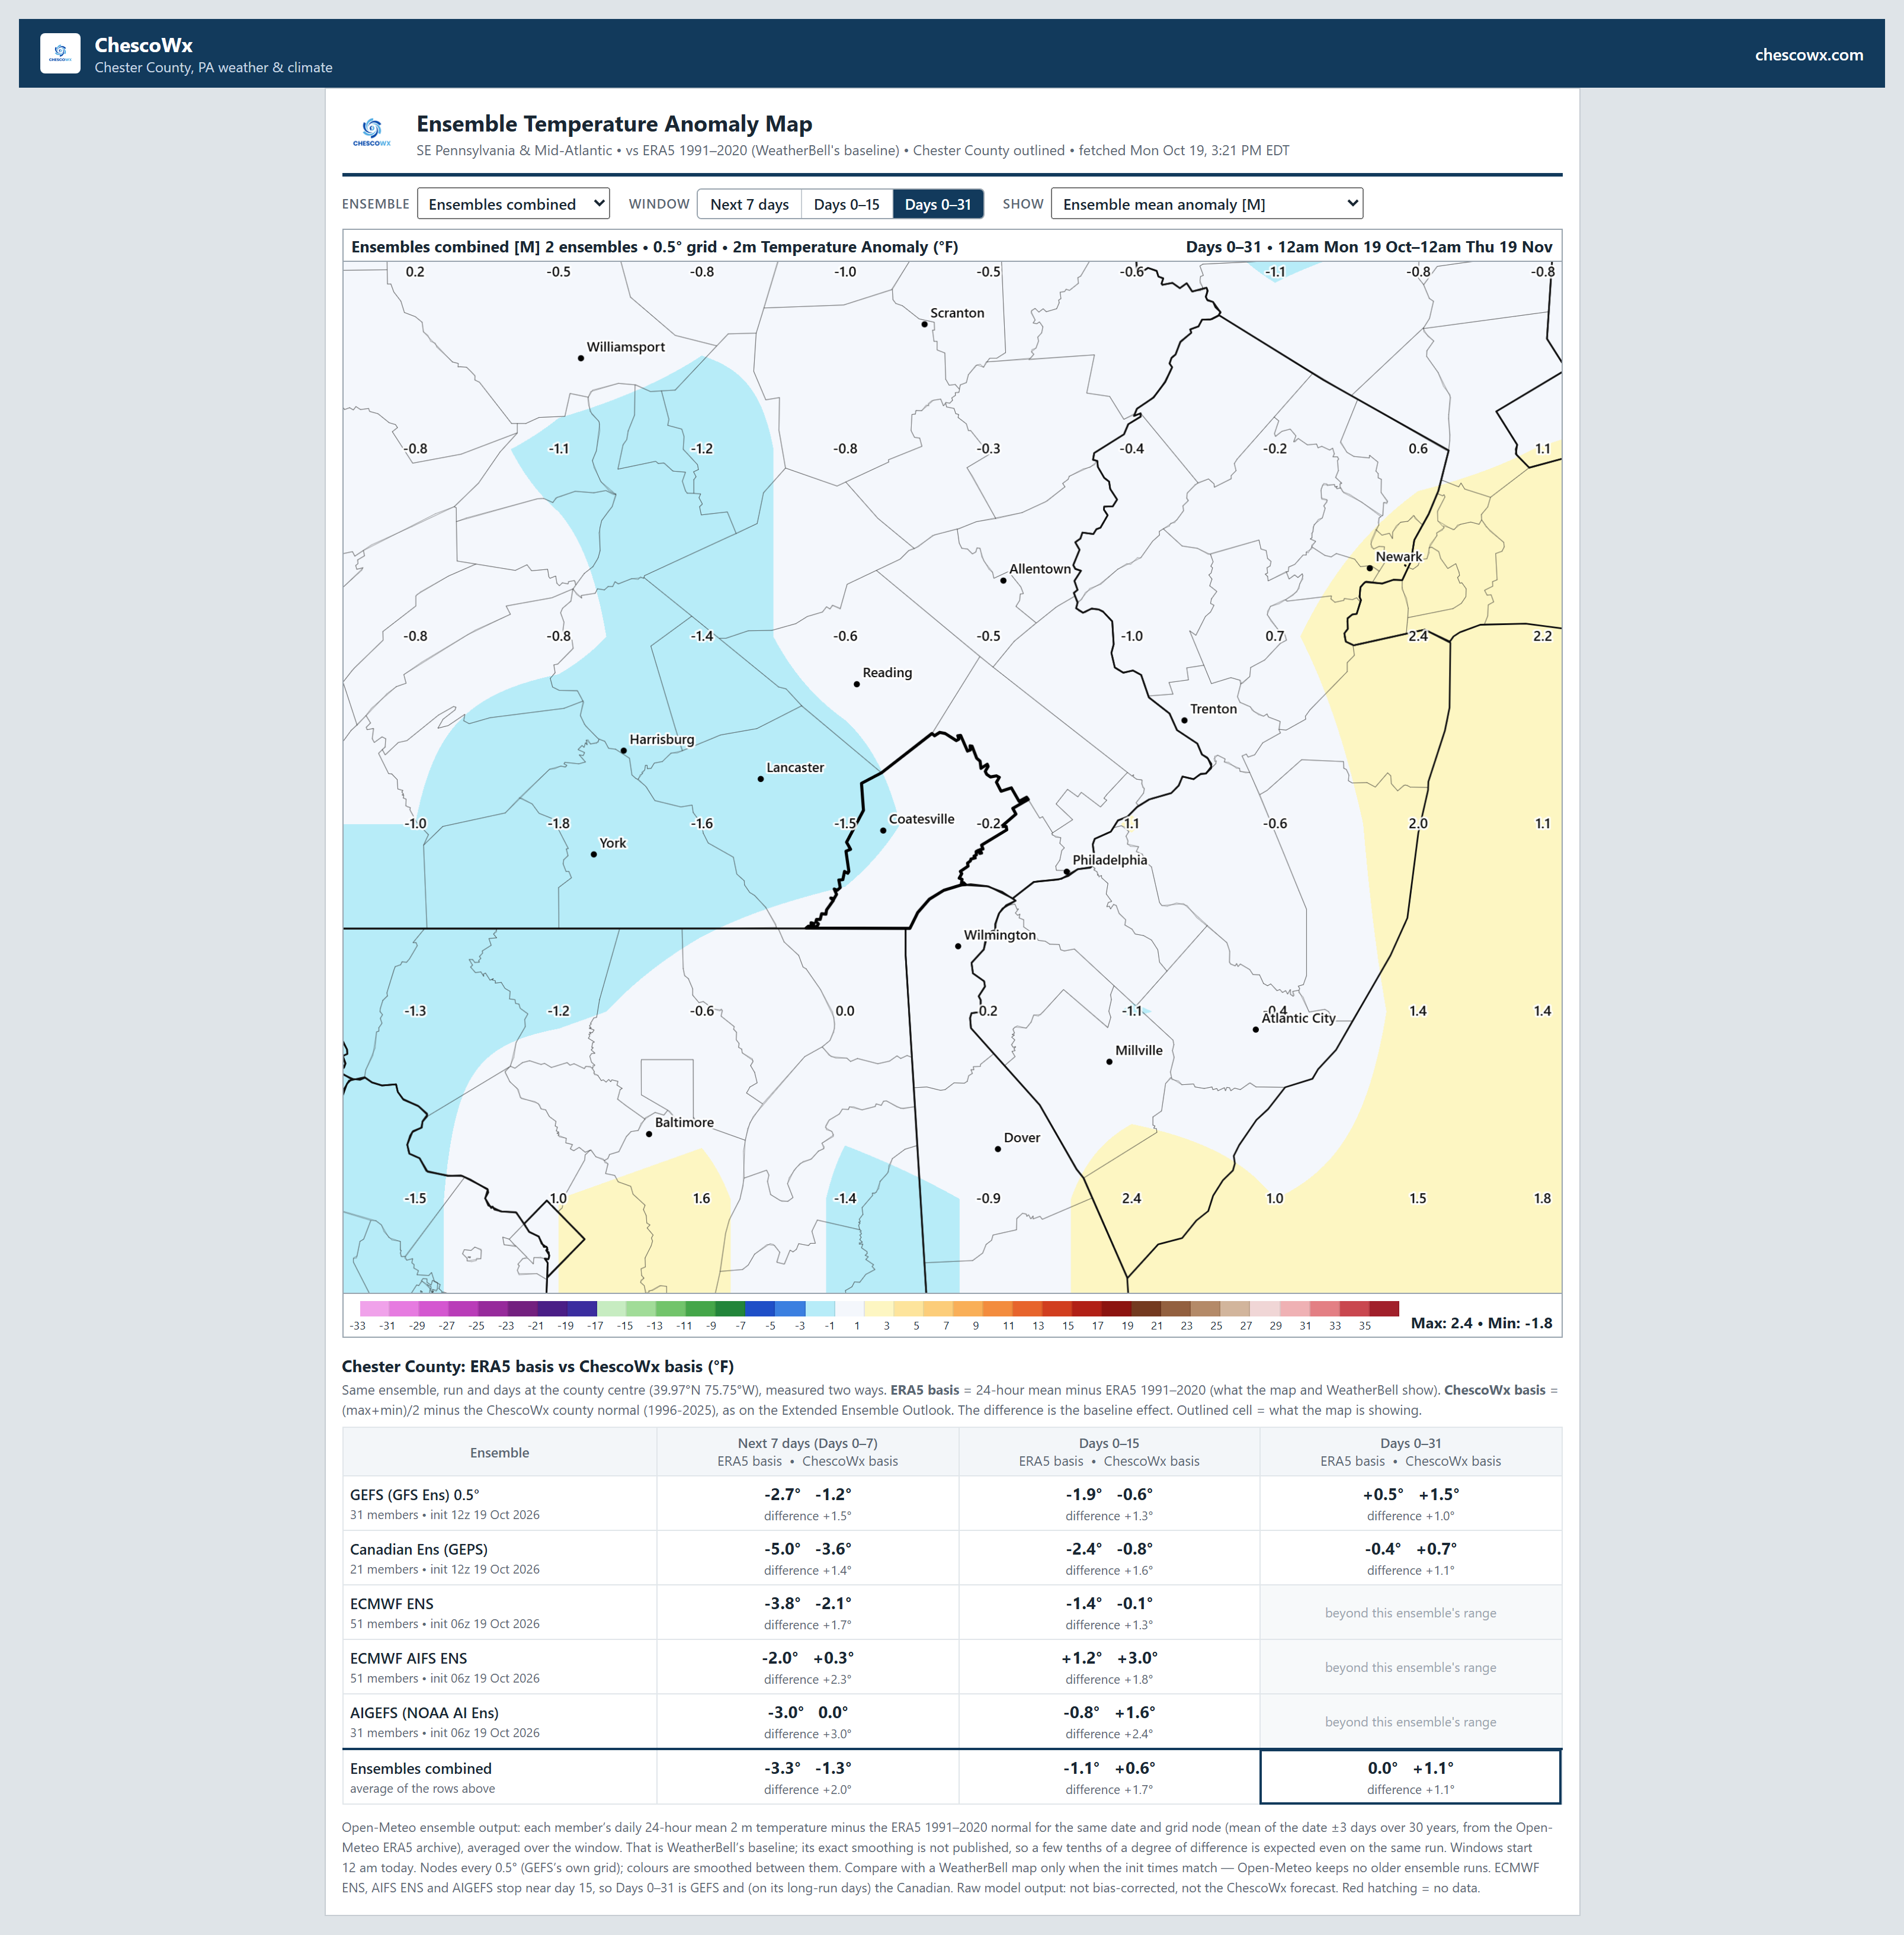
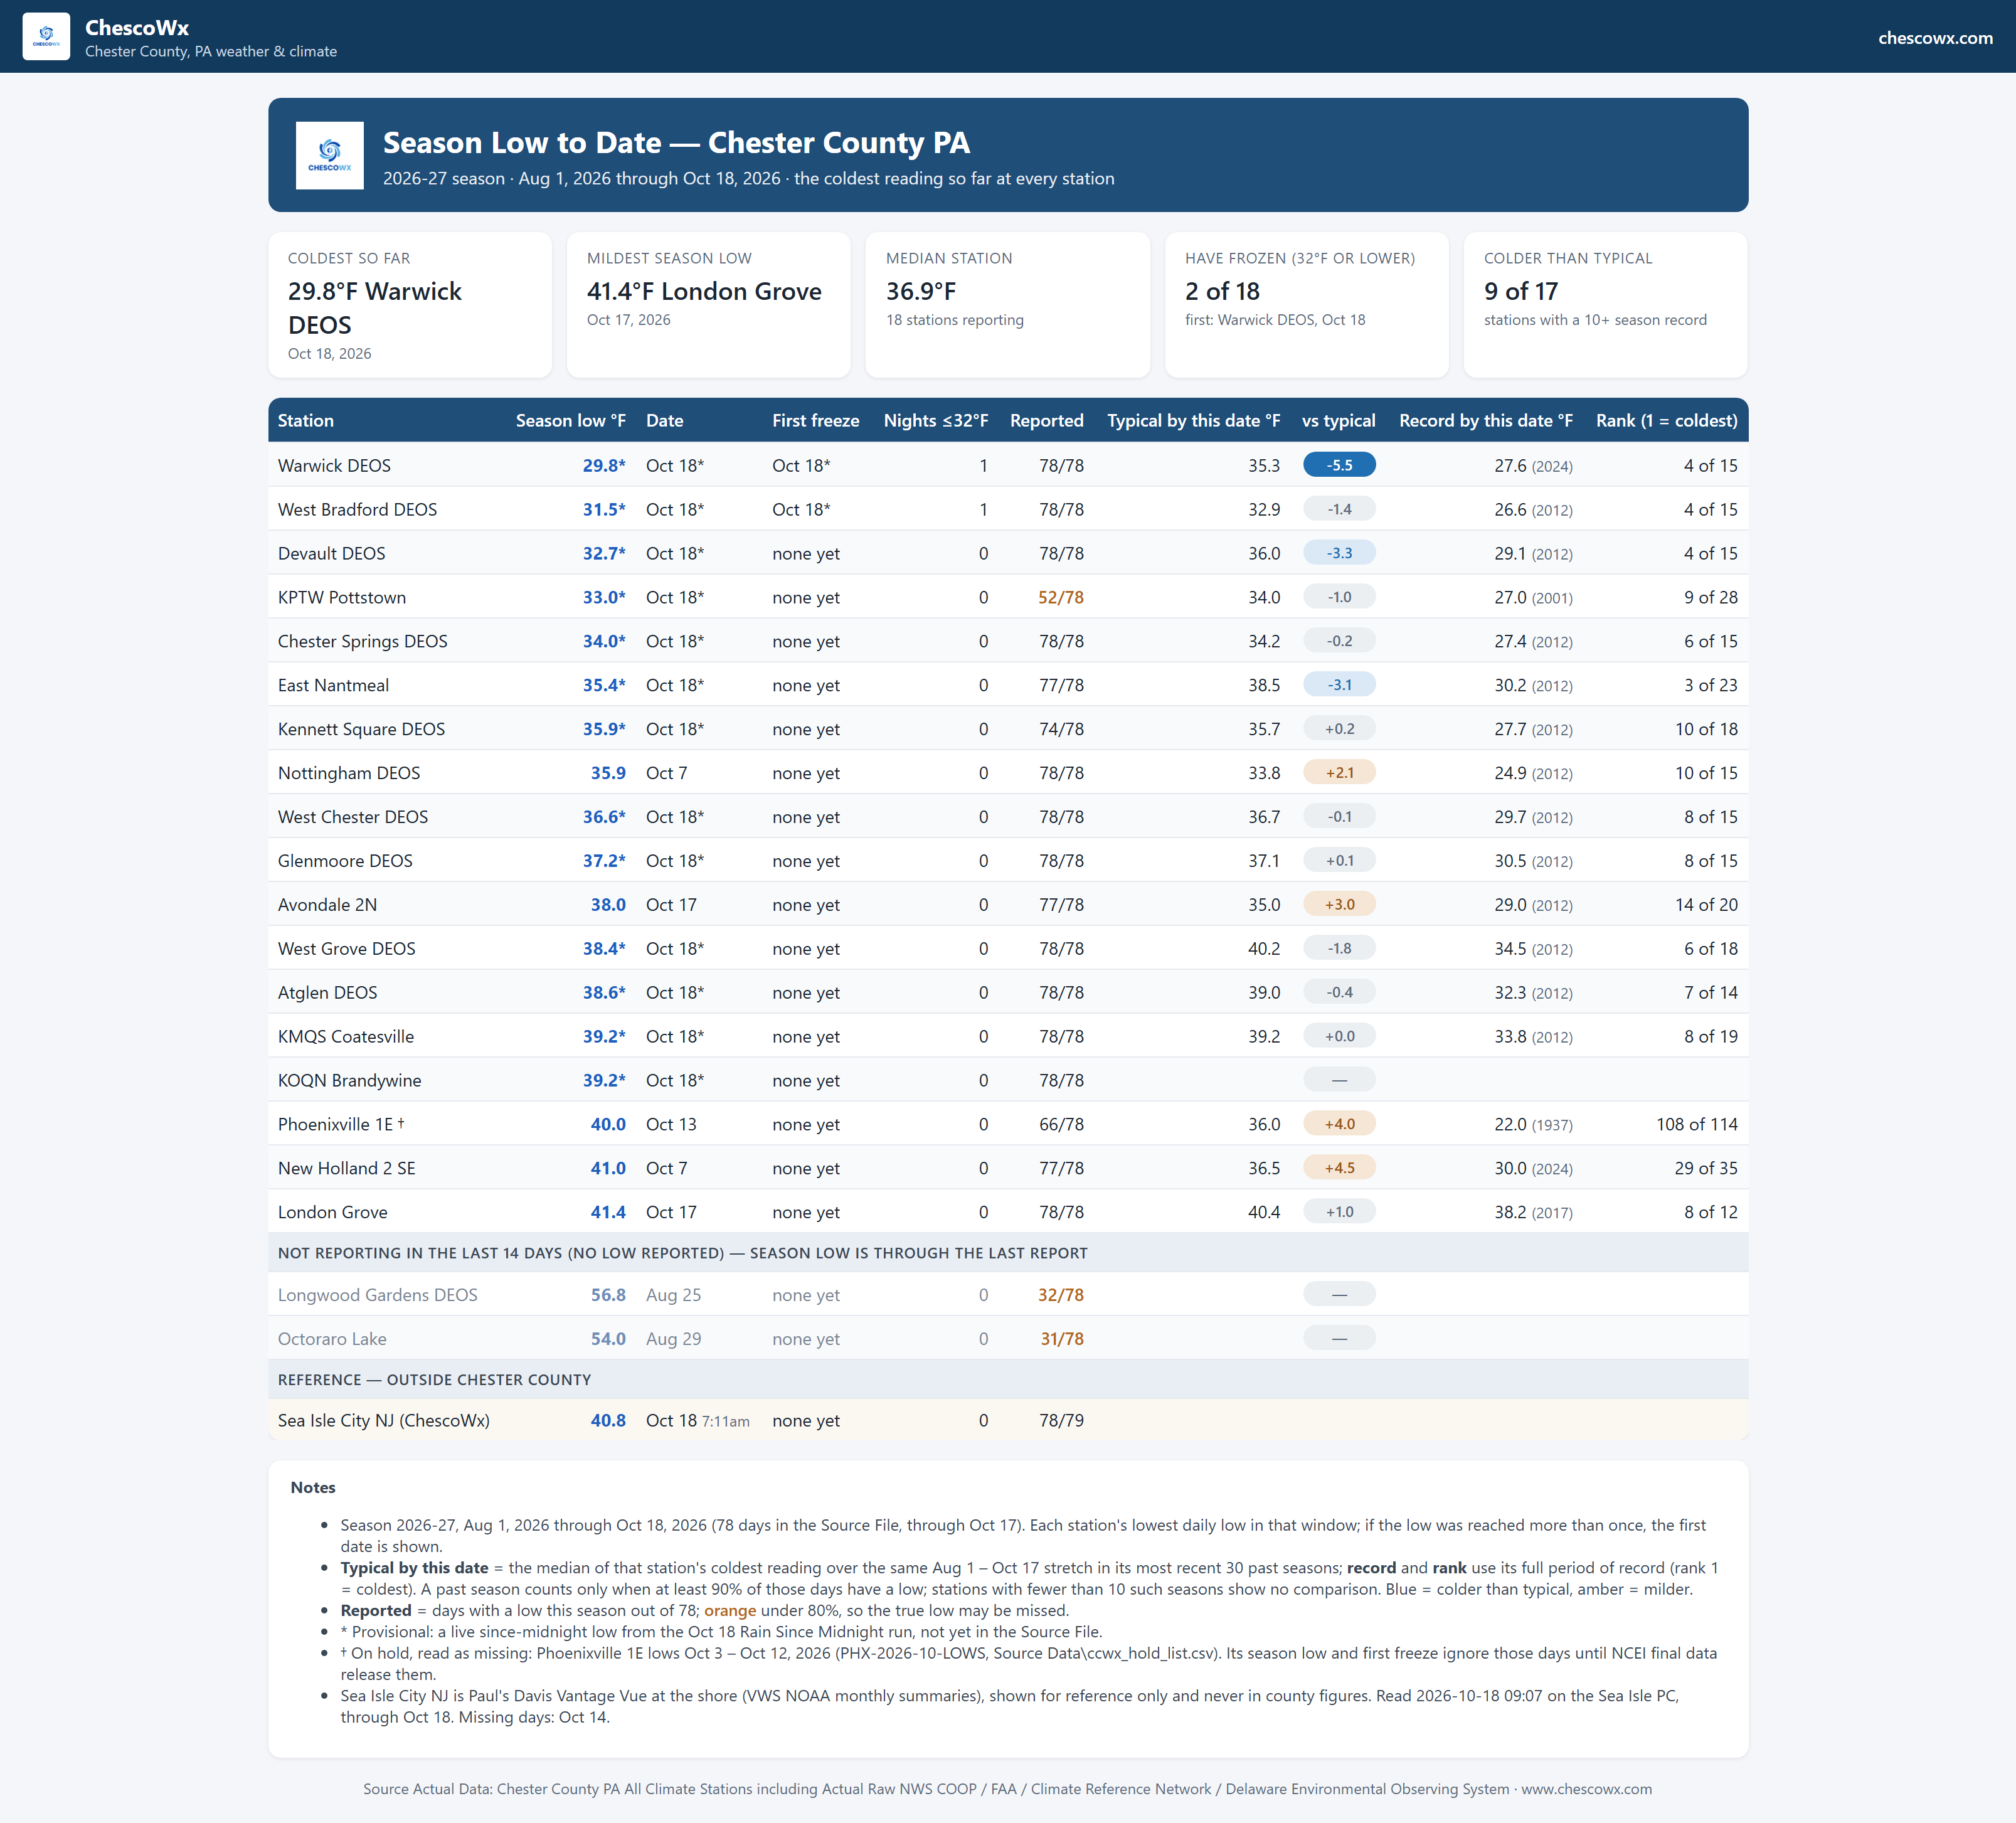
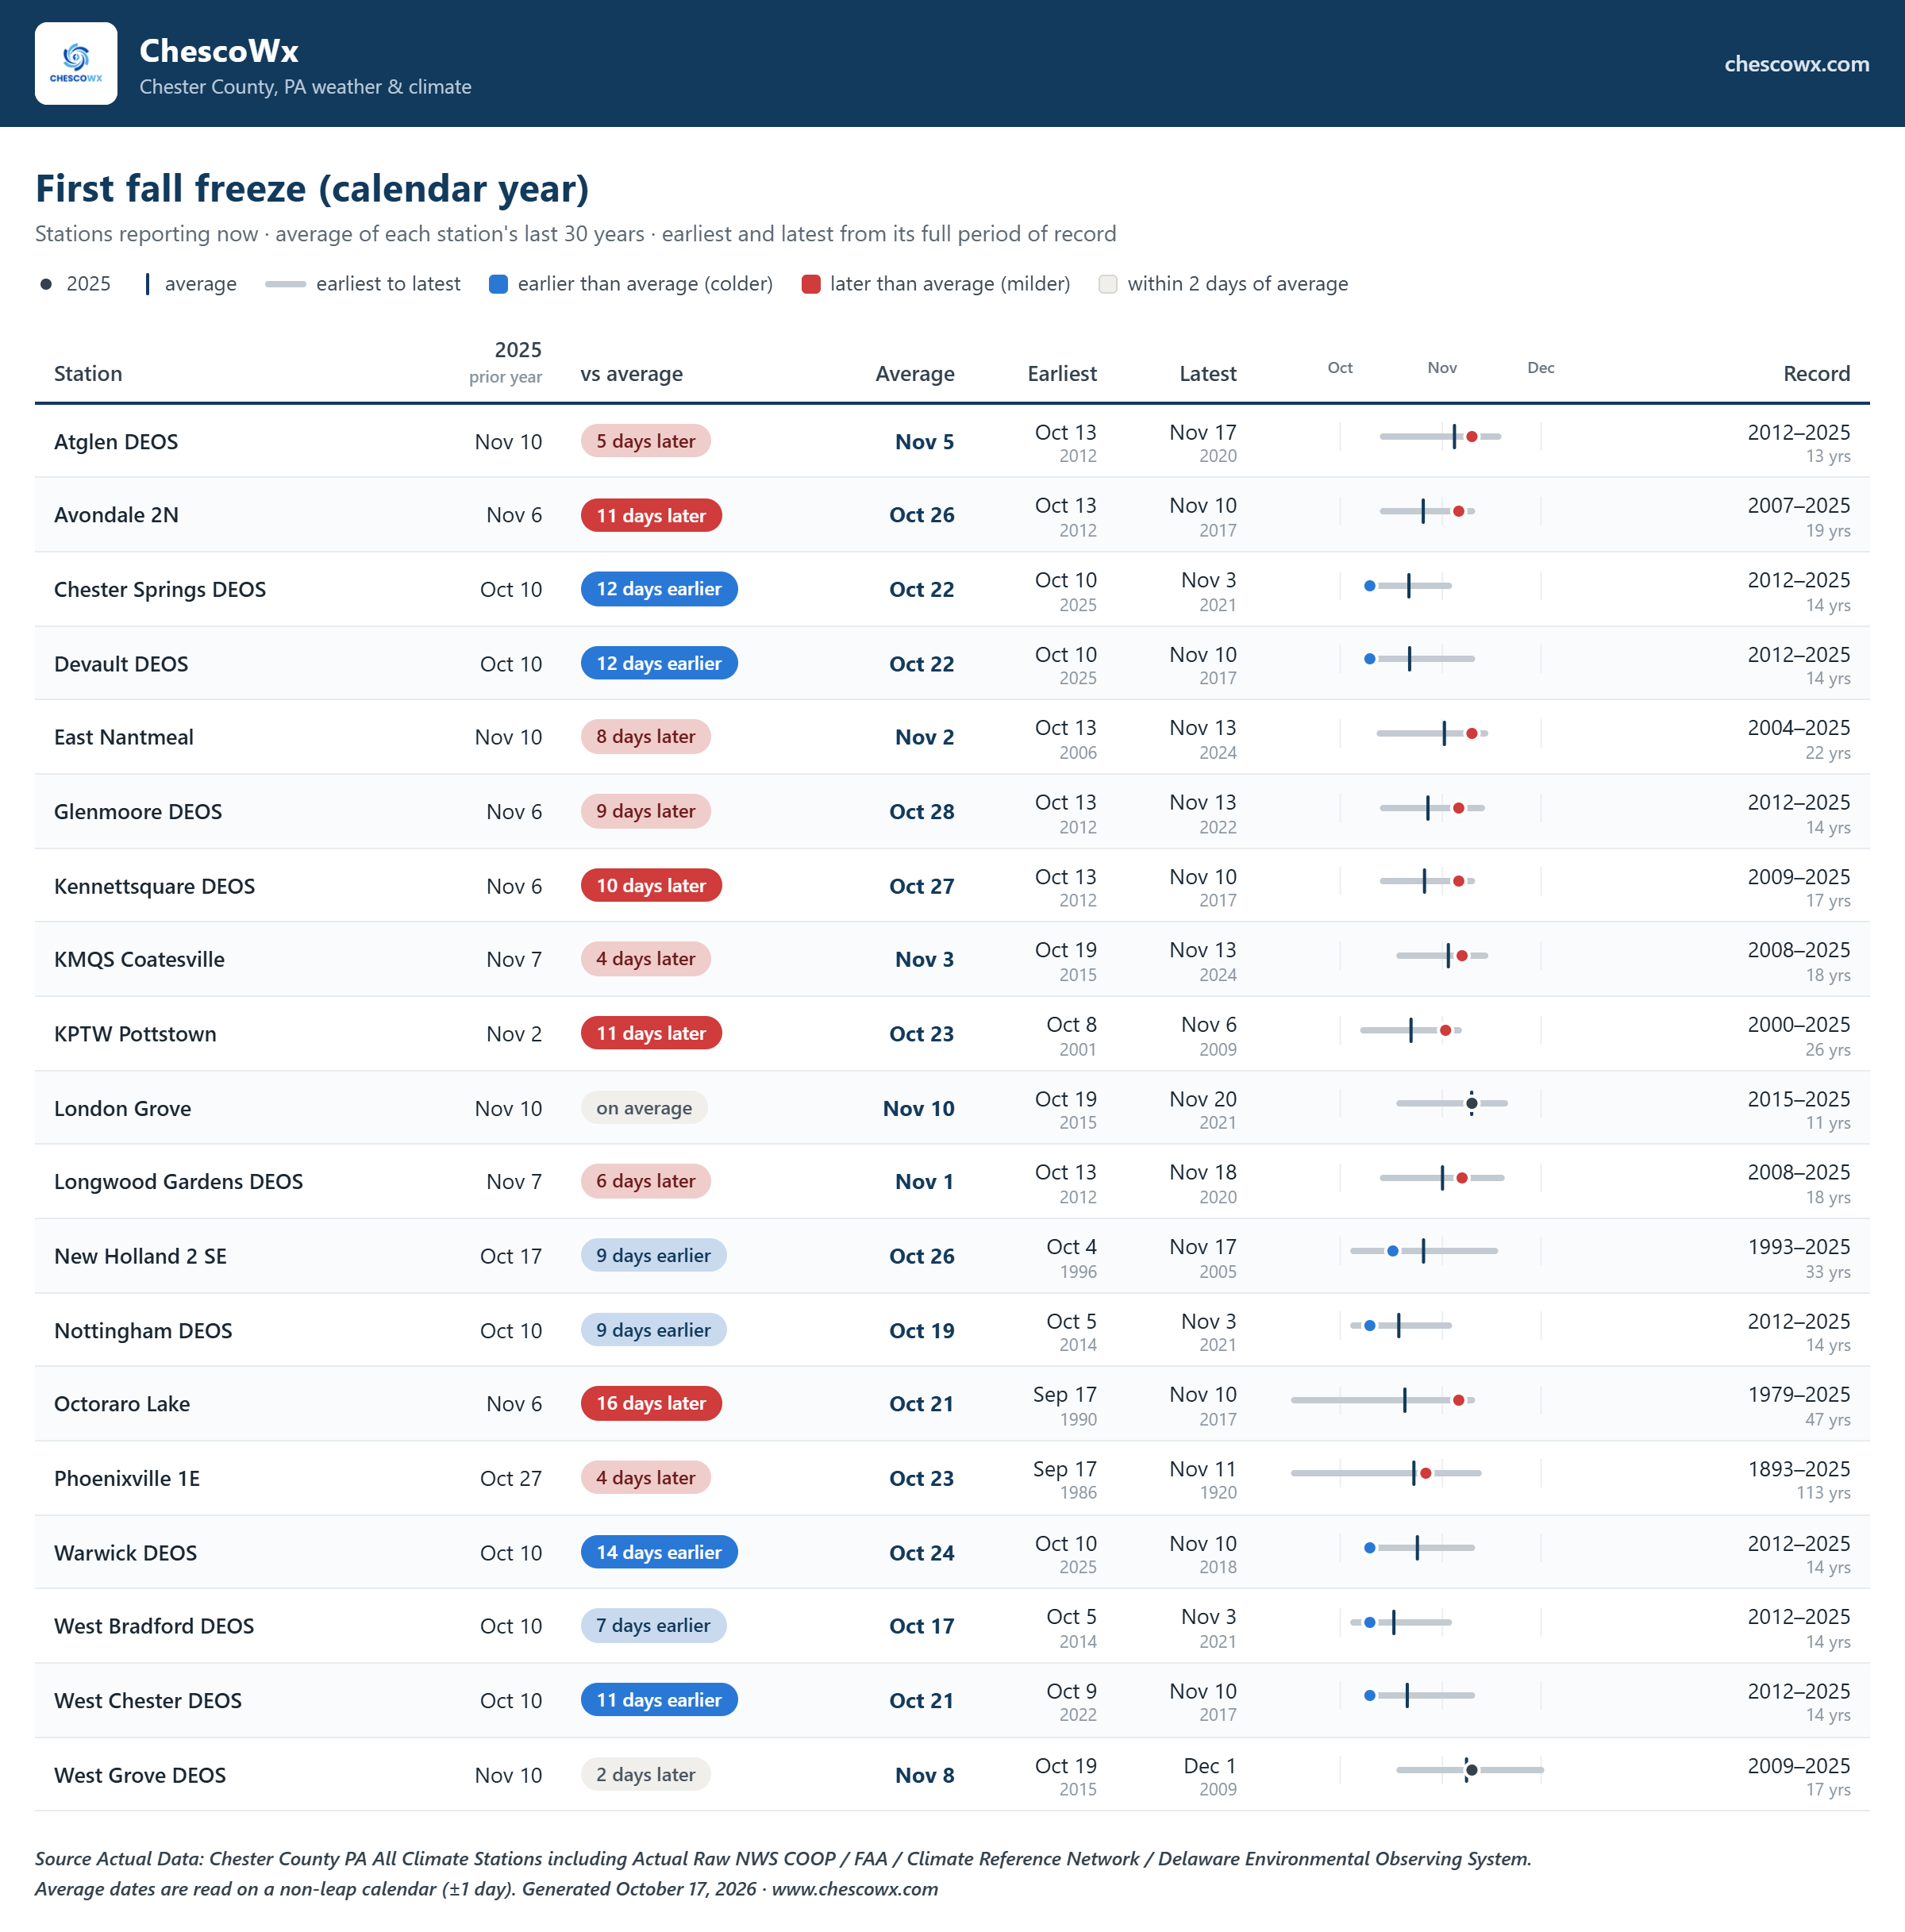
Today will be our last day with higher humidity. We should cooler weather both tomorrow and especially on Saturday. However, we turn more humid and wetter again by later Sunday into Monday. Drier and near normal temperatures arrive by next Tuesday. -
No hand waving Mike....just no clear documented reasons as only four of 51 (8%) trace to a documented real physical cause — three moves and only one TOB change. There are 2 zero break stations that are our controls - Coatesville 2W and Hopewell demonstrate that the PHA is indeed selective as it left these 2 stations untouched: NCEI applied no adjustment to either - which proves the 14 breakpoints at Coatesville 1SW were a deliberate finding rather than a default. The Coatesville 1SW dates, all code 4: 1896-12, 1902-02, 1917-08, 1920-09, 1922-08, 1930-10, 1936-05, 1941-06, 1946-04, 1959-11, 1968-05, 1971-04, 1973-07, 1976-02. Fourteen inferred discontinuities against six documented HOMR relocations, coinciding with none of them. The linear ramp clearly fits far better than any step. And when you allow both, the step collapses to −0.050 °C while the slope survives essentially intact at +0.182 °C/dec. A one-time convention change explains basically none of it. And more importantly the actual magnitude is out of range. The Coatesville adjustment swings +1.51 °C from first decade to last (West Chester, from NCEI's own file, swings +2.38 °C). Published TOB corrections for a full afternoon-to-morning switch run roughly 0.2–0.5 °C in annual mean. So TOB, even granting it entirely (which is not valid), accounts for perhaps a third of the Coatesville adjustment and a fifth of West Chester's. To summarize how it all fits together Mike: Raw agreement across stations. Coatesville 1SW −0.366, West Chester 2NW −0.409, Phoenixville 1E −0.339 over 1941–75, all p ≤ 0.0012, inside each other's error bars. Both systems erase it. Berkeley and NCEI each render all three non-significant, with adjustment trends correlating at r = 0.9986. The correction is a "smooth ramp" which you question above but certainly not a step — which no single documented event can explain. Its size exceeds TOB by 3–5×. The breakpoints lack documentation. Fourteen at Coatesville, all code 4, against six documented relocations in HOMR. At West Chester, April 1921 and November/December 1927 are documented observer-and-site changes classified as empirically detected, and the March 1936 relocation produced no breakpoint at all. Phoenixville is the cleanest case — no detected convention change anywhere in its record, and it still cools at −0.339 (p=0.0012) - why is that? So many questions and still so few answers!! The unanswered questions that follows from this is narrow and should be answerable: exactly what documentation supports the fourteen breakpoints at USC00361589 - Coatesville 1SW and what portion of the adjustment at Coatesville is attributed to time-of-observation versus other causes? That last question is the one they can't deflect — because the shape of their own adjustment says it isn't mostly TOB because if TOB was factored in it would actually be supporting a warming not a cooling adjustment at Coatesville!
-
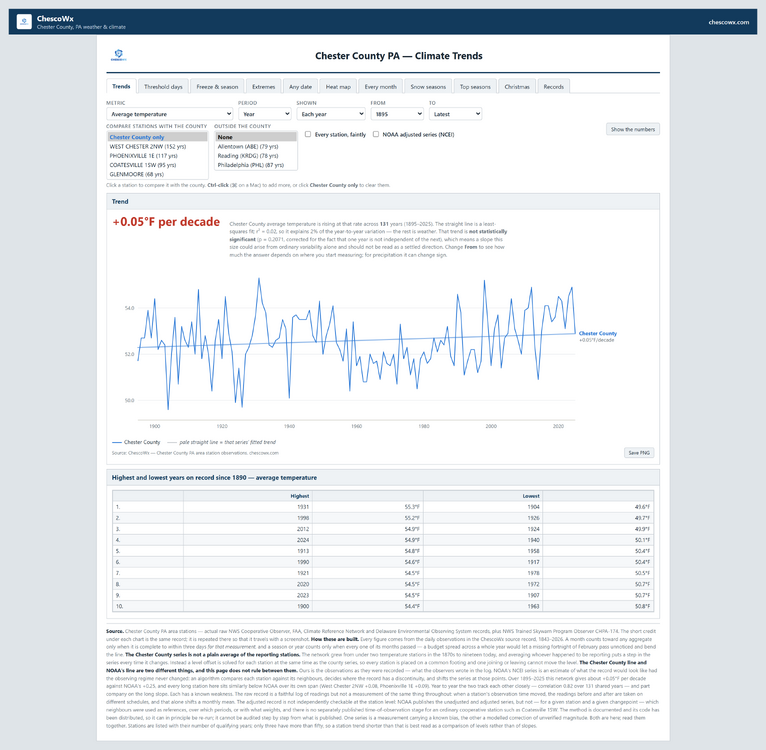
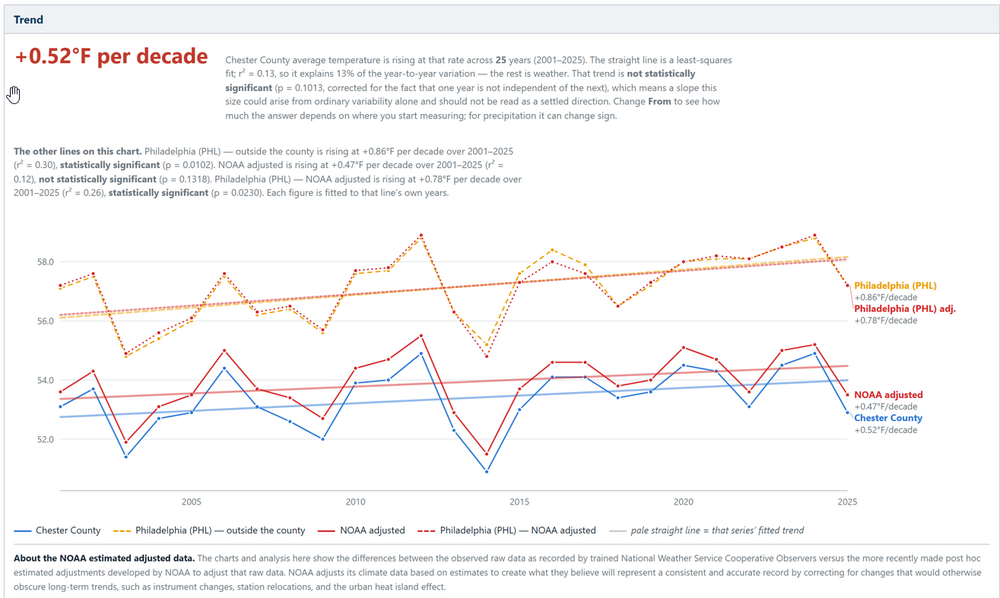
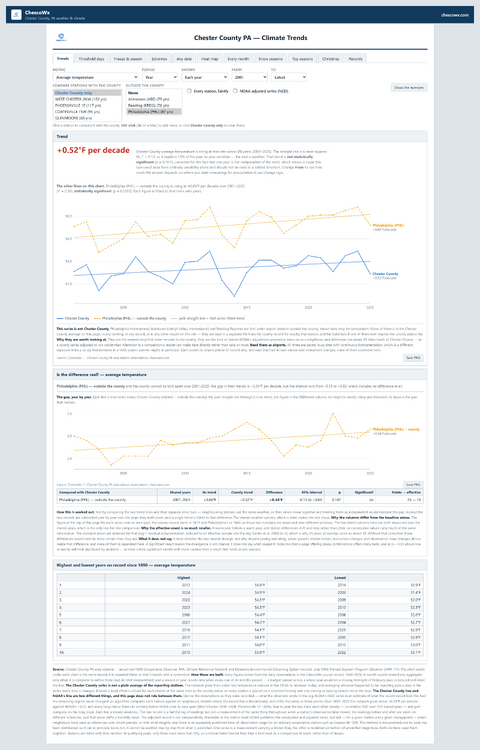
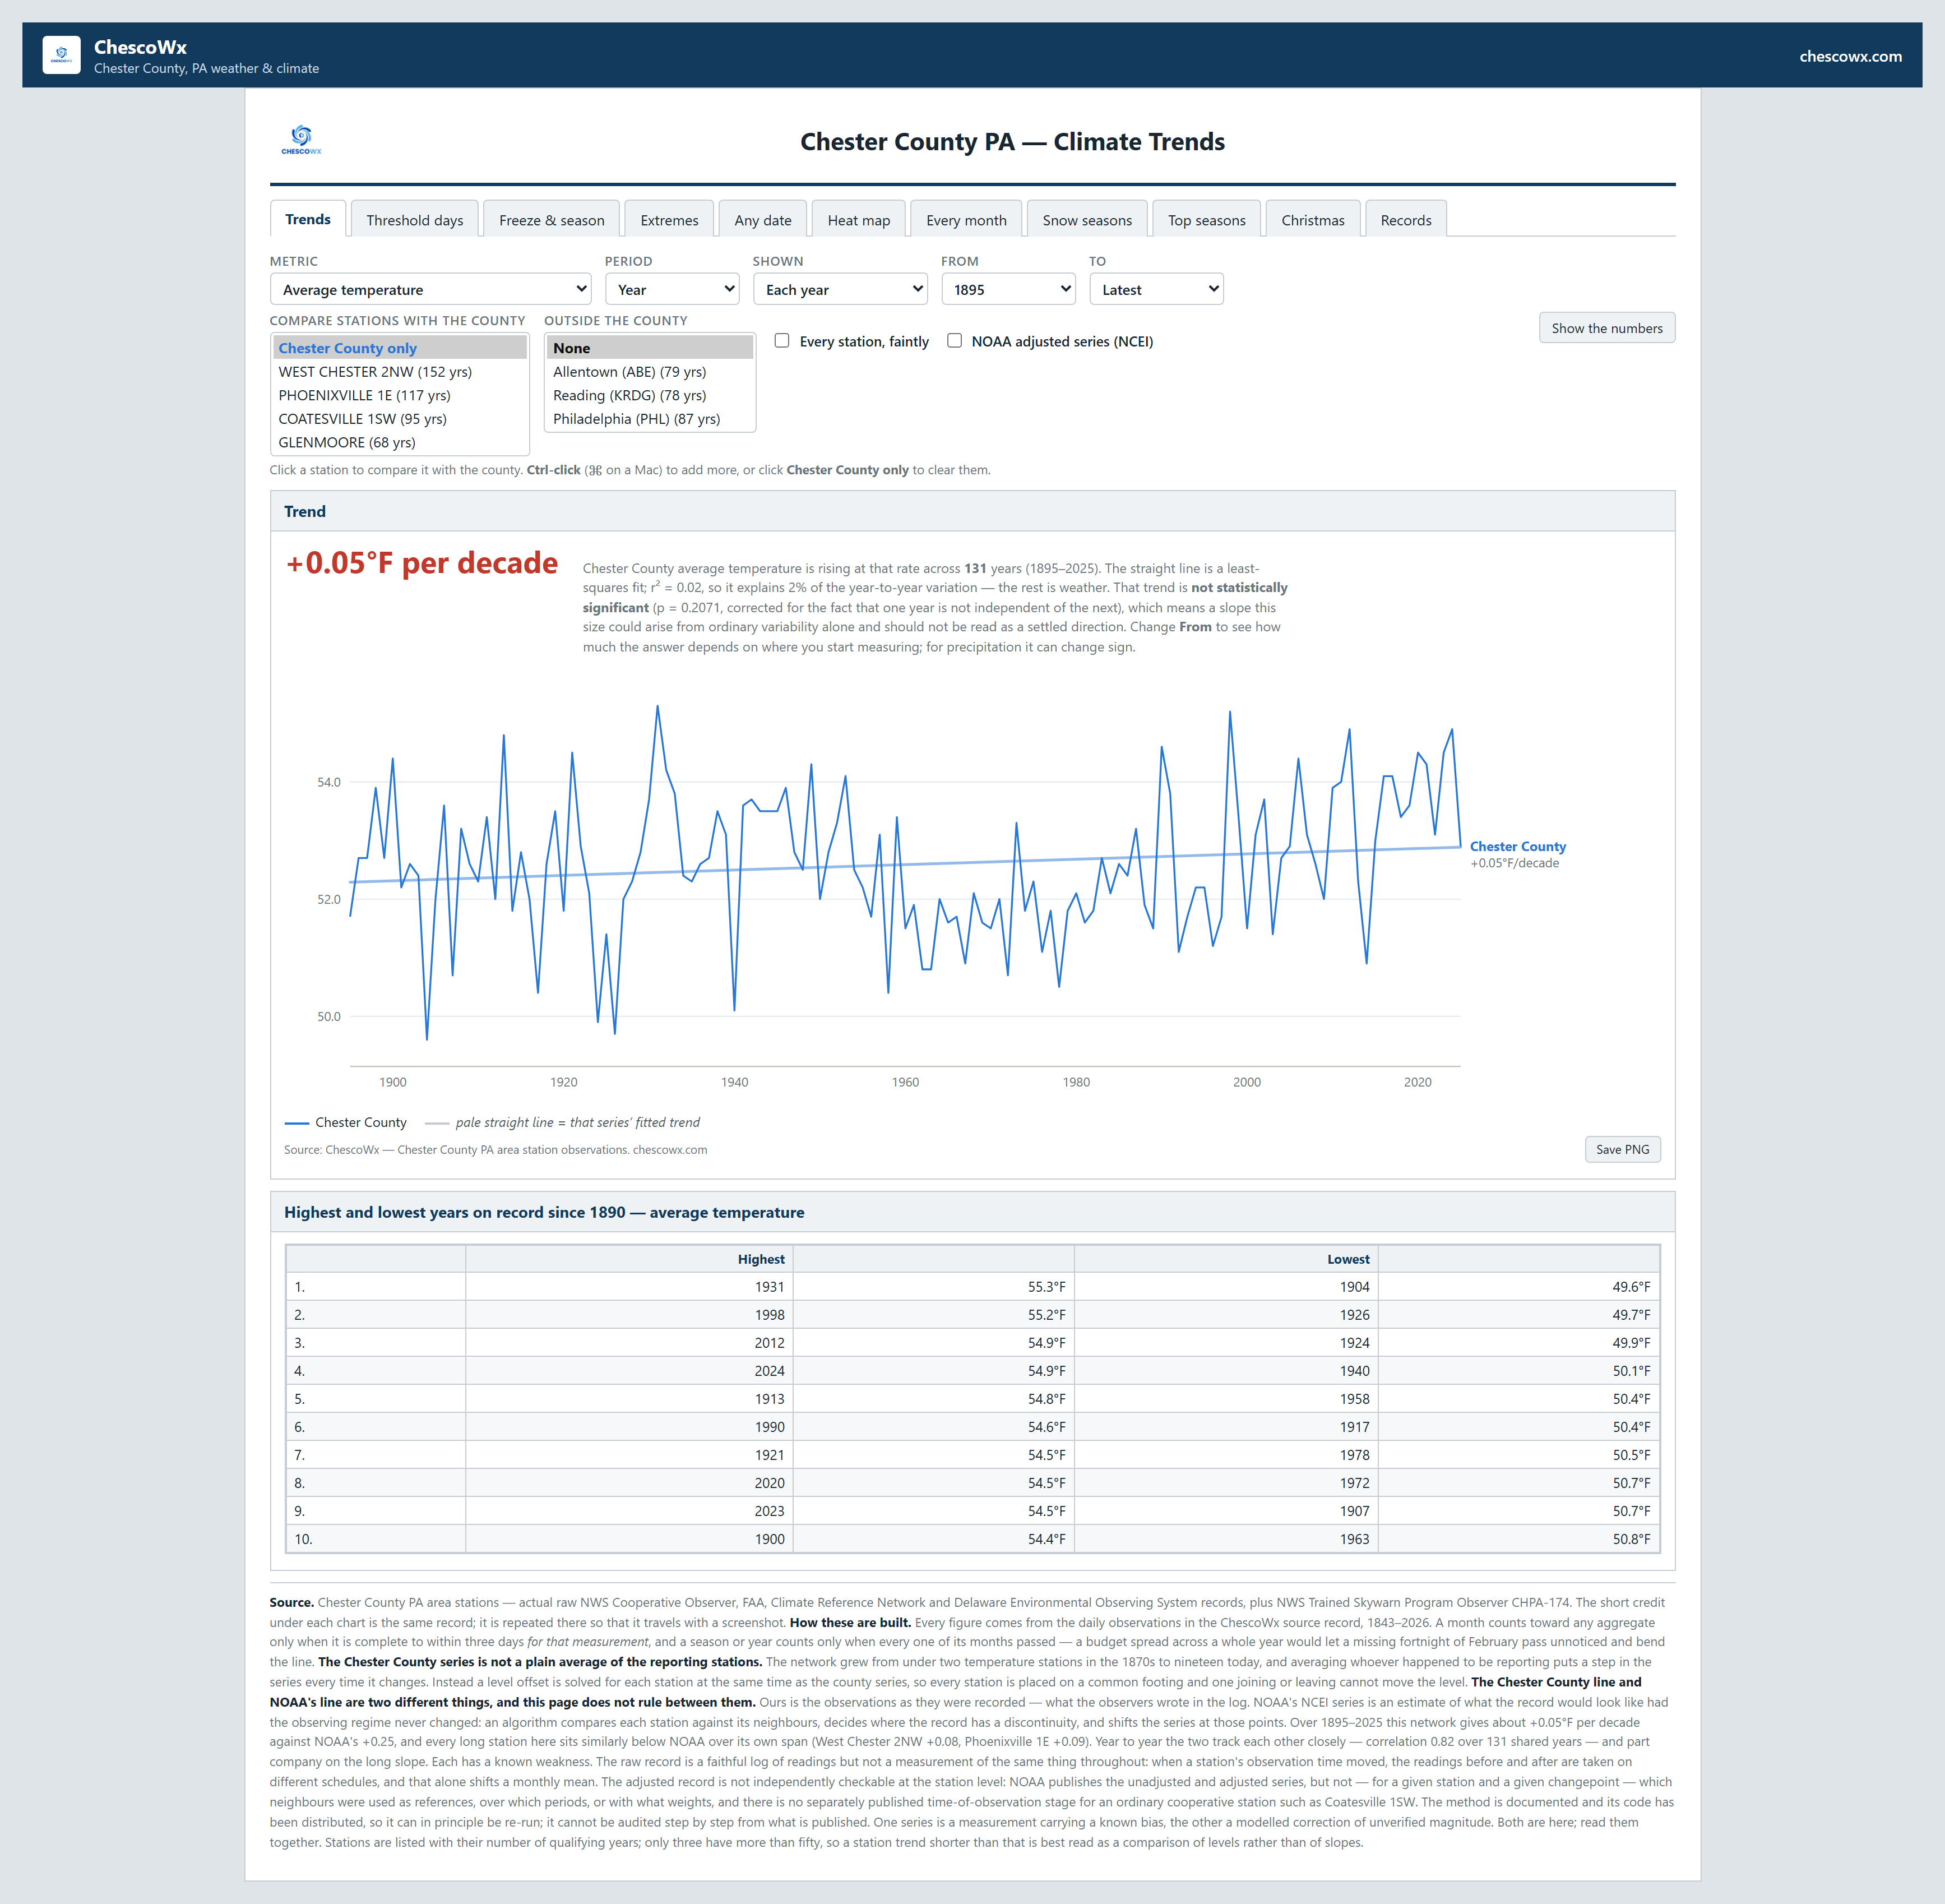
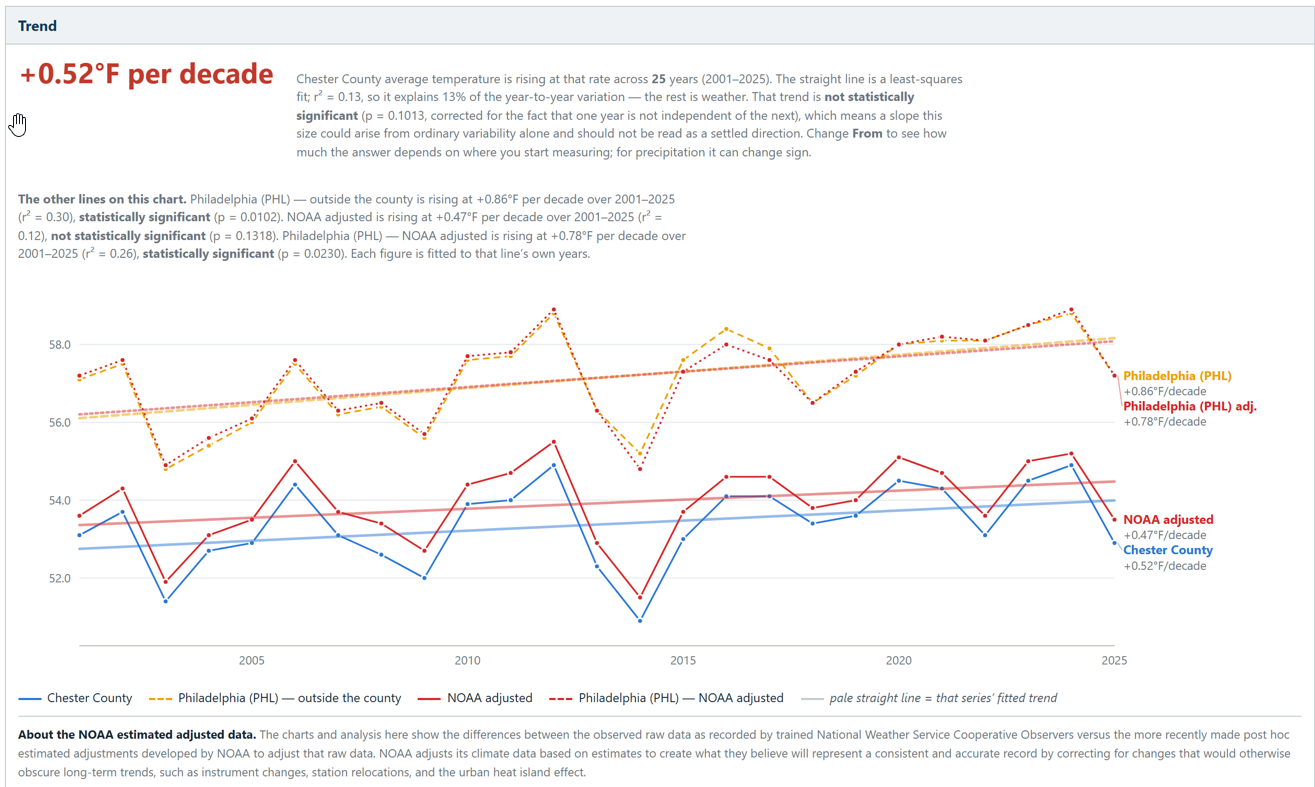
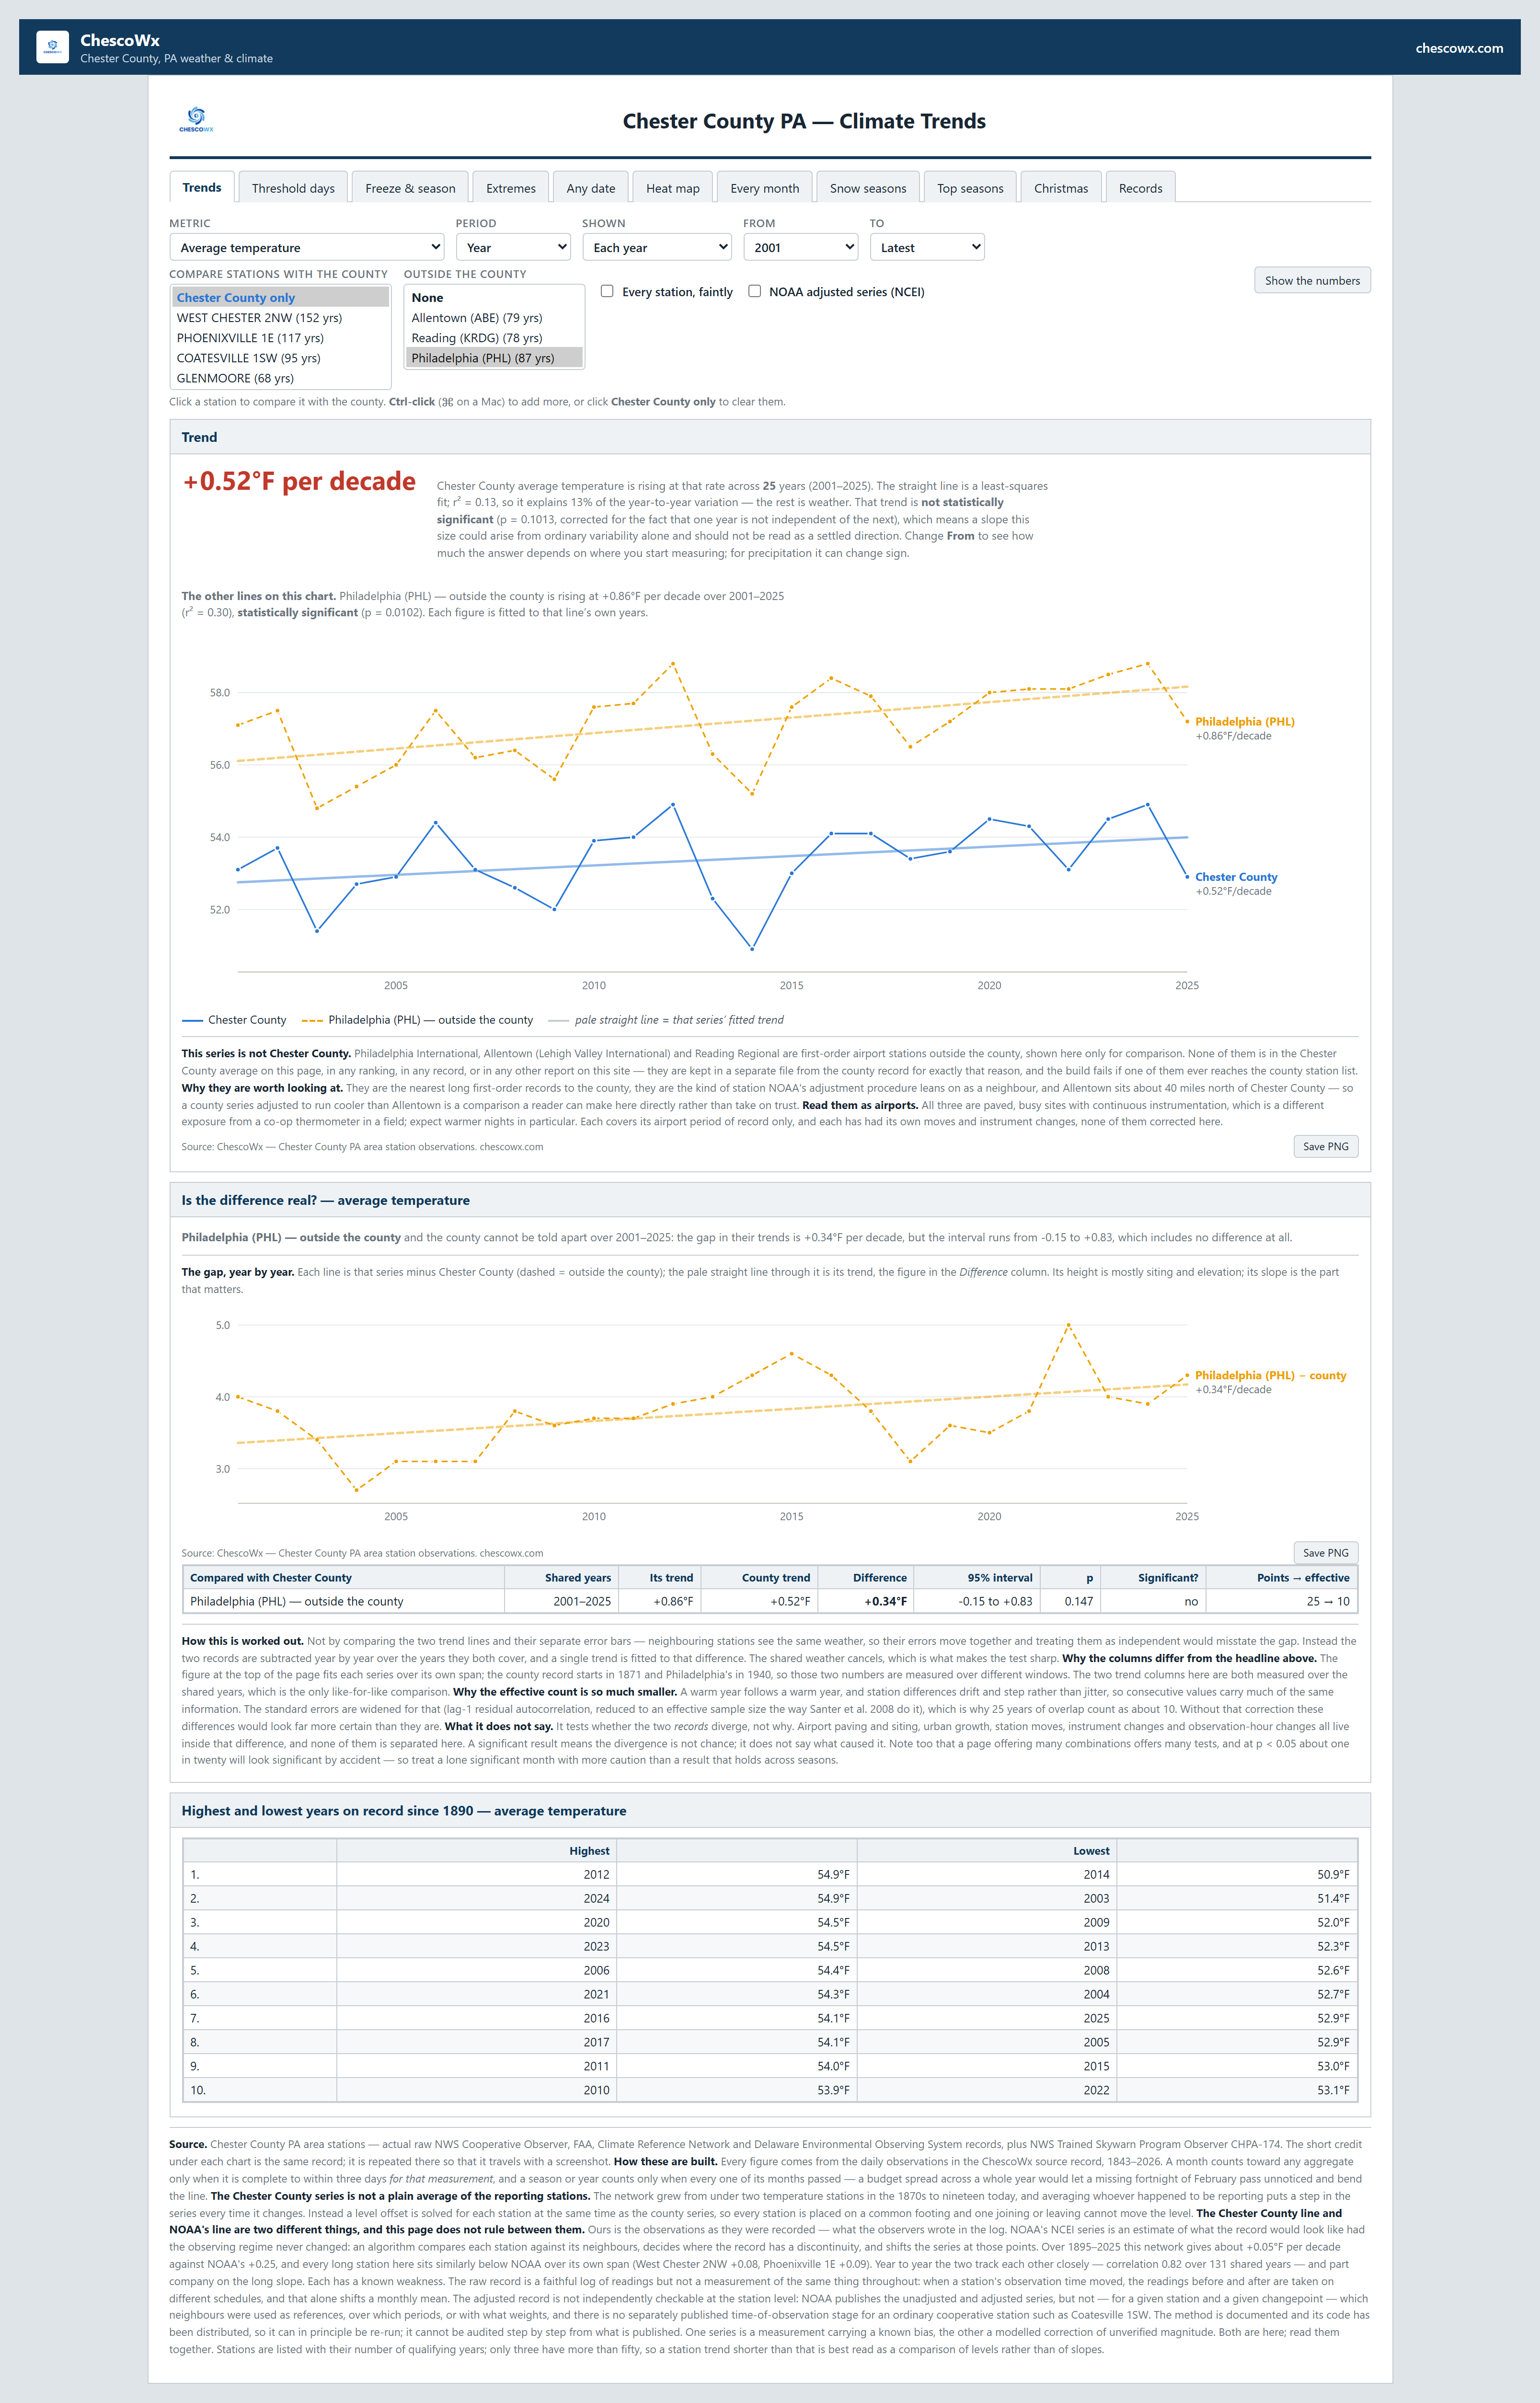
You will often here folks say well while our average daytime highs may not be warming significantly....we are certain that the nightime lows are warmingg....Well I went back and did a statistical analysis to see if between 1890 and 2025 we saw statistically warming of overnight lows and daytime highs along with the overall average temperatures. We used both a pure raw all station mean which is just the raw untouched data and an anomaly composite which while still raw data, treats each individual station referenced to its own baseline so the changing station roster and locations can't fabricate some false trend. Raw all-station mean (the literal, unadjusted county average): none of the three are statistically significant. Average high: +0.055 °F/decade, p = 0.073 — warming, but just short of significance (borderline). Average low: +0.022 °F/decade, p = 0.49 — not significant. Overall average: +0.039 °F/decade, p = 0.15 — not significant. So by the pure raw mean, there's no statistically significant warming or cooling in any of the three over 1890–2025 — a slight (non-significant) warming lean in all three. Anomaly composite (still raw data, but each station referenced to its own baseline so the changing station roster can't fabricate a trend): two of the three are significant, and they point in opposite directions. Average high: +0.094 °F/decade, p = 0.003 — significant warming. Average low: −0.075 °F/decade, p = 0.008 — significant cooling. Overall average: +0.010 °F/decade, p = 0.72 — not significant (the high and low cancel out). The one thing both methods agree on firmly: the overall average temperature shows no statistically significant trend either way across the 135 years across Chester County from 1890-2025. Below are some charts that highlight all of the above.
-
Hi Mike I did of course supply all of the above information to Claude to ensure we got a useful result! As you know homogenization remains nothing more then a hypothesis-driven statistical correction, it is of course not a measurement. Pairwise algorithms like PHA infer breakpoints from neighbor differences, and when 44 of 51 Berkeley breakpoints at Chesco stations are a code 4 meaning empirically detected, with absolutely no metadata backing, that's an algorithm asserting station changes that are clearly not able to be documented. That is a legitimate target for scrutiny, it is not fringe skepticism. My finding that the adjustment series itself carries a significant linear time trend (r² 0.34–0.67) is the greatest point I have — a correction for discrete, random station artifacts shouldn't behave like a smooth ramp as these adjustments do!
-
Back to the NCEI adjustments Station Breaks Code 1 (documented move) Code 2 (gap) Code 3 (documented TOB) Code 4 (no documentation) Coatesville 1SW 14 0 0 0 14 West Chester 2NW 10 2 0 1 7 Phoenixville 1E 9 0 1 0 8 Devault 1W 5 0 0 0 5 West Chester 1W (Hadley) 5 0 1 0 4 Kennett Square 4 0 1 0 3 Coatesville 2W 2 1 0 0 1 Morgantown 2 0 0 0 2 Sadsburyville 0 — — — — West Grove 1SE 0 — — — — TOTAL 51 3 3 1 44 Four of 51 breaks (8%) have a documented physical cause. Forty-four (86%) are statistically inferred with no documentation. And yes — the two systems agree at r = 0.9986, mean difference 0.030 °C/decade across the five stations NCEI adjusted. That's the bridge I failed to draw last message. Put together, the argument runs: NCEI's files publish no breakpoint information at all — I checked every field; there's no changepoint list, no dates, no reasons. But NCEI's adjustments are near-identical to Berkeley's, and Berkeley does publish the reasons. So Berkeley's inventory is a defensible proxy for what the PHA is doing to the same stations. And that inventory says: overwhelmingly undocumented, statistically inferred corrections. Coatesville 1SW is the clearest case — fourteen breakpoints, every one empirical, against six documented relocations in HOMR. The algorithm found fourteen discontinuities and matched none of them to a known event. Meanwhile at West Chester it did the reverse error: classified the April 1921 and Nov/Dec 1927 documented observer-and-site changes as empirical, and produced no breakpoint at the documented March 1936 relocation. So the metadata is being used badly in both directions — real events missed or mislabelled, inferred events unsupported. Now "undocumented" is not the same as "wrong" — we know the PHA is designed to catch undocumented changes, and station histories are genuinely incomplete. But the specific issue at Coatesville 1SW remains that 86% is a high proportion on which to rest a correction that reverses the sign of Coatesville's trend, and it's a fair thing to put in front of them: on what basis were fourteen breakpoints identified at a station with six documented relocations, none of which they coincide with? I have drafted an email that I have sent to them this AM see below and I will keep you updated. Jared -Thank you again for the QCU and QCF files — they were exactly what I needed. Working through them raised a question I don't think the distributed product can answer, and I'm hoping you can point me to whoever handles PHA methodology. The GHCN-M v4 records carry ID, YEAR, ELEMENT and twelve repetitions of VALUE/DMFLAG/QCFLAG/DSFLAG. As far as I can tell there is no changepoint list, no adjustment magnitudes, and no indication of what supports any given correction. For USC00369464 (West Chester 2NW) the QCF series applies roughly -2.37 C to the 1855-1869 period — a stretch covered by a single observer at a single site, per WB Form 530-1, Index No. 36-9464-3. For USC00361589 (Coatesville 1SW) and USC00369464 (West Chester 2NW), could I request for the entire POR: 1. The changepoint dates the PHA identified for each station. 2. The adjustment magnitude applied at each changepoint. 3. Whether each was supported by documented station-history metadata or detected statistically from neighbor comparison and if so what station(s) were used for this neighbor comparison? I understand the PHA is designed to detect undocumented discontinuities, so I'm not assuming documentation exists for every break — I'd simply like to know which are which. Berkeley Earth publishes exactly this per station (a per-month code distinguishing documented moves, time-of-observation changes, gaps, and empirical detections), which is what prompted the question. If this is better directed elsewhere within NCEI, I'd be grateful for the referral. Thanks very much, Paul
-
Central PA Summer 2026 Discussion/Obs Thread
ChescoWx replied to Voyager's topic in Upstate New York/Pennsylvania
Our muggy warm weather looks to continue through tomorrow with chances of showers and thunderstorms before a cold front crosses the area by later Thursday. Following that front we get an almost autumnal sneak peek with highs Friday through Monday in the upper 70's to around 80 degrees and lows by Saturday morning in the refreshing 50's. -
E PA/NJ/DE Summer 2026 Obs/Discussion
ChescoWx replied to PhiEaglesfan712's topic in Philadelphia Region
Our muggy warm weather looks to continue through tomorrow with chances of showers and thunderstorms before a cold front crosses the area by later Thursday. Following that front we get an almost autumnal sneak peek with highs Friday through Monday in the upper 70's to around 80 degrees and lows by Saturday morning in the refreshing 50's. -
Thanks again Mike I am in the process of having the data reviewed it looks like I can add 21 years of raw data to West Chester 2NW to now include 1871-1892 thank you!! It looks like that's the only Chesco site on there....I know there were older obs at least back to 1888 for Coatesville 1SW on a summary basis not daily but if you find any other stations let me know. Really appreciate your help! Paul
-
You are correct the processed data is listed as Berkeley station 35128, "WEST-CHESTER-1W" — monthly means, sole ID hadcru 720461, no COOP number - that is processed not raw data! This is a different animal entirely. The CSV matching the handwritten sheet says nothing about that file, because the CSV isn't its source this indeed looks to be West Chester 2NW old data! Below is the QC Check and of note only those 2 days in June 2 and 3 were flagged
-
Interesting in reviewing the data it is apparently an already altered and processed product and not raw! What about 1855–1892? That's the honest attraction — 462 months, 35 complete years, entirely predating your Source File. But it fails your own standards on three counts: Monthly means only. Your Source schema is daily: High, Low, Avg Temp, Precip, Snow, Sn Cover. There's nothing to put in those columns. It's a processed product, not raw. Your standing rule is raw observations only, no estimated or filled values. This has passed through CRU's pipeline and carries an undocumented adjustment. The 1.32 °C offset almost certainly extends backward. The bias is present throughout the checkable period and drifts at +0.126 °C/dec. Pre-1893 values are probably ~1.3–1.5 °C too cold relative to your network, and there's nothing to calibrate against.
-
From the analysis by Claude - Coatesville 1SW trends, °C/decade, 1894–1982 - Key headline the adjustments are questionable.... 1894–1903, mean adjustment applied: −0.72 °C (−1.30 °F) — early years pushed down 1972–1981, mean adjustment applied: +0.79 °C (+1.42 °F) — late years pushed up Net swing across the record: +1.51 °C (+2.72 °F) Cool the beginning, warm the end. That's the whole mechanism, and it's why the adjusted series warms while the raw series cools. Why I put that column in the table rather than the raw trends. The r² of 0.671 is the striking part: 67% of the variance in Berkeley's correction is explained by a straight line in time. These corrections are supposed to be a sum of independent step functions, each fixing an unrelated site or instrument problem at an unrelated date. There's no mechanical reason fourteen such steps should add up to a straight line. That they do — at five of seven stations, all with p < 10⁻⁴ — is the observation worth putting in front of NCEI. Every single breakpoint is code 4 Fourteen breakpoints: 1896-12, 1902-02, 1917-08, 1920-09, 1922-08, 1930-10, 1936-05, 1941-06, 1946-04, 1959-11, 1968-05, 1971-04, 1973-07, 1976-02. Not one is code 1 (documented move), 2 (gap), or 3 (time-of-observation change) — all fourteen are empirically inferred from neighbor comparison. Given that your HOMR work documents six actual site relocations at this station between 1888 and 1982, Berkeley detected none of them as documented events. Worth cross-checking your Coatesville 1SW History sheet against those fourteen dates: any that coincide with a real move is a defensible correction; any that don't is a correction inferred purely from the neighbors disagreeing. Of note only Coatesville 2W had a documented flagged station move across the entire Coatesville lineage - in April 2001. That's the first and only documented move Berkeley has flagged anywhere in the Coatesville lineage, against six relocations in your HOMR research and fourteen all-code-4 breaks at 1SW.
-
I had a request to update the "heatwave" stats to something potentially more meaningful. Which is 3 or more consecutive days with daily maximum temperatures above the 90th and 95th percentile for all Chester County Stations. The below rank summary makes the absolute-vs-relative divergence concrete. Sorted by absolute rank, the biggest movers are the 2010s (11th → 4th) and 2020s (13th → 6th), both rising 7 places once heat is judged against each station's own norm — meaning recent decades have been locally extreme even though they weren't absolutely record-hot. Going the other way, the 1960s (−4) and 1990s (−5) fall under the relative lens, and the 1940s slip from 1st to 3rd. The 1930s hold firm near the top under both definitions, and the 1950s actually take the #1 spot under P90
-
Central PA Summer 2026 Discussion/Obs Thread
ChescoWx replied to Voyager's topic in Upstate New York/Pennsylvania
I had a request to update the "heatwave" stats to something potentially more meaningful. Which is 3 or more consecutive days with daily maximum temperatures above the 90th and 95th percentile for all Chester County Stations. The below rank summary makes the absolute-vs-relative divergence concrete. Sorted by absolute rank, the biggest movers are the 2010s (11th → 4th) and 2020s (13th → 6th), both rising 7 places once heat is judged against each station's own norm — meaning recent decades have been locally extreme even though they weren't absolutely record-hot. Going the other way, the 1960s (−4) and 1990s (−5) fall under the relative lens, and the 1940s slip from 1st to 3rd. The 1930s hold firm near the top under both definitions, and the 1950s actually take the #1 spot under P90 -
E PA/NJ/DE Summer 2026 Obs/Discussion
ChescoWx replied to PhiEaglesfan712's topic in Philadelphia Region
I had a request to update the "heatwave" stats to something potentially more meaningful. Which is 3 or more consecutive days with daily maximum temperatures above the 90th and 95th percentile for all Chester County Stations. The below rank summary makes the absolute-vs-relative divergence concrete. Sorted by absolute rank, the biggest movers are the 2010s (11th → 4th) and 2020s (13th → 6th), both rising 7 places once heat is judged against each station's own norm — meaning recent decades have been locally extreme even though they weren't absolutely record-hot. Going the other way, the 1960s (−4) and 1990s (−5) fall under the relative lens, and the 1940s slip from 1st to 3rd. The 1930s hold firm near the top under both definitions, and the 1950s actually take the #1 spot under P90 -
Central PA Summer 2026 Discussion/Obs Thread
ChescoWx replied to Voyager's topic in Upstate New York/Pennsylvania
Continued warm and humid through Tuesday before we start a welcome cooling trend which by Saturday morning will see some locations with lows in the 50's with highs by the end of the week in the pleasant 70's. Best chances of any rain will be Monday night through Wednesday -
E PA/NJ/DE Summer 2026 Obs/Discussion
ChescoWx replied to PhiEaglesfan712's topic in Philadelphia Region
Continued warm and humid through Tuesday before we start a welcome cooling trend which by Saturday morning will see some locations with lows in the 50's with highs by the end of the week in the pleasant 70's. Best chances of any rain will be Monday night through Wednesday -
Central PA Summer 2026 Discussion/Obs Thread
ChescoWx replied to Voyager's topic in Upstate New York/Pennsylvania
Our uncomfortably warm weather continues with additional chances of some showers and thunderstorms later today. Tomorrow looks to be the hottest day in this stretch with temperatures well into the 80's and even some 90's in more valley locations. Temperatures will remain above normal this week before falling back close to normal by Friday. -
E PA/NJ/DE Summer 2026 Obs/Discussion
ChescoWx replied to PhiEaglesfan712's topic in Philadelphia Region
Our uncomfortably warm weather continues with additional chances of some showers and thunderstorms later today. Tomorrow looks to be the hottest day in this stretch with temperatures well into the 80's and even some 90's in more valley locations. Temperatures will remain above normal this week before falling back close to normal by Friday. -
Central PA Summer 2026 Discussion/Obs Thread
ChescoWx replied to Voyager's topic in Upstate New York/Pennsylvania
I saw on the news one of the local weather folks mentioning we are about to see our 6th "Heatwave" which is a stat that defines a Heatwave of at least 3 consecutive days over 90 degrees. While the news always just sources the Philadelphia International Airport....out here where we live in Chester County only 1 station at Phoenixville has reported even 3 heatwaves this summer with all other stations only 1 or 2 "Heatwaves". As you can see below the frequency of heat waves here in Chester County has in reality been decreasing over the last 14 decades as the below chart which is normalized "per 100 station-years" because the number of active stations has grown sharply over time clearly shows. -
E PA/NJ/DE Summer 2026 Obs/Discussion
ChescoWx replied to PhiEaglesfan712's topic in Philadelphia Region
I saw on the news one of the local weather folks mentioning we are about to see our 6th "Heatwave" which is a stat that defines a Heatwave of at least 3 consecutive days over 90 degrees. While the news always just sources the Philadelphia International Airport....out here where we live in Chester County only 1 station at Phoenixville has reported even 3 heatwaves this summer with all other stations only 1 or 2 "Heatwaves". As you can see below the frequency of heat waves here in Chester County has in reality been decreasing over the last 14 decades as the below chart which is normalized "per 100 station-years" because the number of active stations has grown sharply over time clearly shows. -
Hey Mike, no problem. I went outside of Chester County to find "neighborhood" stations within 30 miles of Coatesville1SW with enough consistent overlapping observations from 1941-1975. We found 6 potential additional “neighborhood” stations but only 2 had enough consistent data Holtwood and Ephrata over the years in question to add to the 3 main Chester County stations above. So what did the analysis find? All 5 raw stations (Coateville 1SW / West Chester 2NW/ Phoenixivlle 1E / Holtwood and Ephrata move together at the same statistically same cooling rate for the same years from 1941-1975 so there is no inconsistent cooling or warming trend for the control station in this analysis (Coatesville 1SW) based on the raw data across these stations. However, as we have found before - the overall NCEI Adjusted Chester County data while following the raw average temperature pattern consistently applied a solid ~1-3 F post hoc adjustment to Coatesville 1SW and all of the 5 stations were chilled by NCEI lower than any of the 5 in the NCEI Chester County wide adjusted annual average temperatures. So for essentially the entire period! This was a clear offset, not a trend divergence. So again what station if not a neighboring station within 30 miles of Chester County was NCEI using to apply non-stop chilling adjustments to Coatsville 1SW to adjust the raw temperatures to even lower levels than they were all showing for all those years? So we know Coatesville 1SW was not adjusted cooler due to Time of Observation bias that was ruled out by majority 8am readings (if anything one could argue for a slight warming adjustment for homogenization) No station moves resulted in significant temperatures changes that were not statistically the same as the other area station trends so we still have no support for the individual Coatesville1SW chilling NCEI adjustments and no support for the overall Chester County historical 1941-1975 chilling adjustments made by NCEI.
-
Central PA Summer 2026 Discussion/Obs Thread
ChescoWx replied to Voyager's topic in Upstate New York/Pennsylvania
We have had quite a wet start to August with most spots seeing between 1.8" to around 3 inches of rain over the last 5 days. Some additional shower chances are possible later today and again on Friday night. We should finally dry out by Sunday. Early next week it starts hot with a chance for some of our valley locations to possibly reach 90 degrees both Monday and Tuesday. Could those be the last chances of a 90-degree reading till next spring?