

jaxjagman
-
Posts
8,289 -
Joined
-
Last visited
Content Type
Profiles
Blogs
Forums
American Weather
Media Demo
Store
Gallery
Posts posted by jaxjagman
-
-
THUNDERSNOW !!My first time ever

-
 6
6
-
 3
3
-
-
should pick up soon,almost 40 dbz on the radar to just our NW
-
1
-
-
35 minutes ago, *Flash* said:
Still snowing. Almost to an inch now. Super low ratios.
those are some huge flakes..lol
-
1
-
-
This is what KY said this afternoon
.LONG TERM /TONIGHT THROUGH SUNDAY/...
Issued at 345 PM EST Sun Feb 11 2024

Monday Night through Wednesday Night...

The forecast for Monday night is quite complex and contains a
substantial amount of uncertainty.  An area of surface low pressure
is forecast to move east-northeast across northern TN and into
southeast KY and into West Virgina during evening and into the
overnight hours.  On the north side of this low pressure system,
widespread rain showers with embedded thunderstorms are expected to
be moving across Kentucky and portions of southern Indiana.  As the
low slides into southeast KY, colder air will quickly wrap into the
backside of the system resulting in the rain quickly changing over
to wet snow.  Much of the current guidance shows a heavy band of wet
snow transversing the region Monday evening within a strongly forced
deformation band.  Earlier runs from the overnight period suggested
that this heavier band would transverse southern IL/IN/OH.  However,
there has been a notable southward trend in this band in the morning
and afternoon guidance.  As of this writing, the highest threat of
accumulating snows continues to be over portions of southern Indiana
and the northern half of Kentucky.

Initially, surface and ground temperatures are expected to be well
above freezing early Monday evening.  However, as the transition to
snow happens (which may be quite fast), the rate of snowfall will
likely overwhelm the warm ground/surface temperatures.  Still, we`ll
loose some of the early accumulation due to the warm ground and
above freezing surface temps, but air temps are likely to fall
pretty quickly as we transition over to snow.  The snow is likely to
be the heaviest from late Monday evening into the early hours of
Tuesday morning.  Given the amount of forcing and lift across the
region Monday evening, the snow could come down quite impressively
in some spots given the convective signals that we`re seeing in the
high resolution models.  It is possible that intense snow may fall
in areas where rates could reach 1-2"/hr perhaps higher in isolated
spots.

Given the uncertainty in the overall setup, the marginal
temperatures, and continued shifting of model guidance, messaging
this system remains a bit problematic.  Uncertainty in snowfall
amounts and location remains too high to delineate any one area for a
Winter Storm Watch.  To alert the public of the adverse weather that
is expected to impact the region, surrounding WFO`s collaborated and
decided to go with a higher impact Winter Weather Advisory with this
forecast issuance to get the word out.  Snowfall amounts of 1-3
inches with localized amounts up to 4 inches are likely within the
advisory area. Depending on forecast trends, this advisory will
likely undergo further refinement over the next 24 hours.  If
confidence increases on where higher snows may end up falling, an
upgrade to a Winter Storm Warning for portions of the area may be
required in subsequent forecasts.  Persons in southern Indiana and
central Kentucky should continue to closely monitor forecasts
tonight and on Monday and be prepared for hazardous road conditions
Monday evening and Tuesday morning.
-
1
-
-
2 minutes ago, Carvers Gap said:
Yeah, it snuck-up on me for sure. I was just looking at the GFS trends, and it has moved SE for several runs. When I say "on time," the 14th was the original pattern change date. Crazy that west TN(maybe portion of middle) might be backing into a storm.
Its insane Carver if this were to happen..lol
-
3
-
-
35 minutes ago, Holston_River_Rambler said:

thats crazy,even the GFS now,this was suppose to be into the OV
-
3
-
-
I believe this is more ENSO than anything else.But that's JMHO
11 Feb 2024 1005.21 1008.95 -40.73 -8.94 -5.15 10 Feb 2024 1005.61 1009.10 -39.53 -7.15 -5.06 9 Feb 2024 1003.50 1008.45 -46.54 -5.57 -4.93 8 Feb 2024 1005.88 1007.85 -32.23 -3.97 -4.64 7 Feb 2024 1005.31 1008.70 -39.05 -2.84 -4.42 6 Feb 2024 1005.56 1009.50 -41.69 -1.50 -4.12 5 Feb 2024 1007.06 1009.90 -36.41 -0.02 -3.85 4 Feb 2024 1008.30 1009.40 -28.05 0.94 -3.66 3 Feb 2024 1007.67 1007.55 -22.19 1.65 -3.51 2 Feb 2024 1006.85 1008.15 -29.01 2.20 -3.36 1 Feb 2024 1007.27 1008.65 -29.40 3.19 -3.02 31 Jan 2024 1009.49 1009.45 -21.52 4.18 -2.70 30 Jan 2024 1009.93 1009.15 -18.04 4.81 -2.50 29 Jan 2024 1009.71 1008.55 -16.25 5.81 -2.29 28 Jan 2024 1010.40 1008.00 -10.41 6.71 -2.02 27 Jan 2024 1011.41 1007.50 -3.29 7.10 -1.83 26 Jan 2024 1012.20 1008.10 -2.40 7.08 -1.83 25 Jan 2024 1011.37 1008.40 -7.72 7.07 -1.81 24 Jan 2024 1011.85 1008.10 -4.05 7.35 -1.78 23 Jan 2024 1010.69 1007.45 -6.45 7.18 -1.77 22 Jan 2024 1010.29 1005.50 0.85 6.48 -1.69 21 Jan 2024 1010.18 1003.25 10.93 5.24 -1.69 20 Jan 2024 1010.92 1003.10 15.13 3.85 -1.89 -
1
-
-
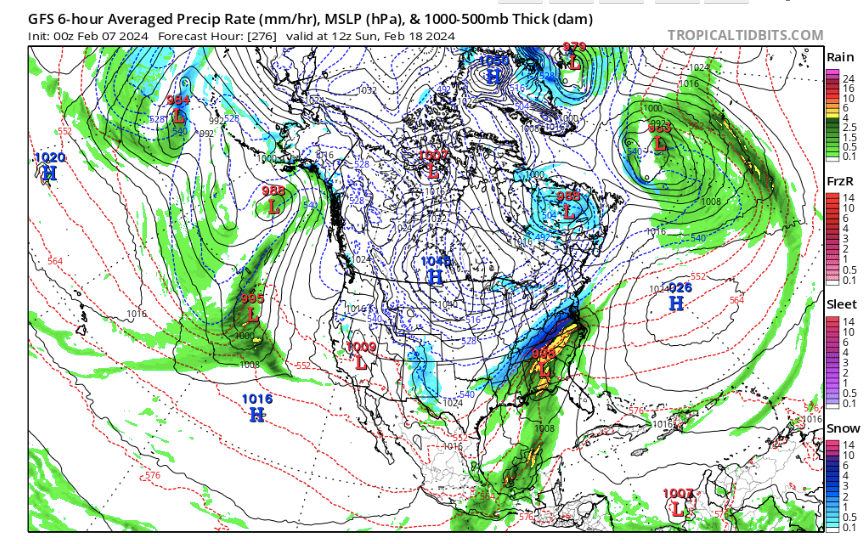
Euro looks totally different from last night.I'll still hold a slim chance but the globals have been mostly consistent with the southern system being more suppressed,plus we still dont even know what the teleconnections will be like
.png.1465f43c9d4b529fe1cd8f436aea957c.png)
.thumb.png.a89a9dee87425319d0bbd2794260a941.png)
-
1
-
2
-
-
1 hour ago, *Flash* said:
A few quick points in passing (Warning: My thoughts yield to west/middle TN; east TN posters can add their tweaks as needed):
1) Before I forget to say it, the transparency, humility, and corporate knowledge base on this board is why I believe it's the best of the main forum options. Discussions that compel chips towards the center of the table, that's how we all learn and grow in understanding together. A corporate job well done there.
2) I'm learning more and more how each winter setup is truly unique, a snowflake unto itself. Last decade, we saw wintry episodes that rarely featured north American teleconnection alignment between the primary players (EPO/PNA/AO/NAO). During this time, the local weather communities were adjusting to what we needed to see in our respective valleys within the context of a -PDO. The way my memory works, I recall events by themes and tropes:
- 2010-11 - How middle/east TN can score when the -NAO overwhelms the pattern. Second strongest Niña in the 21st century. Only 2007-08 ranks higher.
- 2011-12 - Pure misery on the heels of a great two-year stretch. Creds: PDO/MJO/SSWE.
- 2012-13 - Like the prior winter by extension but hope abounds because...
- 2013-14 - ...we finally see a jackpot setup for east TN. Partial creds: +TNH and PV appearances. #snowdome winter for west/middle TN. Bad history for BNA as the DJF period ranks #1 for total snow/mean temperature departure from average department. Great example of how suppression can kill chances for the western half when the Atlantic quenches the storm track.
- 2014-15 - My friend, the -EPO, makes a cameo and offsets the +NAO. To Carver's point, the February/March 2015 storms were mostly hits for western/middle TN with the greatest totals near the TN River. This year taught me how the Pacific can help parts of the state out, especially as the -PDO weakens. The AMO also dips briefly into negative territory.
- 2015-16 - Winter. Storm. Jonas. That's all I'm going to say. A jackpot storm for northern middle TN during a historic two-week stretch is weather loan forgiveness for 2013-14. For BNA, the 27th snowiest winter took place in the 9th warmest winter courtesy of a temporarily improved PDO. Proof of what one storm can do even when the December prior is the epitome of blowtorch. Creds: SUPER Niño (Modiki) ENSO.
- 2016-17 - Pretty sure everything sucked this winter. Typing the years out hurts my eyes. I'm just going to move on...
- 2017-18 - Dry/cold December. Slight +PNA/-EPO, again, is the solve for middle TN in mid January despite a consistent +NAO. SSWE takes place too late and gives us a cold spring. Plenty of KY snow in early March as the MJO amplification increases. Tough pills to swallow as a two-week adjustment could have been big.
- 2018-19 - Rich man's 2016-17. PNA starts positive but quickly goes negative. +NAO fails to go negative until the spring. PDO is weak but is overrun by other teleconnections. Some nice hits northwest of TN into MO/KY/IL. Lots of MJO amplification fluctuation throughout. Second consecutive cold spring. More misery.
- 2019-20 - See 2016-17. This winter gets a pandemic pass.
- 2020-21 - The rise of the -EPO delivers a brutal late winter blow to points west of the plateau. The NAO starts negative in January but rises throughout the rest of winter. A goldmine February for the western 2/3rd's of the state that ultimately saves winter.
- 2021-22 - A hookup between 2015-16 and 2021-22 and another win for the -EPO/+PNA amidst a +NAO. First two weeks for middle TN see not one, not two, but three notable snow events sandwiched in just a two-week stretch.
- 2022-23 - A tutorial on how winter can be screwed for TN when the NAO cooperates. A true one-hit wonder and another winter to forget overall. I'll let recency bias do the talking here.
3) All of this said, we can see how last January was our mini-perfect storm the way everything came together (almost) statewide. As Carver mentioned, the award goes to the -NAO and is the testament to east TN capitalizing. Generally speaking, west/middle TN can still root for a -NAO despite greater impacts east of the plateau assuming other factors preserve a flatter flow as opposed to SW --> NE. Still, the -EPO being more of a win for west/middle TN cannot be denied despite the limited sample size above. Just my $0.02.
Selah.
Yes,we live in a different world climo wise than the east,after you get over the mountains its a different world.This is also the reason why we see more tornadoes in our parts compared to the east
-
1
-
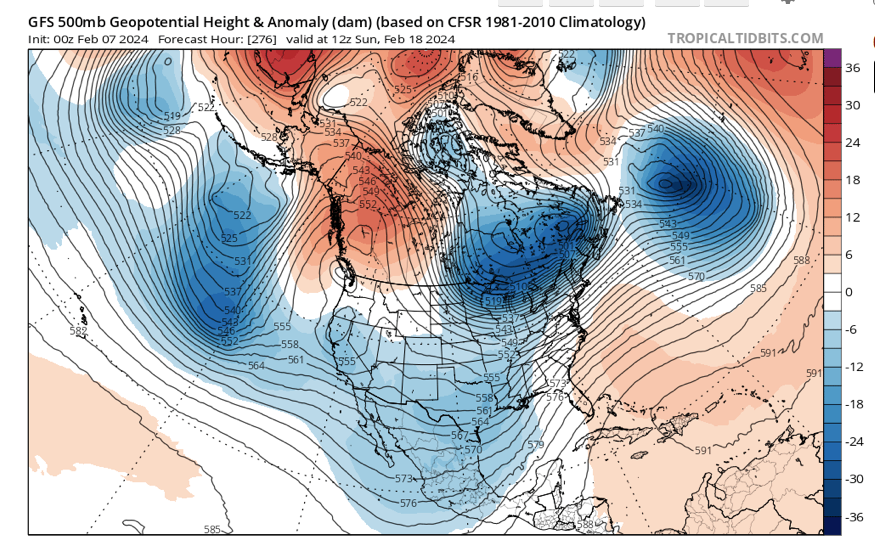
1 hour ago, Carvers Gap said:
This is the current run at 12z. Look at the NAO region. It is (edit)weaker than four days ago. Notice the upstream (upside down) omega with the trough is not sharp compared to four days ago(below). The western PNA is great, but without the Atlantic block...nada.
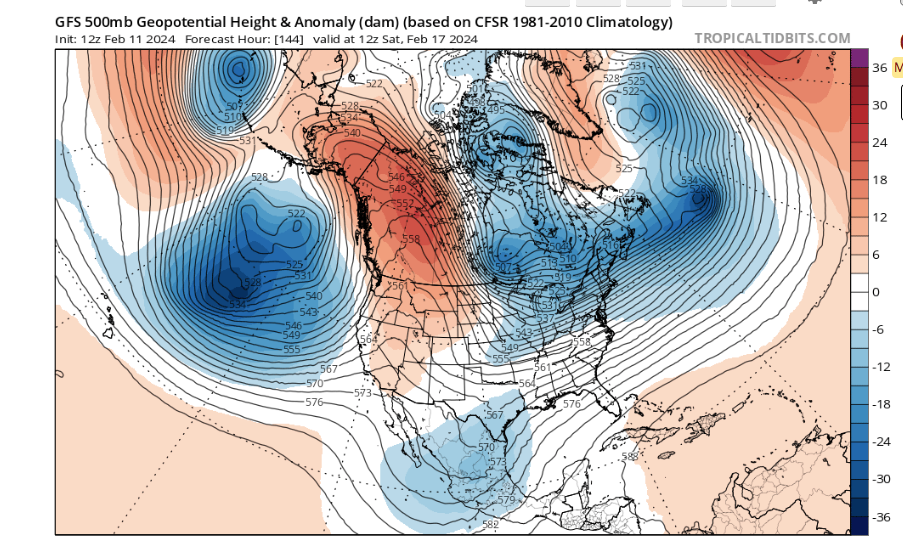
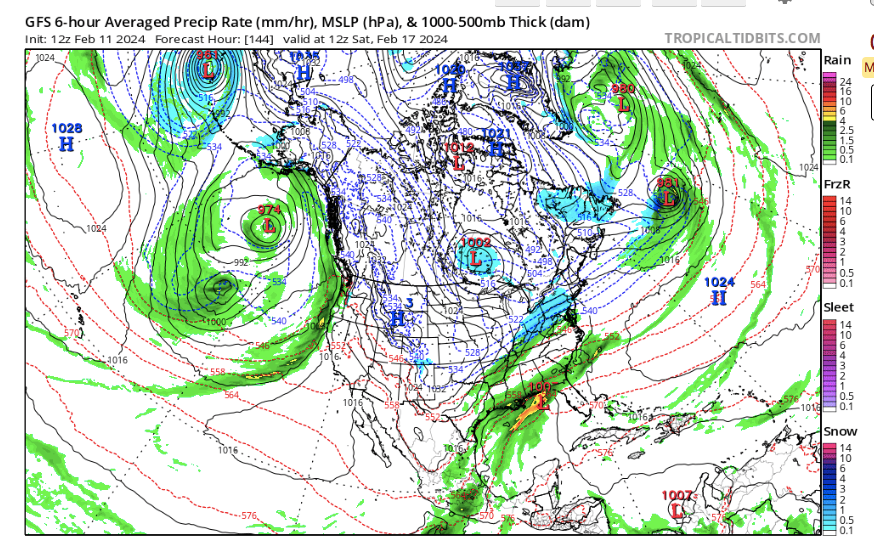
This was just four days ago. Notice the NAO region(Greenland) is marginally better as the heights are higher over a larger area of the Davis Straits. The omega contains the BN heights which is carved out better. Notice the storm is sharper and a better cold air supply. Look at the difference on the surface. Boom. The NAO below has actually backed the flow just enough that the PNA ridge is in EPO territory. This is what I am talking about when I say "NAO driven." That western ridge buckles so that it is a bit more in the eastern Pac. The NAO forced that IMHO. Without the stronger NAO, the ridge on todays run (above) pushes slightly eastward (in the West), and we lose confluence and our cold air supply to boot.
The high in the Atalantic,if its stronger and even more westward than being shown should be ample enough to change the steering pattern and change the storm from going into North Florida
-
1
-
1
-
-
Our last storm here in in MId Tn in Jan we had a -PDO/-PNA-NAO,chart is the EPO.I still think we have a chance for a storm or at least some S word but i'm not sure we'll see the -NAO we saw in Jan
2023 12 28   -1.71
2023 12 29  -36.25
2023 12 30   -0.77
2023 12 31   -8.59
2024 01 01  -16.35
2024 01 02  -14.37
2024 01 03   71.51
2024 01 04  199.53
2024 01 05  196.56
2024 01 06   81.39
2024 01 07   34.24
2024 01 08   65.26
2024 01 09   94.10
2024 01 10    0.67
2024 01 11  -60.09
2024 01 12  -43.39
2024 01 13   -0.39
2024 01 14  -23.32
2024 01 15 -161.03
2024 01 16 -231.80
2024 01 17 -207.17
2024 01 18 -195.44
2024 01 19 -168.61
2024 01 20  -33.35
2024 01 21   61.72
2024 01 22   88.66
2024 01 23  105.73
2024 01 24  108.20
2024 01 25   46.39
2024 01 26   54.46
2024 01 27  111.99
2024 01 28  104.89
2024 01 29  115.66
2024 01 30   98.16
2024 01 31   21.32
2024 02 01   13.72
2024 02 02   30.50
2024 02 03    8.65
2024 02 04  -40.74
2024 02 05  -57.45
2024 02 06  -33.05
2024 02 07   34.99
2024 02 08   47.94
-
1
-
-
Yeah i wasnt laughing at the post,the soup in funny
-
3
-
-
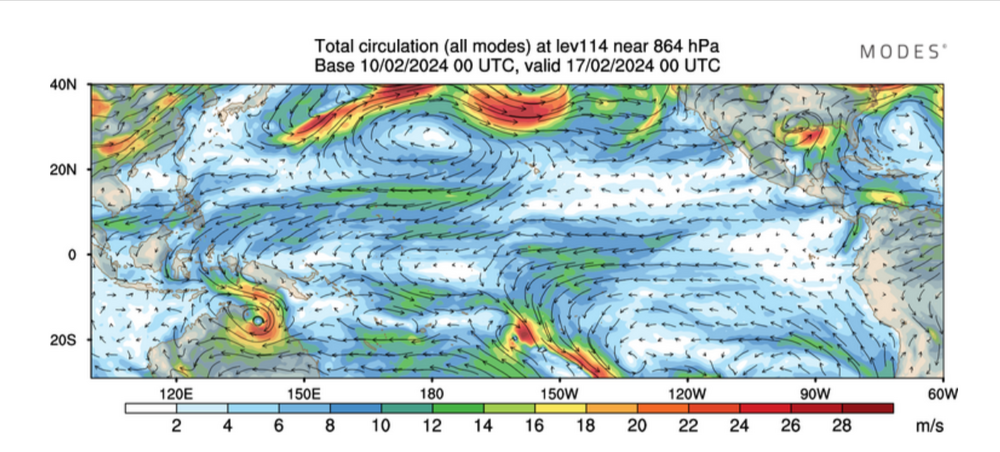
We could get a storm in the long range if the teles work in our favor it seems maybe just a slim chance.The last couple days there was a system going into the Yellow Sea and South Korea basically,so chances are we should see a system further south of us.Right now looking at the teles its gonna be to far south and not really much ample cold air,just something to watch
Sure looks cold tho by Euro AK Rex block and -NAO,probably just cold for us here and more chances if anything for the eastern people
.thumb.png.89978fd23bc82a556774071b21711ede.png)
-
2
-
2
-
-
This was the 4th strongest DMI since 1980 this last fall,all of the other years always resulted into a NINA on the ONI,into the summer months,plus all three other times before hit a moderate to strong NINA.Seemingly in 1994 this was just a Moderate NINO compared to 1997 and 2019,strong.This year is strong(2023)
1997 and 2019 were proceeded by with multi NINA years ,strong NINAS ,but theoretically you could also say 1994 was actually more NINA driven into the pattern for multiple years
1994 0.1 0.1 0.2 0.3 0.4 0.4 0.4 0.4 0.6 0.7 1.0 1.1 1995 1.0 0.7 0.5 0.3 0.1 0.0 -0.2 -0.5 -0.8 -1.0 -1.0 -1.0 1996 -0.9 -0.8 -0.6 -0.4 -0.3 -0.3 -0.3 -0.3 -0.4 -0.4 -0.4 -0.5 1997 -0.5 -0.4 -0.1 0.3 0.8 1.2 1.6 1.9 2.1 2.3 2.4 2.4 .thumb.png.4c4e95e6b8582ecfa241db76f79a6a44.png)
-
1
-
-
EL NIÑO/SOUTHERN OSCILLATION (ENSO) DIAGNOSTIC DISCUSSION issued by
CLIMATE PREDICTION CENTER/NCEP/NWS8 February 2024 ENSO Alert System Status: El Niño Advisory / La Niña Watch
Synopsis: A transition from El Niño to ENSO-neutral is likely by April-June 2024 (79% chance), with increasing odds of La Niña developing in June-August 2024 (55% chance).
During January 2024, above-average sea surface temperatures (SST) continued across most of the equatorial Pacific Ocean [Fig. 1]. SST anomalies weakened slightly in the eastern and east-central Pacific, as indicated by the weekly Niño index values [Fig. 2]. However, changes were more pronounced below the surface of the equatorial Pacific Ocean, with area-averaged subsurface temperature anomalies returning to near zero [Fig. 3]. Although above-average temperatures persisted in the upper 100 meters of the equatorial Pacific, below-average temperatures were widespread at greater depths [Fig. 4]. Atmospheric anomalies across the tropical Pacific also weakened during January. Low-level winds were near average over the equatorial Pacific, while upper-level wind anomalies were easterly over the east-central Pacific. Convection remained slightly enhanced near the Date Line and was close to average around Indonesia [Fig. 5]. Collectively, the coupled ocean-atmosphere system reflected a weakening El Niño.
The most recent IRI plume indicates a transition to ENSO-neutral during spring 2024, with La Niña potentially developing during summer 2024 [Fig. 6]. Even though forecasts made through the spring season tend to be less reliable, there is a historical tendency for La Niña to follow strong El Niño events. The forecast team is in agreement with the latest model guidance, with some uncertainty around the timing of transitions to ENSO-neutral and, following that, La Niña. Even as the current El Niño weakens, impacts on the United States could persist through April 2024 (see CPC seasonal outlooks for probabilities of temperature and precipitation). In summary, a transition from El Niño to ENSO-neutral is likely by April-June 2024 (79% chance), with increasing odds of La Niña developing in June-August 2024 (55% chance; [Fig. 7]).
This discussion is a consolidated effort of the National Oceanic and Atmospheric Administration (NOAA), NOAA's National Weather Service, and their funded institutions. Oceanic and atmospheric conditions are updated weekly on the Climate Prediction Center web site (El Niño/La Niña Current Conditions and Expert Discussions). Additional perspectives and analysis are also available in an ENSO blog. A probabilistic strength forecast is available here. The next ENSO Diagnostics Discussion is scheduled for 14 March 2024.
-
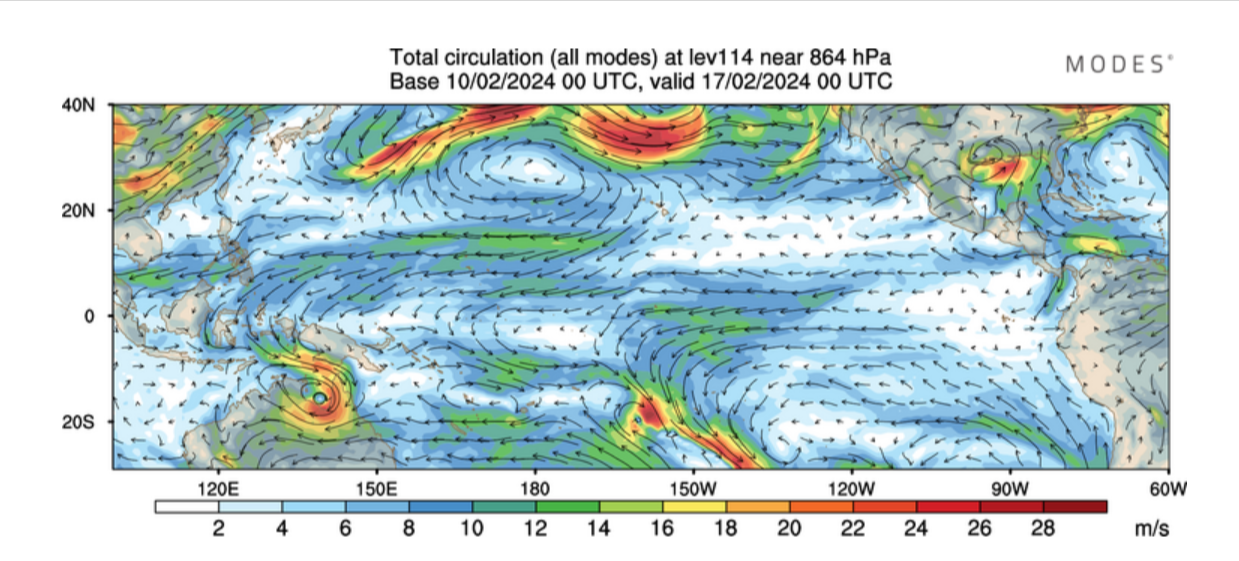
Seemingly the Euro and CFS are close to being on the same page right now .CFS has been showing the velocity getting back into the IO and even Maritime into March,it just recently back down and now as we head towards the end of the first week of March its now into Africa just getting into the Western IO
.thumb.png.6afafdbc9002573ef9d57db70ba091e1.png)
.png.15265d06f76cc6a268644c5c9dff901e.png)
.png.025cb0417e6228222744e2db8e05d0da.png)
-
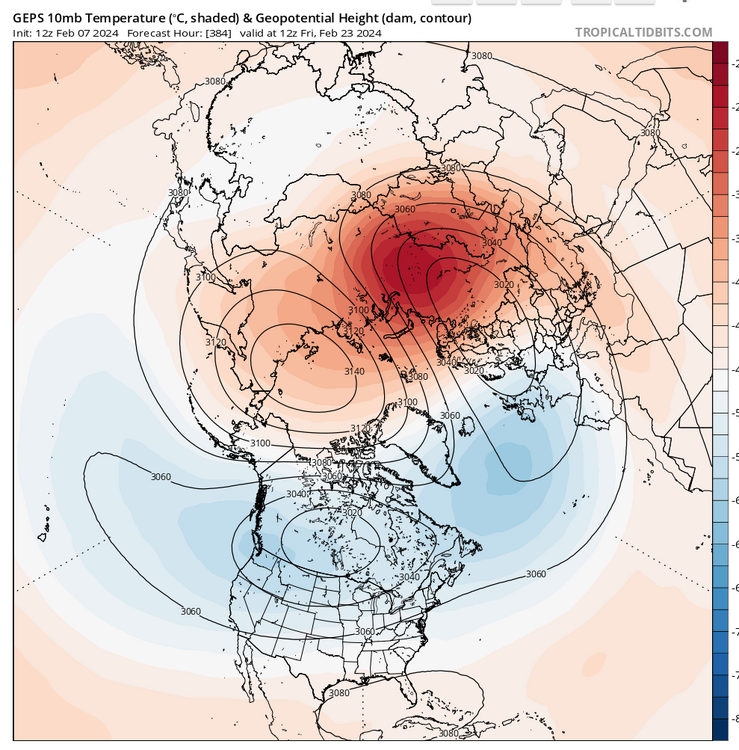
GEPS shows the same thing
-
4
-
-
2 hours ago, weathertree4u2 said:
Could lead to a active severe weather season on into Spring
This looks like a persistent NINO into spring possible early summer,so we in general would see a more early spring than later severe threat,dont mean it can't happen,but the odds of it are reduced
-
4
-
-
-
Mean while in Central and East China
-
2
-
 2
2
-
-
Here was the SOI back into Dec before our cold shot and the SOI today,who know if it turns out as before,surely shouldnt be as cold if it does turn cold
5 Feb 2024 1007.06 1009.90 -36.41 -0.02 -3.85 4 Feb 2024 1008.30 1009.40 -28.05 0.94 -3.66 3 Feb 2024 1007.67 1007.55 -22.19 1.65 -3.51 2 Feb 2024 1006.85 1008.15 -29.01 2.20 -3.36 1 Feb 2024 1007.27 1008.65 -29.40 3.19 -3.02 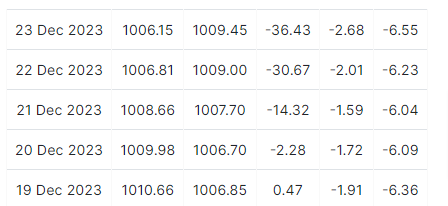
-
1
-
-
25 minutes ago, jaxjagman said:
Just shows the potential for a SSWE
https://ds.data.jma.go.jp/tcc/tcc/products/clisys/STRAT/readme.html
The map you quoted me at is the wind reversal.To be a major SSWE you still need the temps at 10hpa to rise around 25 degrees,this is probably the easiest site to read the temps,there is nothing happening right now as the temps look steady the last couple days
https://ds.data.jma.go.jp/tcc/tcc/products/clisys/STRAT/
.png.93b0367c73a9eadd64b3755cf6a66e03.png)
-
2 hours ago, PowellVolz said:
Explain?
.Just shows the potential for a SSWE
https://ds.data.jma.go.jp/tcc/tcc/products/clisys/STRAT/readme.html
-
2
-
-
7 hours ago, jaxjagman said:
This updates in our afternoon each day.But the ensembles are pretty clustered D5 going back into the WP,then by D10 about to be or getting into the WH so we might have to wait until the last week of Feb to get colder it seems like to me
.png.6ab61a09b71690156fa9803f7c4357fd.png)
The mean has been pretty consistent with bringing the MJO into around phase 8 today and is even just as consistent the last few days with the stopping point.It's having a hard time in the WP.yesterday it was fairly clustered by day 5,not as much today
.thumb.png.68d279d98d9675f5246307a6274b6db2.png)
.png.b76061059f25dfc1f7ee51e4a12d89cc.png)
.png.9ad09b066135a1a9dba1a5e7801a820f.png)
.png.0421a2b2c818f79fe4c75b336995aa11.png)
.png.1a4eafcac6c96e85c4080141921ef27a.png)

.png.9ebd63f2961561b99a9696856d3a9895.png)
.png.84127bd345e639518843da3ead21d6f2.png)
![[Fig. 1]](https://www.cpc.ncep.noaa.gov/products/analysis_monitoring/enso_advisory/figure01.gif)
![[Fig. 2]](https://www.cpc.ncep.noaa.gov/products/analysis_monitoring/enso_advisory/figure02.gif)
![[Fig. 3]](https://www.cpc.ncep.noaa.gov/products/analysis_monitoring/enso_advisory/figure03.gif)
![[Fig. 4]](https://www.cpc.ncep.noaa.gov/products/analysis_monitoring/enso_advisory/figure04.gif)
![[Fig. 5]](https://www.cpc.ncep.noaa.gov/products/analysis_monitoring/enso_advisory/figure05.gif)
![[Fig. 6]](https://www.cpc.ncep.noaa.gov/products/analysis_monitoring/enso_advisory/figure06.gif)
![[Fig. 7]](https://www.cpc.ncep.noaa.gov/products/analysis_monitoring/enso_advisory/figure07.gif)
February 2024 mid/ long range
in Tennessee Valley
Posted
Ripping half dollars,its freaking crazy..lol