NorthShoreWx
-
Posts
5,517 -
Joined
-
Last visited
1 Follower
About NorthShoreWx

- Birthday 02/06/1978
Recent Profile Visitors
9,588 profile views


-
Really cool looking at all the early valley fog burning off from eastern kentucky through central west virginia
-
Nada here so far. I think we'll get enough to keep the lawns happy. Its not like this July has been a dry month on LI.
-
Quick 0.51" from that TS that was warned west of here.
-
Takes all the fun out of golf.
-
655 PM EDT Thu Jul 16 2026 ...A SEVERE THUNDERSTORM WARNING REMAINS IN EFFECT UNTIL 730 PM EDT FOR SOUTHEASTERN OCEAN AND EAST CENTRAL BURLINGTON COUNTIES... At 654 PM EDT, a severe thunderstorm was located over Surf City, or 23 miles south of Toms River, moving southeast at 30 mph. THIS IS A DESTRUCTIVE STORM FOR SHIP BOTTOM AND SURF CITY. HAZARD...80 mph wind gusts and half dollar size hail. SOURCE...Trained weather spotters. At 647 PM EDT, a 85 MPH wind gust was recorded at the Surf City Yacht Club mesonet station. IMPACT...Flying debris will be dangerous to those caught without shelter. Mobile homes will be heavily damaged. Expect considerable damage to roofs, windows, and vehicles. Extensive tree damage and power outages are likely. Locations impacted include... Barnegat, Tuckerton, Surf City, Brookville, Warren Grove, Penn State Forest, Beach Haven West, Manahawkin, Ocean Acres, and Waretown. This includes Garden State Parkway between mile markers 57 and 73. PRECAUTIONARY/PREPAREDNESS ACTIONS... Prepare immediately for large hail and damaging winds. People outside should seek shelter inside a well-built structure and away from windows. Frequent cloud to ground lightning is occurring with this storm, and the storm will affect the beaches. For your safety, immediately move off the beach and seek shelter indoors. Torrential rainfall is occurring with this storm, and may lead to flash flooding. Do not drive your vehicle through flooded roadways.
-
on the bright side, its a great day to work outside (assuming you don't care what happens to your lungs). Apparently smoke blocks UV a lot better than clouds. UV index is near zilch.
-
The air here is now officially disgusting.
-
Mark Twain was right. Two 100° days in a row at the end of last week and two days in a row with a max of 68° to start this week. 65.8 now and the wind feels a bit chilly. I think we may end with a heating degree day today.
-
Meanwhile, Fairfield and New Haven counties are getting rather drowned. Temp here is only 64° 2.88" rain since midnight , 2.99" storm total, 3.55" since the 4th. Still raining.
-
2.17" here since midnight (as of 1:40 pm). 2.84" total since the 4th. The lawn is happy and the current temperature of 66° is a big improvement.
-
Well that was quite the interruption. Had to take down tents and bring the bar in in a hurry.
-
I remember baking in the 90s Austin in March. At least the evenings were a little better at that time of year. Min this morning was 76. 97 now. I mowed the lawn in the backyard this morning while it was still in the shade, but the temp was already up to 90.
-
Good thing the water temperatures saved us today.
-
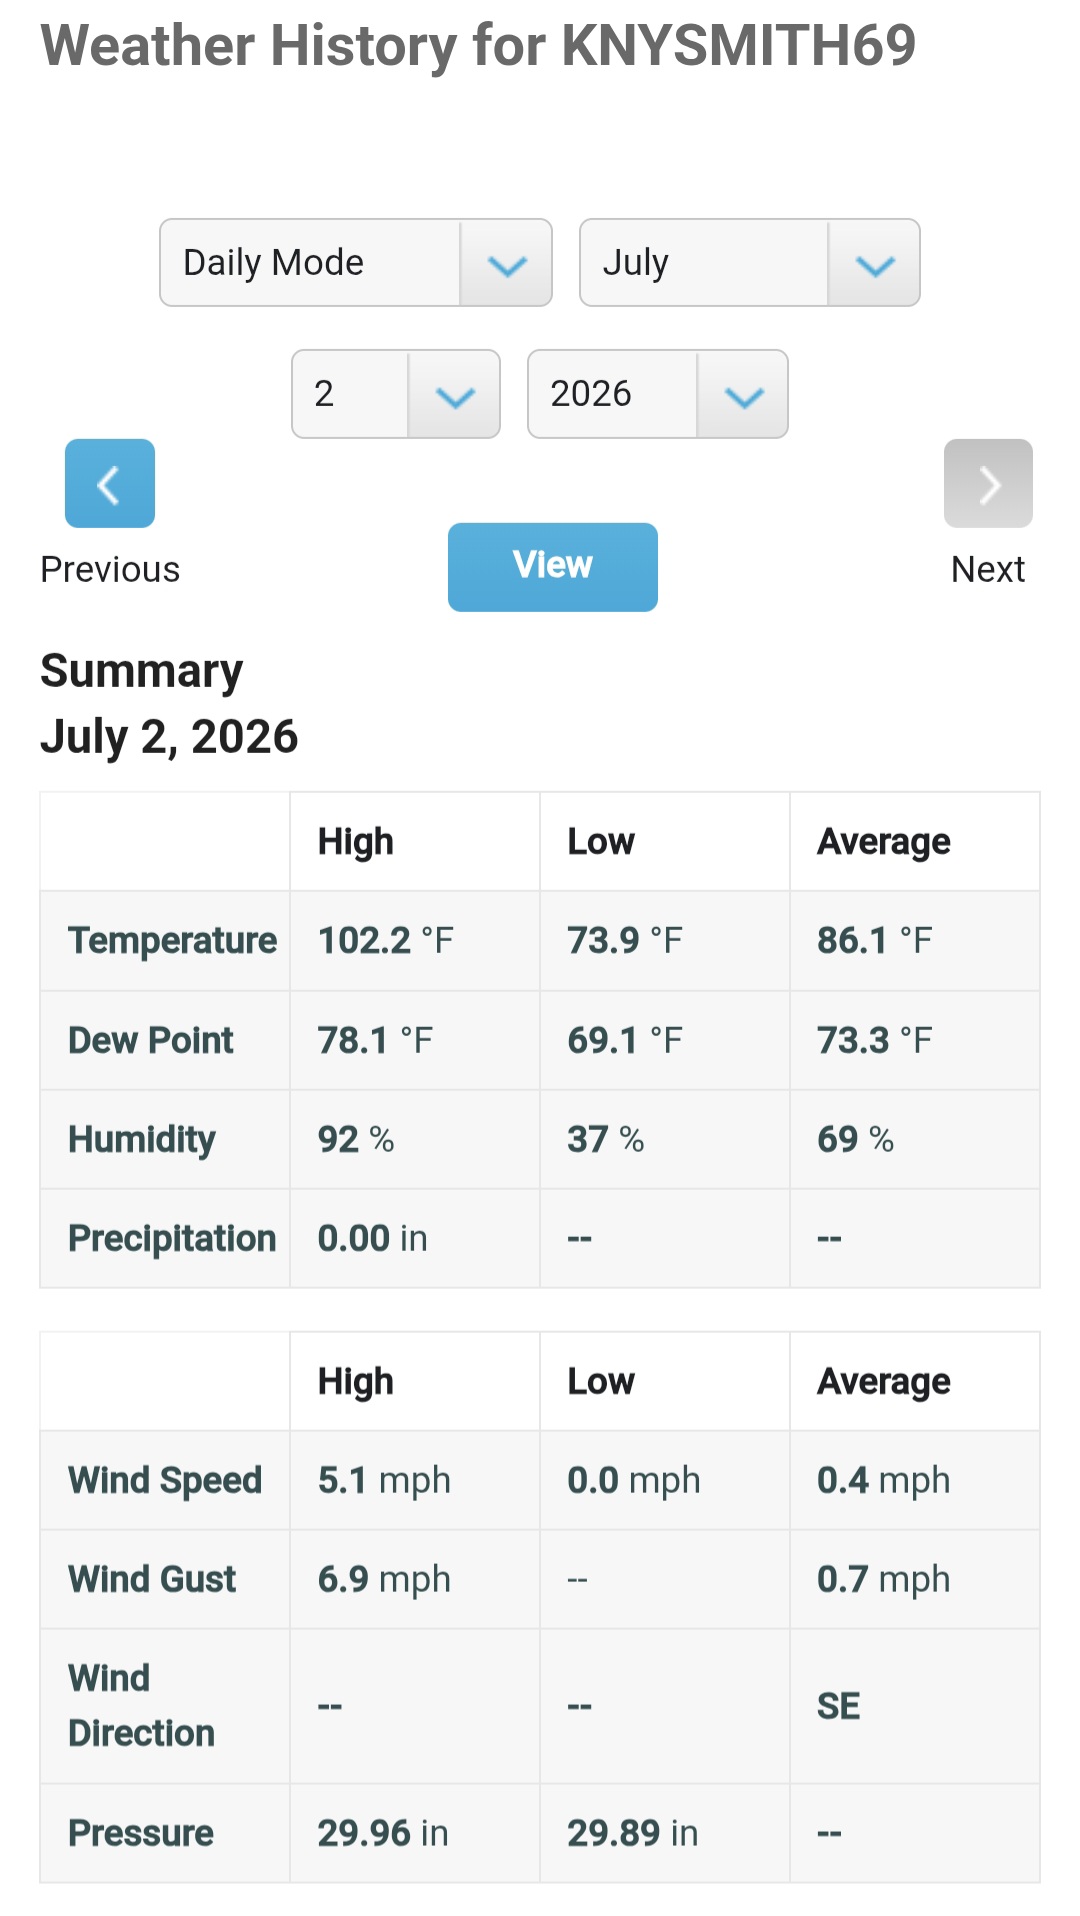
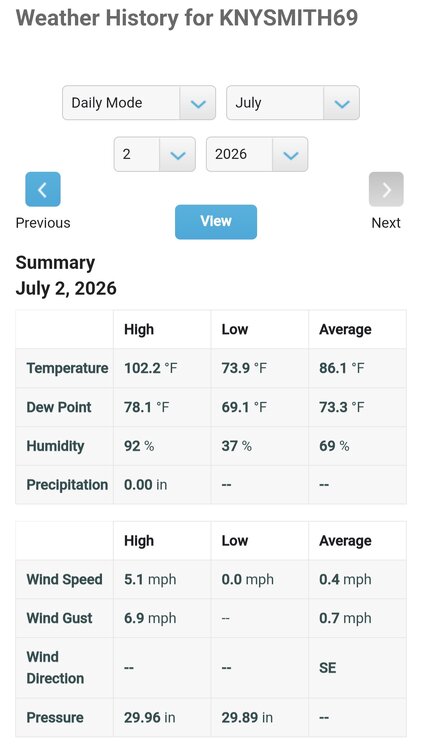
1:36 pm. Just hit 100.0 here.
-
Heatwave here: June 30 64 90 July 1 68 91 0.53" This morning's low was 74. Up to 85 shortly before 9am. Point and click warmer again with Friday at 101⁰