Bob Chill
-
Posts
36,386 -
Joined
Content Type
Profiles
Blogs
Forums
American Weather
Media Demo
Store
Gallery
Everything posted by Bob Chill
-

Richmond Metro/Hampton Roads Area Discussion
Bob Chill replied to RIC Airport's topic in Mid Atlantic
Hi res mesos aren't doing well in the short range imo. It's snowing here right now by smith mtn lake right now and fcx shows a decent shield deep into swva. It's still light snow but heavier than flurries. 3k nam and hrrr show nothing like that Mesos are jumping all over the place every 6 hours while the globals like the gfs/euro have been pretty steady with their qpf forecasts last 3 runs. If I lived over by RIC I'd stick with what the globals are showing then pay attention tomorrow in real time as to where the banding sets up. -
Richmond Metro/Hampton Roads Area Discussion
Bob Chill replied to RIC Airport's topic in Mid Atlantic
-
The Jan 31 Potential: Stormtracker Failure or 'Tracker Trouncing
Bob Chill replied to stormtracker's topic in Mid Atlantic
Light snow falling down here. Not much virga. Radar returns are light but it's making it to the ground. Not expecting much. 1-3 or something like that. -
The Jan 31 Potential: Stormtracker Failure or 'Tracker Trouncing
Bob Chill replied to stormtracker's topic in Mid Atlantic
I'd say you're good. 29 or 81 are always taken care of. Main roads in NC get brined like the dmv. Side streets are last in line or ignored completely in rural areas but not main roads -
The Jan 31 Potential: Stormtracker Failure or 'Tracker Trouncing
Bob Chill replied to stormtracker's topic in Mid Atlantic
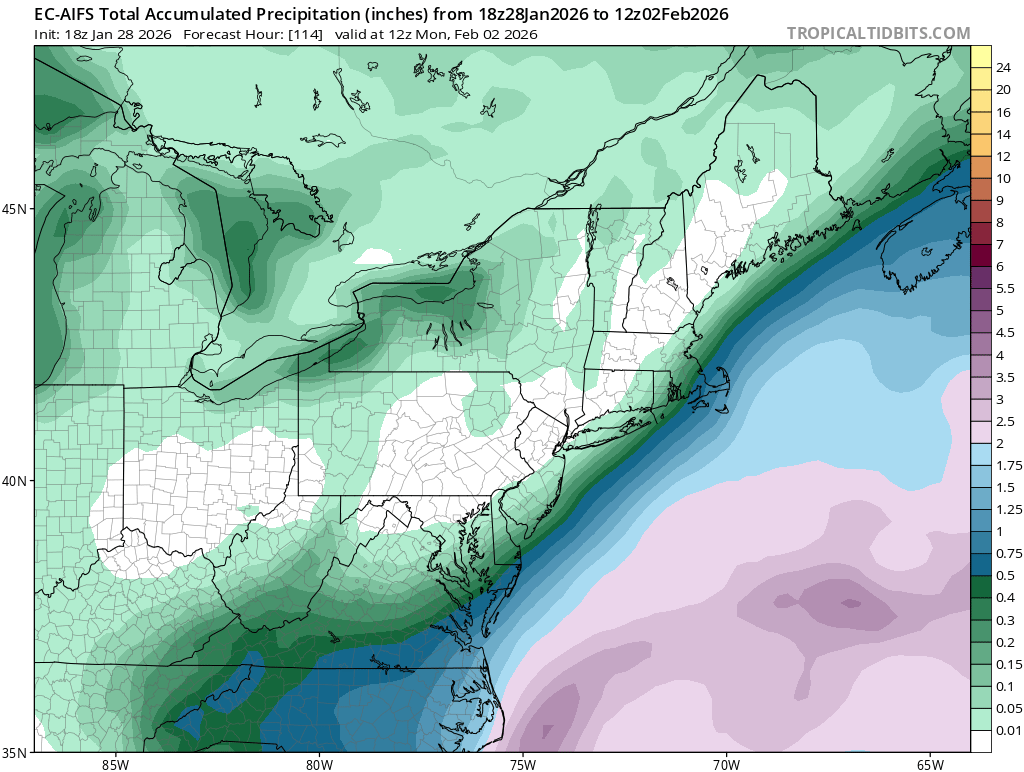
Point Lookout gets a couple inches. I wish the whole shield could bump 75mi NW but the clock has prob run out on those kinds of changes. I'm pretty skeptical of the euro run for my yard even though it looks good on the map.
-
Euro op just took a sledge hammer and pounded it flat lol. Good times!
-
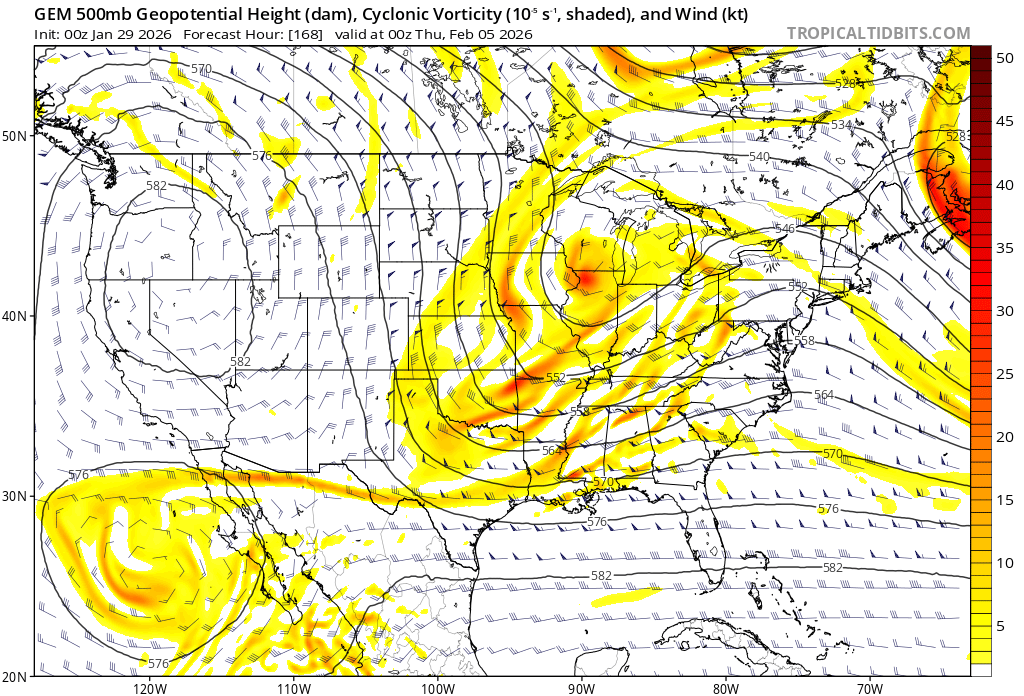
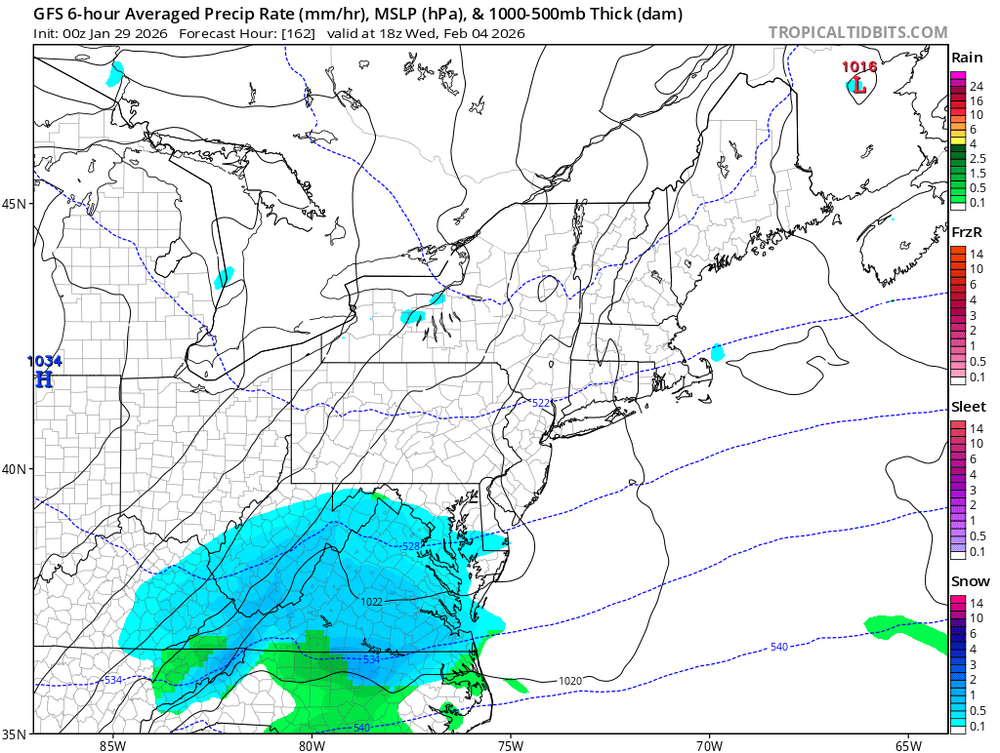
Positive tilt doesn't do us any favors but we're in trending phase. Every suite shows the shortwave digging further south. Which is the most important piece because having a low track overhead isn't going to work. The current -AO tank wasn't modeled well so it makes sense that this is trending further south. It also has a gulf connection so moisture can be tapped well west of us. It's very unlikely to morph into a significant event but it has potential for something modest. Like .25-.50 qpf all snow or something like that. Nothing else worth watching rn so it's all we got.
-
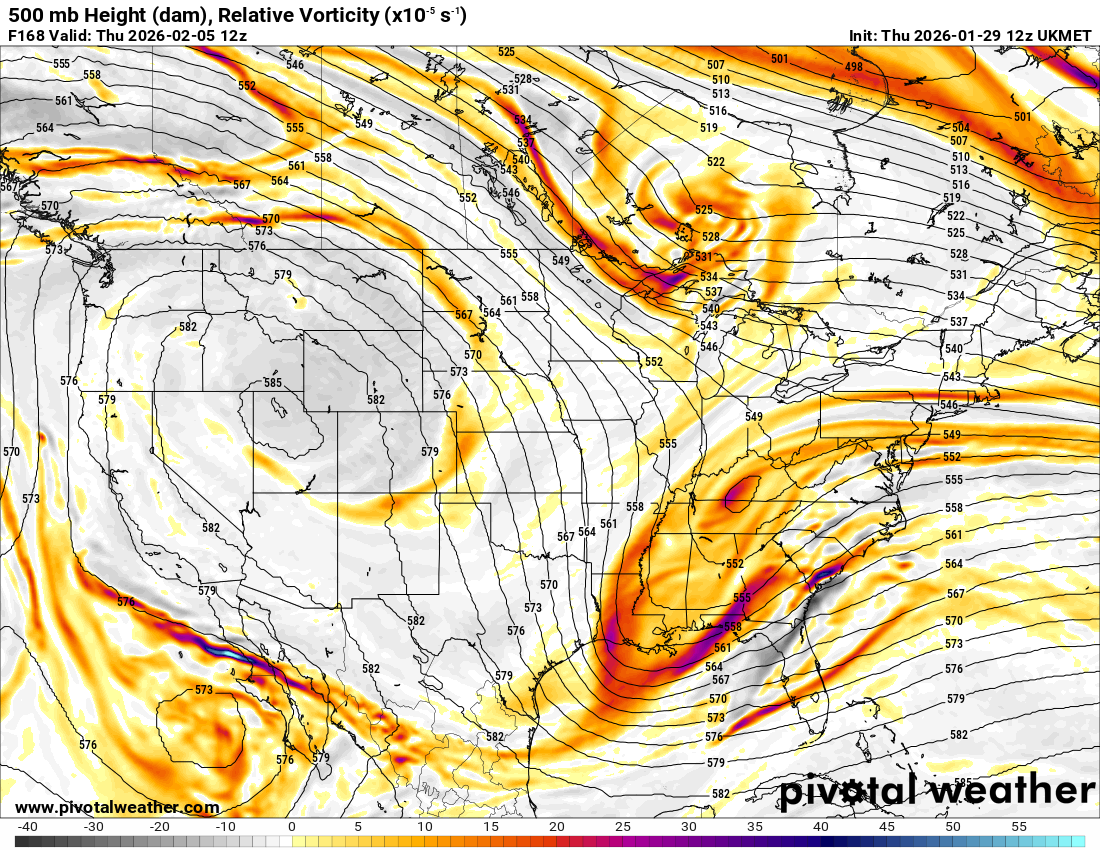
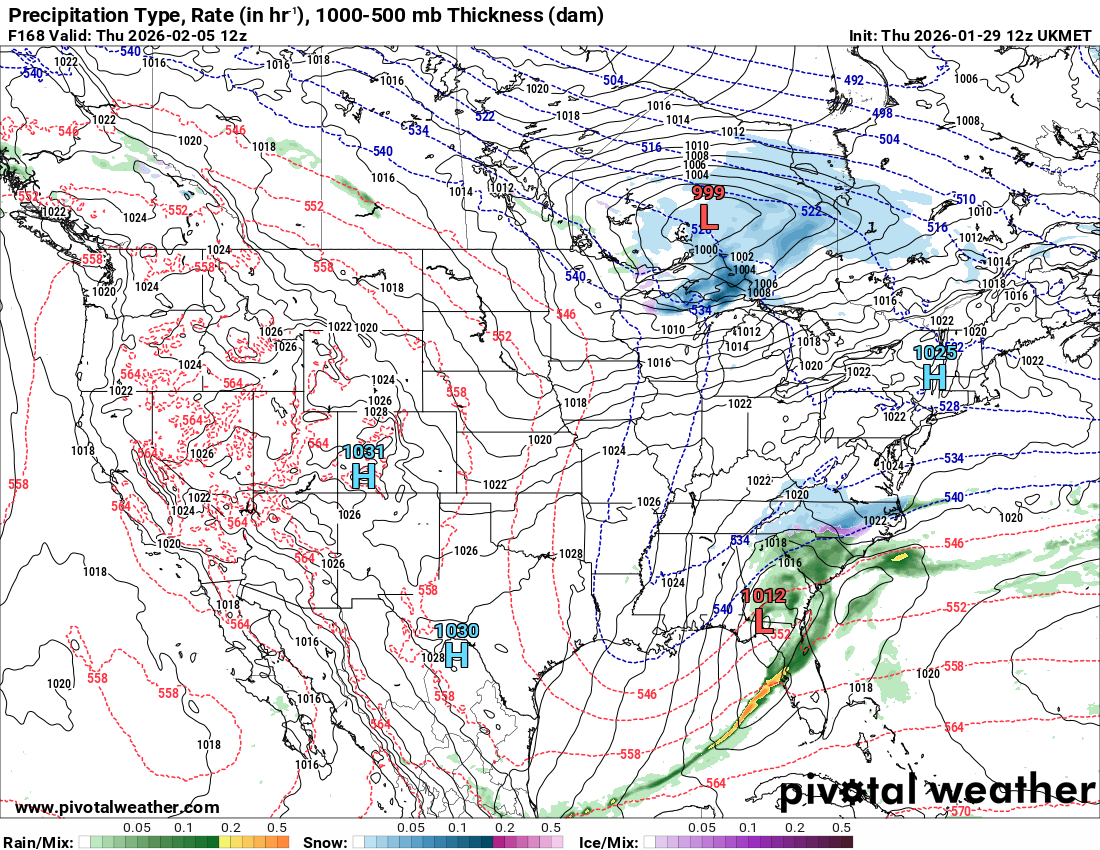
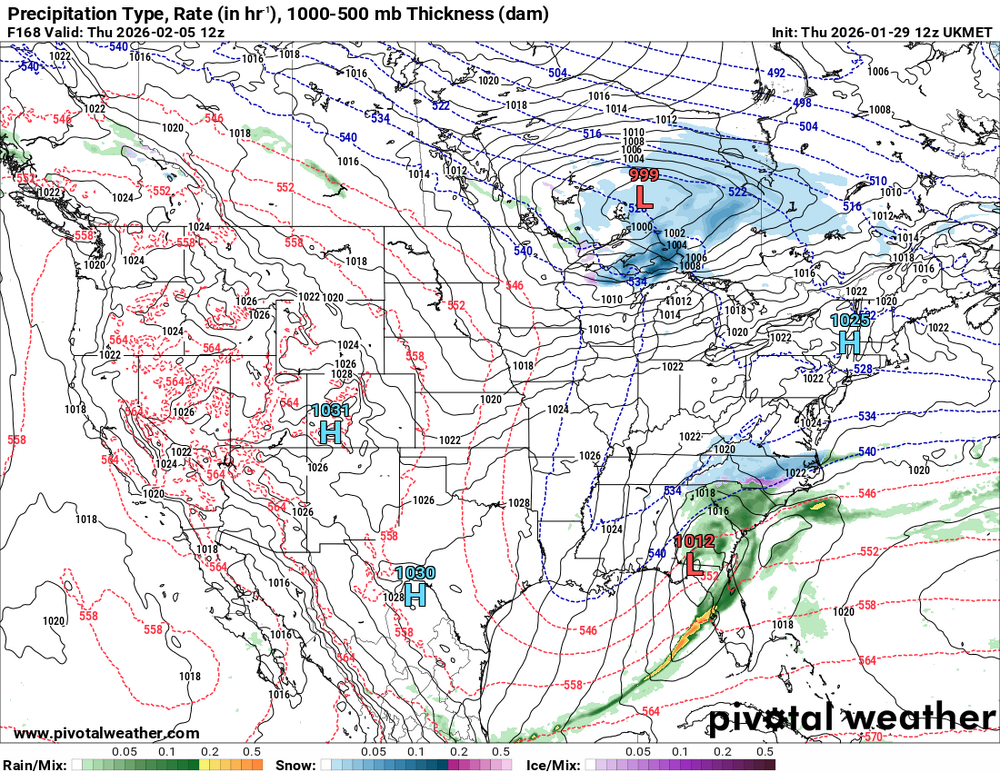
Ukie's version of next week has a dominant southern shortwave. Nothing is resolved and there is potential for this to become something more interesting than a messy temp problem frontal passage

-
The Jan 31 Potential: Stormtracker Failure or 'Tracker Trouncing
Bob Chill replied to stormtracker's topic in Mid Atlantic
Over the last 10-15 years of sref observation, the only thing the SREF has been useful for is giving unrealistic hope when there is little. I'm feeling pessimistic down here. Blacksburg is calling for 4-8" and I'm feeling under 3 -
The Jan 31 Potential: Stormtracker Failure or 'Tracker Trouncing
Bob Chill replied to stormtracker's topic in Mid Atlantic
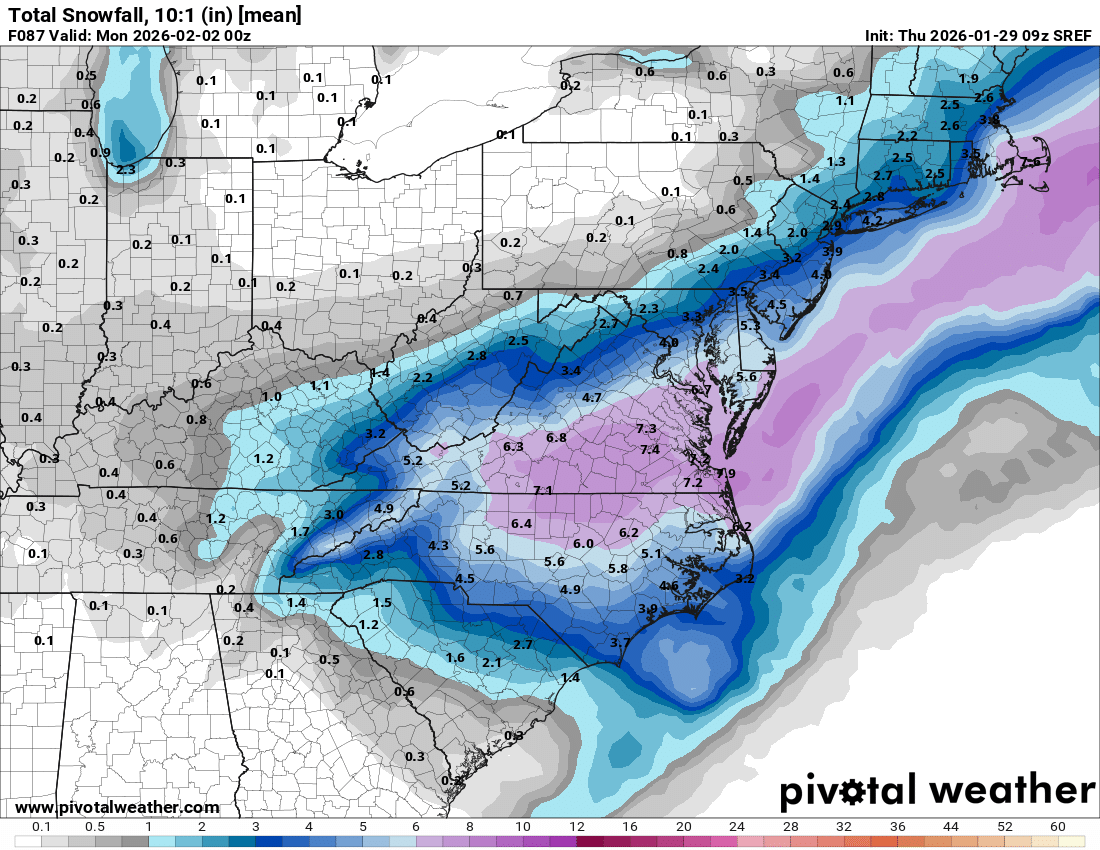
SREF tossing a bone lol
-
Shortwave is across guidance and it has a gulf/baja connection but it's not impressive for now. Run of the mill but has trended towards a better pass underneath us. Cmc has it and h5 looks half decent

-
Under 7 days away
-
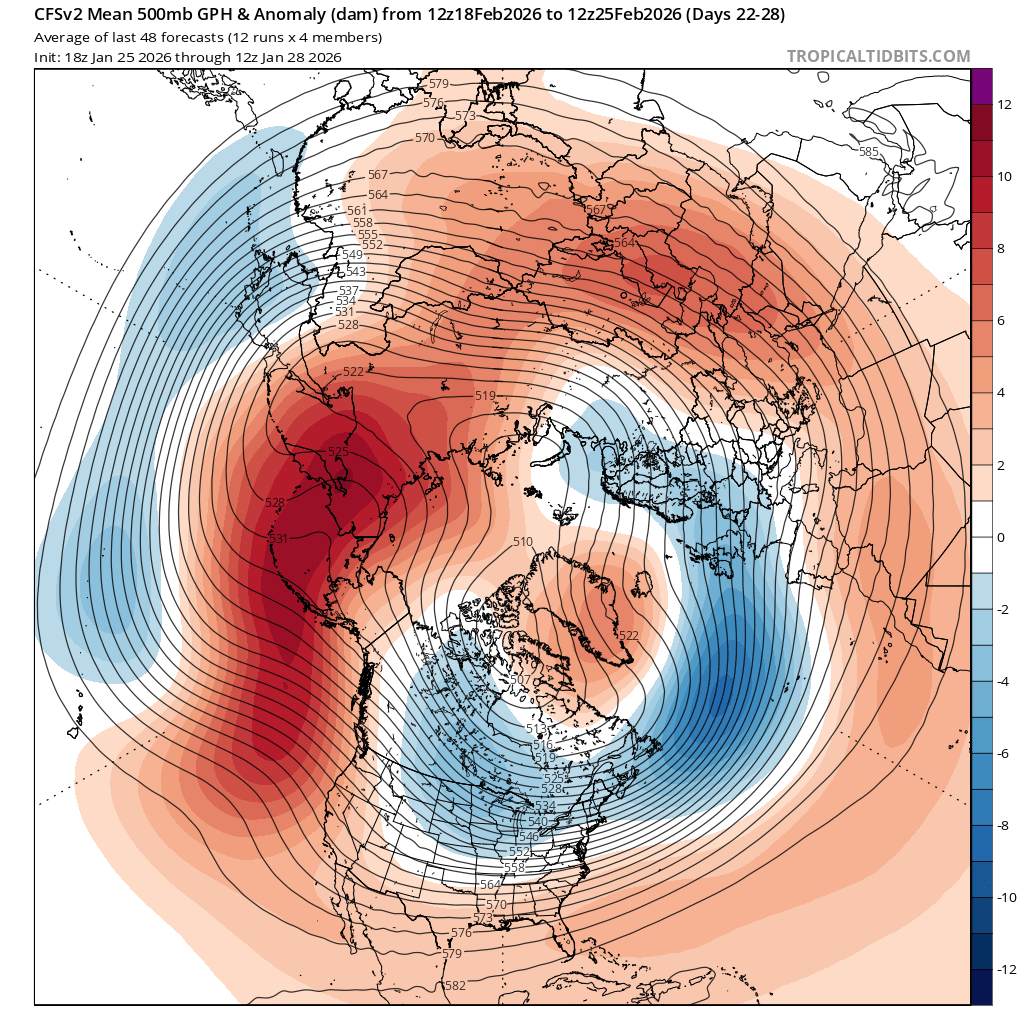
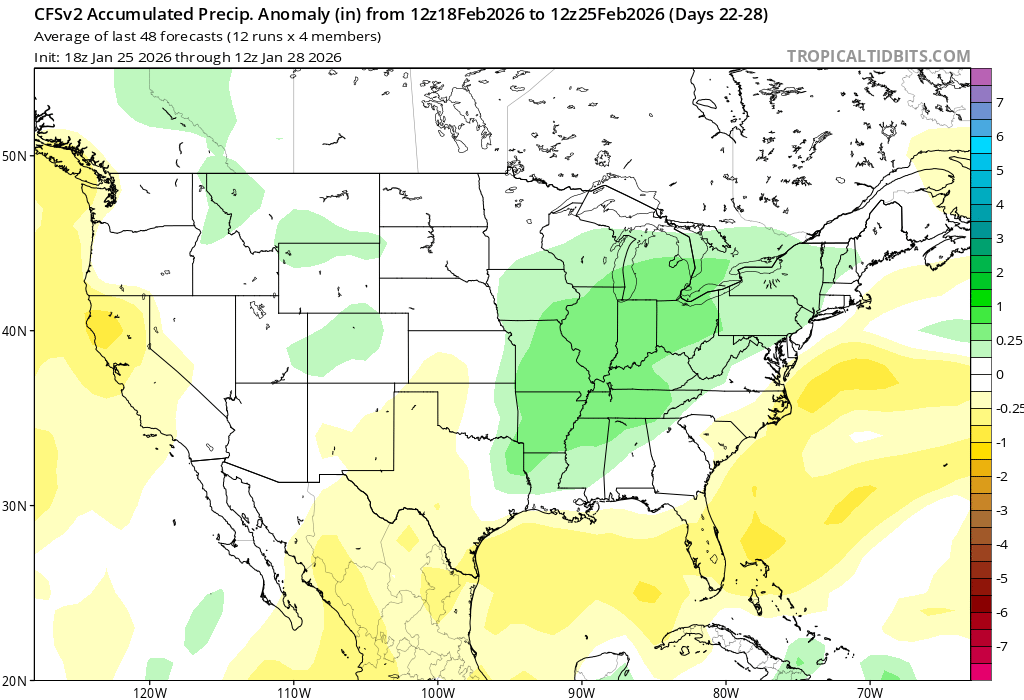
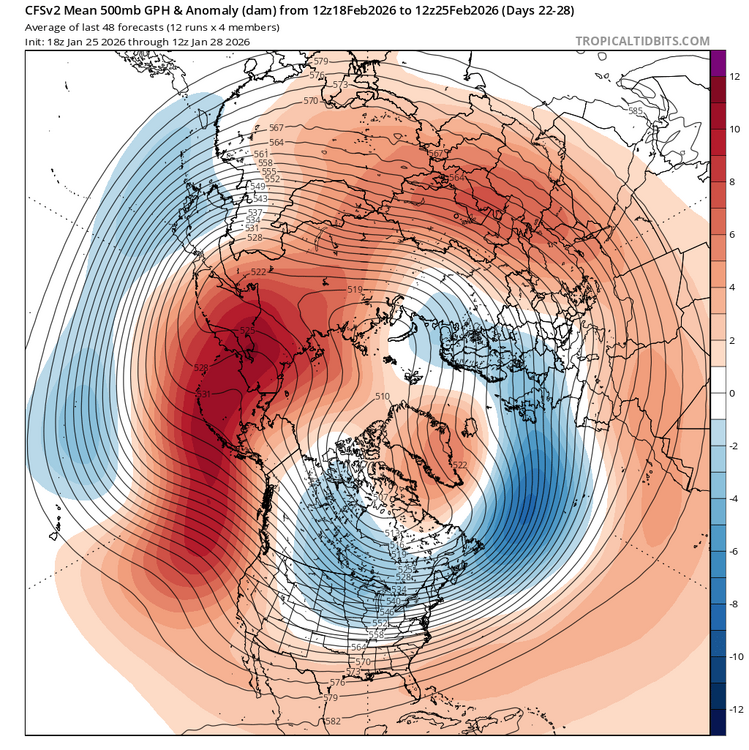
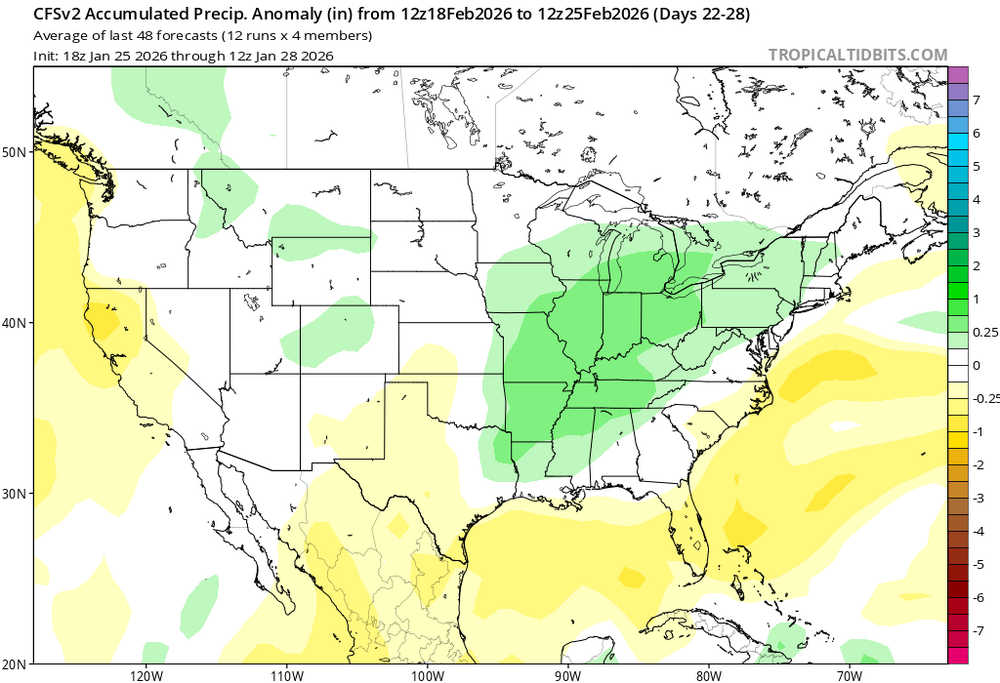
I like that general LW pattern a lot. Precip isn't usually a problem unlike an amplified +pna/-epo pattern with the ridge axis over the west conus. The pna/epo pattern is colder but it difficult to get moisture laden storms. Lots of fronts and high-pressures without big synoptic systems. The pattern in your post has multiple ways for some juice in the system. I've been casually watching the cfs weeklies and they've been looking tasty for the second half of Feb for at least the past week. Similar to what you posted just 2 weeks later:
-
The Jan 31 Potential: Stormtracker Failure or 'Tracker Trouncing
Bob Chill replied to stormtracker's topic in Mid Atlantic
I wish weather worked that way lol but ma nature on has one way of doing things... like it or not, you get what you get and that's that... lol My climo down here is a mix of the MA and SE. There are several setups that aren't all that uncommon where my yard and the DMV gets all snow in the same similar range. I'll mix or rain a lot more but I'm looking really forward to the first clean decent sized event where we celebrate together. It'll happen. Just a matter of when. -
The Jan 31 Potential: Stormtracker Failure or 'Tracker Trouncing
Bob Chill replied to stormtracker's topic in Mid Atlantic
3-6 idea down here still hanging on.... I want this to hit the DMV as much as you folks in the dmv but gotta root for the back yard too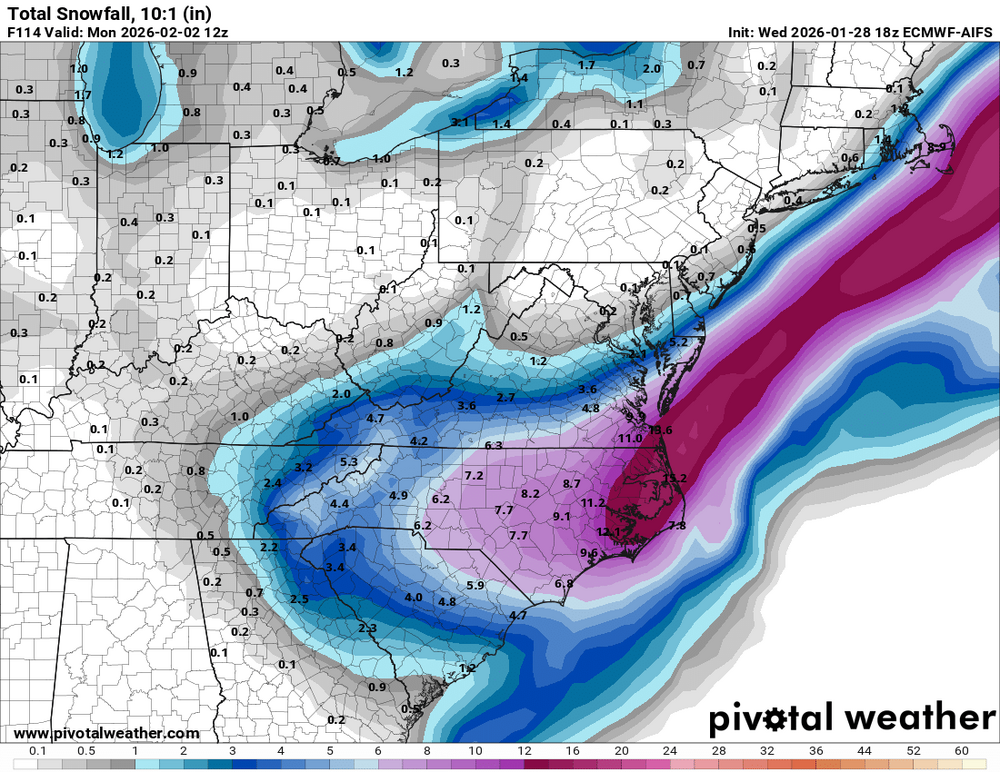
-
The Jan 31 Potential: Stormtracker Failure or 'Tracker Trouncing
Bob Chill replied to stormtracker's topic in Mid Atlantic
Not sure how much things can shift with the time left but euro AI made a notable jump NW....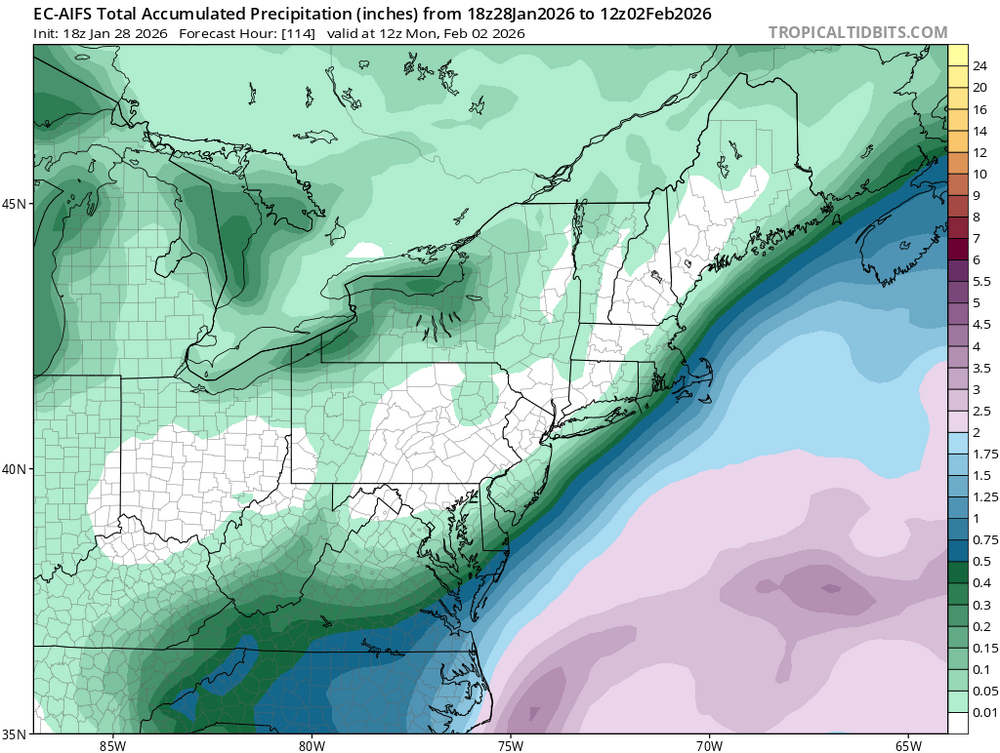
-
The Jan 31 Potential: Stormtracker Failure or 'Tracker Trouncing
Bob Chill replied to stormtracker's topic in Mid Atlantic

-
The Jan 31 Potential: Stormtracker Failure or 'Tracker Trouncing
Bob Chill replied to stormtracker's topic in Mid Atlantic
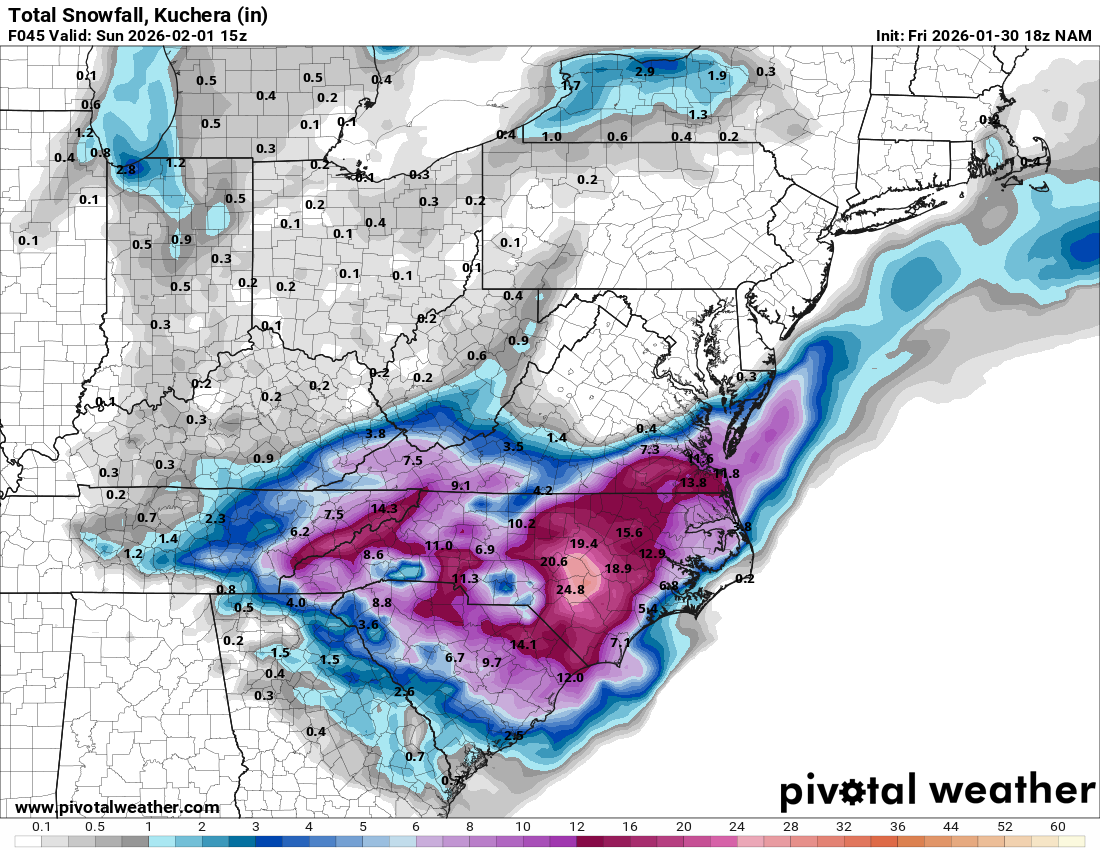
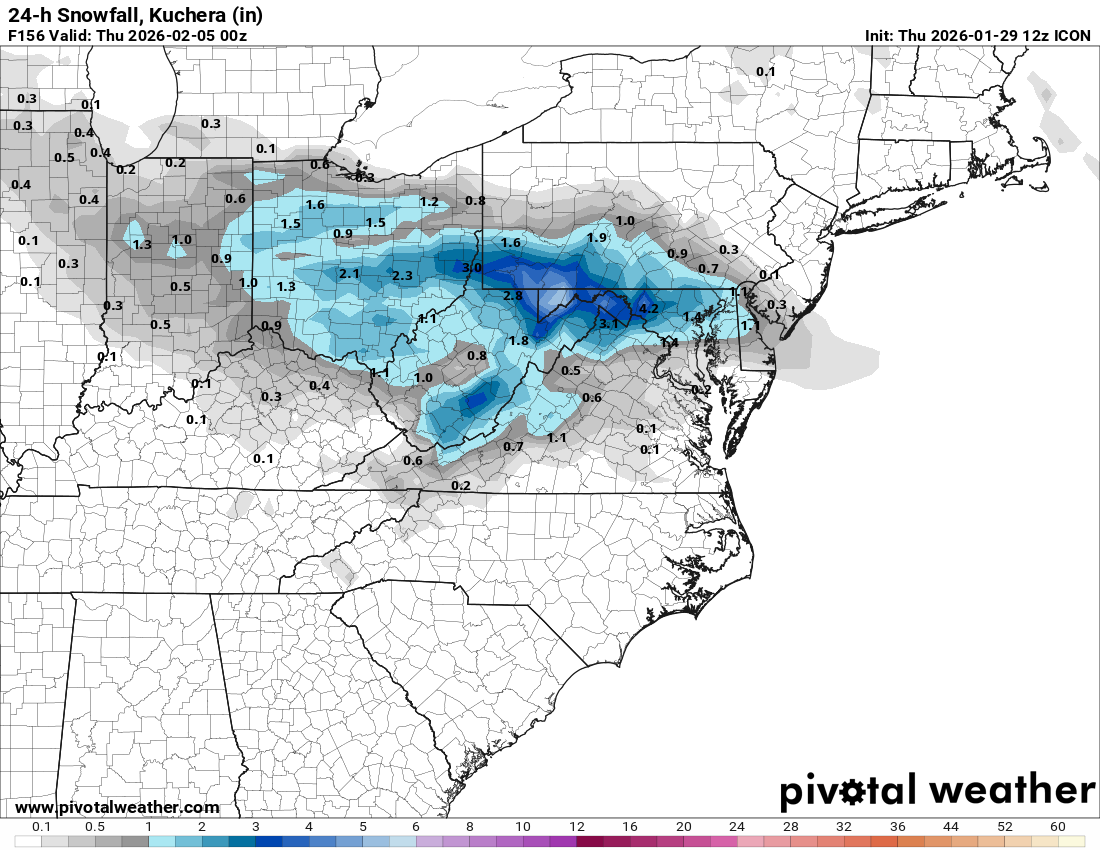
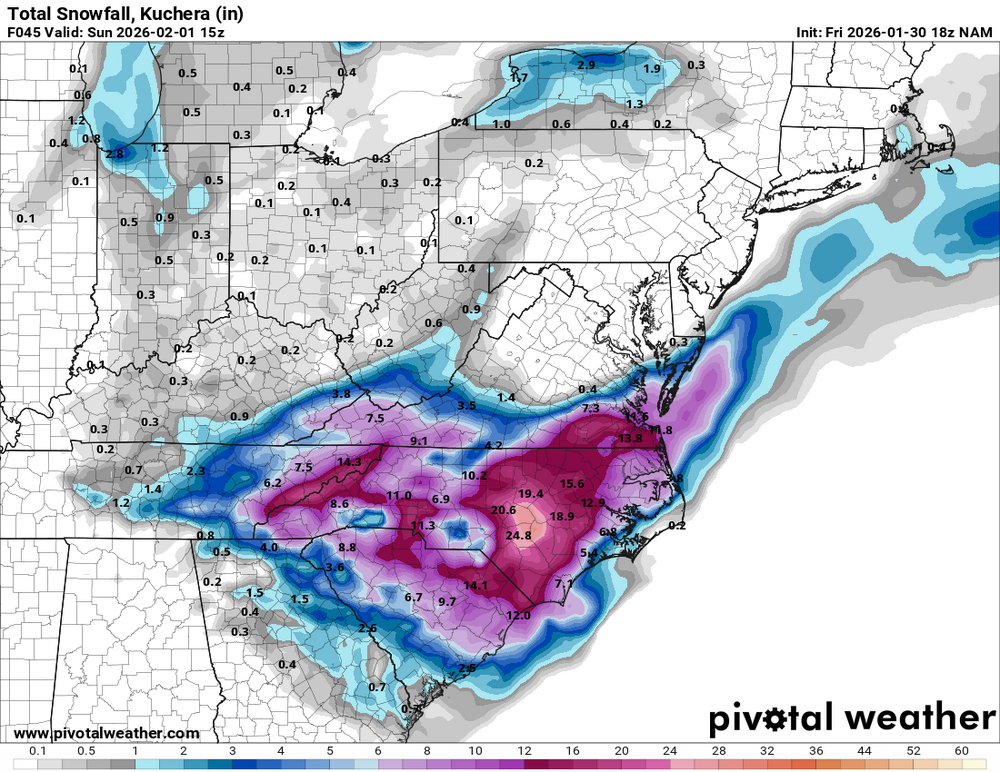
Not a model I like to hang my hat on with qpf but I'd be thrilled with the 12k nam's idea. Extrapolated 3k was decent too lol -
The Jan 31 Potential: Stormtracker Failure or 'Tracker Trouncing
Bob Chill replied to stormtracker's topic in Mid Atlantic
I never bought it. I entertained it but nothing moved in that direction so it felt like a phantom. Of course I want it to be right but we've played this game a long time. I still see a relatively easy path to a 3-6/4-8 event and wont stop tracking that potential. We'll see how the next couple suites go... -
The Jan 31 Potential: Stormtracker Failure or 'Tracker Trouncing
Bob Chill replied to stormtracker's topic in Mid Atlantic
Still barely hanging on to the 3-6" idea down this way. Plenty of time to tick to zero tho -
The Jan 31 Potential: Stormtracker Failure or 'Tracker Trouncing
Bob Chill replied to stormtracker's topic in Mid Atlantic
Ai total qpf. ULL is south of Atlanta lol -
The Jan 31 Potential: Stormtracker Failure or 'Tracker Trouncing
Bob Chill replied to stormtracker's topic in Mid Atlantic
Euro ai a tick weaker and further south. At odds with the gfs in a pretty big way at this point -
The Jan 31 Potential: Stormtracker Failure or 'Tracker Trouncing
Bob Chill replied to stormtracker's topic in Mid Atlantic
Probably the same but higher chance of coastal influence so your boom scenario is better than me and buddy. This is tricky and I don't have much confidence one way or the other. Everything has to go right for a boom so I'll reserve that excitement for the short range -
The Jan 31 Potential: Stormtracker Failure or 'Tracker Trouncing
Bob Chill replied to stormtracker's topic in Mid Atlantic
Because the trough is swinging like a pendulum, slp organizes when trough is pretty positive so having slp way out in front does make sense in this case