TheClimateChanger
-
Posts
3,595 -
Joined
-
Last visited
Content Type
Profiles
Blogs
Forums
American Weather
Media Demo
Store
Gallery
Everything posted by TheClimateChanger
-
Pittsburgh, Pa Summer 2024 Thread.
TheClimateChanger replied to meatwad's topic in Upstate New York/Pennsylvania
Morgantown topped out at 94F, ending its streak of 95+ days at 3. That was the longest streak since the 5-day streak ending on August 3, 1995. There were two other occurrences of consecutive 95+ days since then, both of which occurred in 2012 - June 28 & 29, 2012 and July 6 & 7, 2012. Clarksburg, West Virginia reached 98F yesterday and 96F today. The 98F reading was the highest since August 21, 1983, when it also reached 98F. It is the first time in the threaded record with consecutive days of 96F or better since June 26 & 27, 1969. -
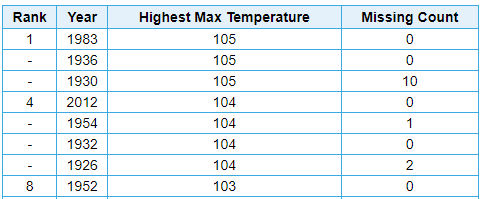
Elkins, West Virginia reached at least 96F today [elevation: ~2000 feet]. The last time it was hotter was July 16, 1988, when the temperature climbed to 99F. The only other hotter days in the threaded record are September 3, 1953 (97F), August 6, 1918 (99F), August 7, 1918 (98F), and August 11, 1911 (97F).
-
Clarksburg, West Virginia reached 96F today before thunderstorms brought daytime warming to a quick stop. Yesterday's 98F was the hottest day since August 21, 1983. This is the first time two consecutive days of 96F+ has been observed in the Clarksburg area since June 26 & 27, 1969.
-
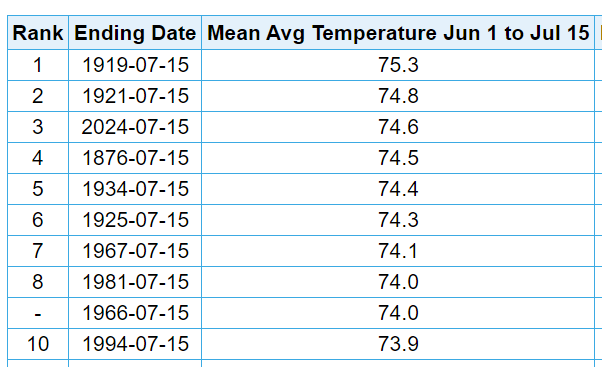
Pittsburgh, Pa Summer 2024 Thread.
TheClimateChanger replied to meatwad's topic in Upstate New York/Pennsylvania
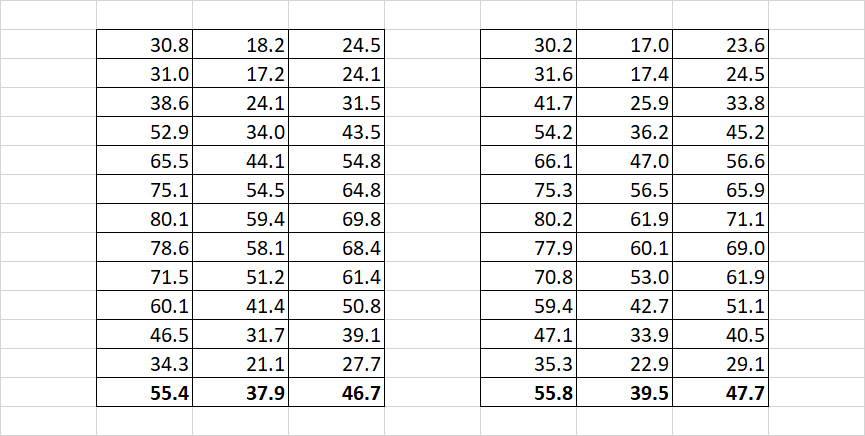
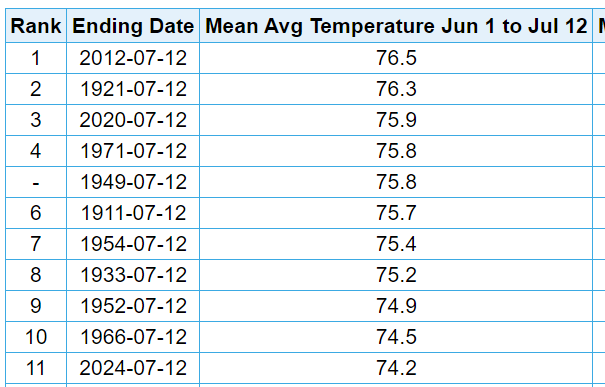
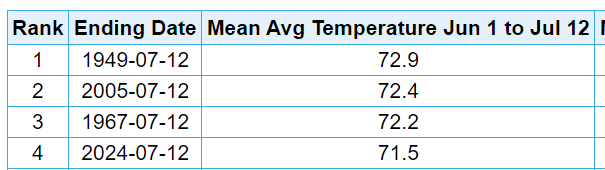
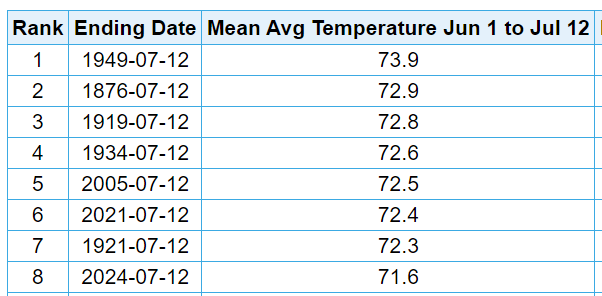
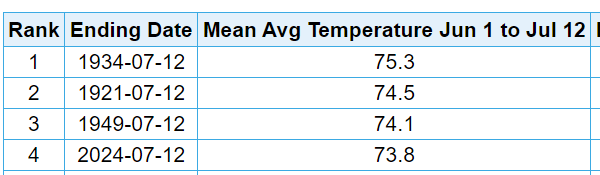
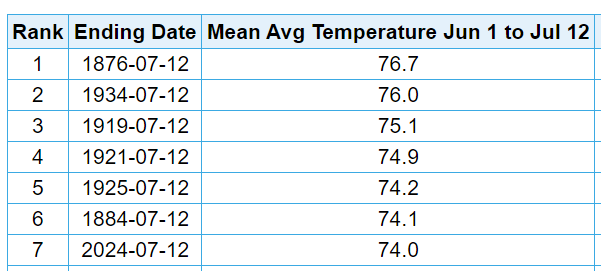
Notably warm first half of summer. Easily the warmest on record at the airport, besting 1994 by nearly 1F. Officially, sixth in the threaded record... although I'm a little skeptical of these 19th century summertime readings. 3rd warmest in the Morgantown Area thread. A lot of the same years show up. Seems to agree 1876 was a hot first half of summer, but not to the tune of nearly 2.5F warmer than this year. 1892 was tossed due to missing the entire month of June.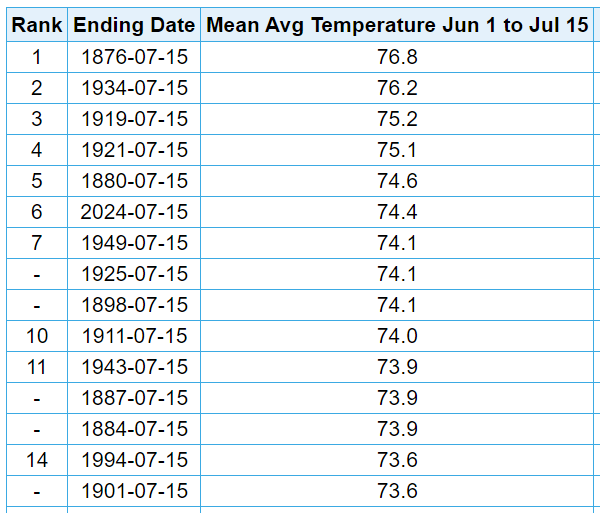
-
2024-2025 La Nina
TheClimateChanger replied to George001's topic in Weather Forecasting and Discussion
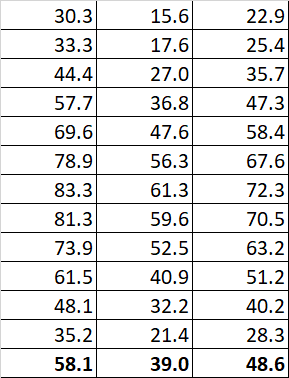
Also the concept of a 30-year climatological normal wasn't in widespread practice until the late 1940s. If we look at earlier years, the departures were simply calculated from the long-term means. In 1940, these were the 60-year means for Detroit [mostly from the city office] used to calculate departures from normal. If we look strictly at the progression of the annual normal mean at Detroit Metro Wayne Airport, we find the following: 1931-1960: 48.9F 1941-1970: 49.1F 1951-1980: 48.6F 1961-1990: 48.6F 1971-2000: 49.7F 1981-2010: 50.3F 1991-2020: 50.6F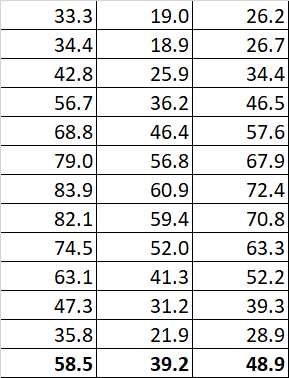
-
2024-2025 La Nina
TheClimateChanger replied to George001's topic in Weather Forecasting and Discussion
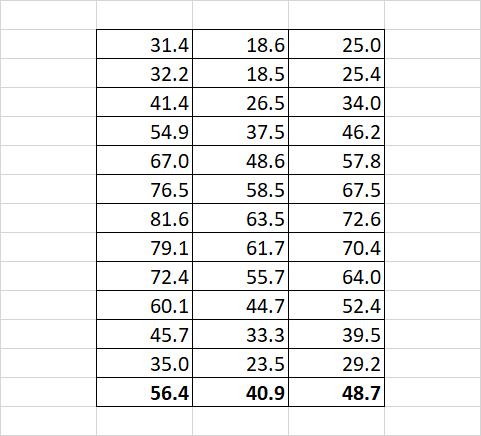
Normals for Boston Logan Airport 1931-1960 on the left, 1961-1990 on the right And for Buffalo Niagara Airport: As you can see, at Boston, winters were only slightly cooler in the 1961-1990 normals versus the 1931-1960 normals. At Buffalo, the winters were actually warmer in the 1961-1990 normals versus the 1931-1960 normals.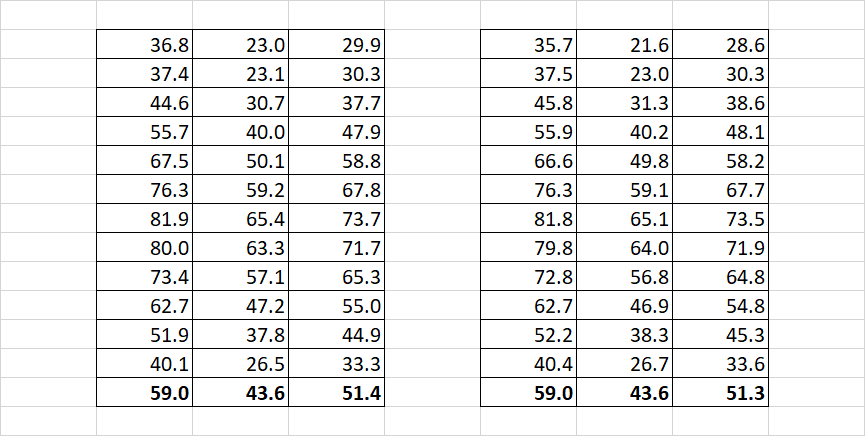
-
2024-2025 La Nina
TheClimateChanger replied to George001's topic in Weather Forecasting and Discussion
Not as much as you might like to think. The normals were corrected for location and site exposure and not just averages of records from various locations. From what I could glean from the Local Climatological Data publications, the normals for each site were as follows: Detroit Metropolitan Wayne Airport 1931-1960 [1967 revision, after it became the official climate site in 1966] 1961-1990 So yeah, it was quite a bit colder during the winter, but there were seasonal variations. Spring was warmer in the 1961-1990 normals, and summer pretty similar. Fall was fairly similar but with some interesting ups [November] and downs [October].
-
Pittsburgh, Pa Summer 2024 Thread.
TheClimateChanger replied to meatwad's topic in Upstate New York/Pennsylvania
97F at Morgantown, hottest since July 7, 2012. -
2024-2025 La Nina
TheClimateChanger replied to George001's topic in Weather Forecasting and Discussion
And how many of these winters would be cooler than the 1961-90 normals? -
Not even under a heat advisory.
-
-
Wow, 103F at Roanoke, Virginia, as of 4 pm.
-
Wow, that's pretty hot for 2500 feet. 93F (at least) at Elkins, WV (approx. 2000'). The AWOS at Garret County Airport (approx. 3000') was as high as 88F, but only reports every 15 minutes.
-
If you take the airmass over West Virginia, and descend it to sea level tomorrow, could see some 102-106F readings, I suspect.
-
Pittsburgh, Pa Summer 2024 Thread.
TheClimateChanger replied to meatwad's topic in Upstate New York/Pennsylvania
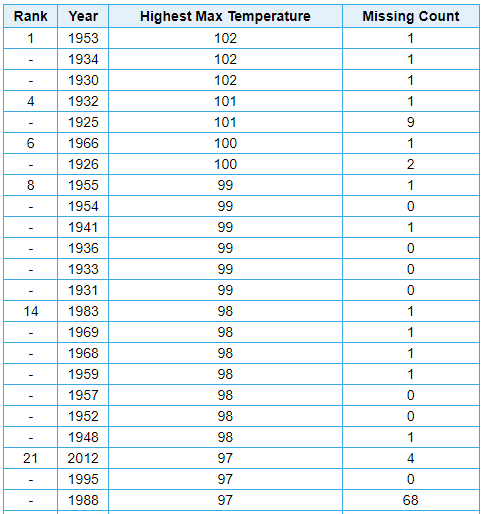
Just south of the Pittsburgh CWA, Clarksburg, West Virginia (KCKB) has reached at least 98F. That is the hottest reading there since August 21, 1983. It reached 97F in 1988, 1995 & 2012. -
Clarksburg, West Virginia up to 98F on the most recent hourly observation. That is the hottest reading there since 1983! It reached 97F in 1988, 1995 & 2012.
-
Pittsburgh, Pa Summer 2024 Thread.
TheClimateChanger replied to meatwad's topic in Upstate New York/Pennsylvania
It could always be a LOT worse. -
Pittsburgh, Pa Summer 2024 Thread.
TheClimateChanger replied to meatwad's topic in Upstate New York/Pennsylvania
96, maybe 97 at AGC. -
Pittsburgh, Pa Summer 2024 Thread.
TheClimateChanger replied to meatwad's topic in Upstate New York/Pennsylvania
Same. I've had barely more than a tenth of an inch so far in July, and only about 2-1/2" since June 1. -
Pittsburgh, Pa Summer 2024 Thread.
TheClimateChanger replied to meatwad's topic in Upstate New York/Pennsylvania
0.45” of rain earlier this morning at PIT, 0.31” of which fell in 5 minutes. Nothing IMBY so far. -
Pittsburgh, Pa Summer 2024 Thread.
TheClimateChanger replied to meatwad's topic in Upstate New York/Pennsylvania
Heat hanging around tough today. Still 91 at 7 pm. -
Summer 2024 Medium/Long Range Discussion
TheClimateChanger replied to Chicago Storm's topic in Lakes/Ohio Valley
I guess we have to pretend a top 15-20 warmest start to the season is "so cool" because it doesn't actually get "cool" anymore. Meanwhile large portions of the east and west coasts are having their hottest summers on record, certainly top 5. Should be one of the hottest summers on record in recorded U.S. history. I mean the numbers above are with a mean trough over the upper Midwest. Just imagine the numbers 2024 could produce with a mega ridge over these same areas. -
Summer 2024 Medium/Long Range Discussion
TheClimateChanger replied to Chicago Storm's topic in Lakes/Ohio Valley
Except it hasn't been cool, it's been one of the hottest starts to summer in the lifetime of most of the posters here. The "refreshing" crowd is mostly trolling or revisionist history. This is in advance of a significant heat wave that looks to last through Tuesday... Cleveland - ninth warmest to date, less than a degree from second place. Since 1952, only 2005 & 2012 have been warmer. Chicago - 11th hottest start to summer on record. Since 1971, only 2012 & 2020 have been hotter. Literally one of the hottest summers in the lifetime of that troll @A-L-E-Kbut we're supposed to pretend it's nice and refreshing. Midway (KMDW) even hotter at 75.6F. Some other climate sites with long PORs. Many of these sites have multiple recent years higher, so prior to 2010, a lot of these rankings would have been several spots higher. Detroit: 20th warmest Akron/Canton: 13th warmest Mansfield, Ohio: 13th warmest Toledo: 19th warmest Lansing, Michigan: 24th warmest [records date to 1863] Saginaw, Michigan: 14th warmest Columbus, Ohio: 16th warmest [since 1949, only 1991, 1999, 2012 & 2020 hotter] Milwaukee: 14th warmest Rockford, IL: 13th warmest The Toronto crowd keeps saying it's not been too bad, but if we look at the data from the eastern Lakes region, we can see it's one of the hottest summers ever observed - certainly in recent memory. Buffalo, New York Erie, Pennsylvania Wheeling, West Virginia Pittsburgh, Pennsylvania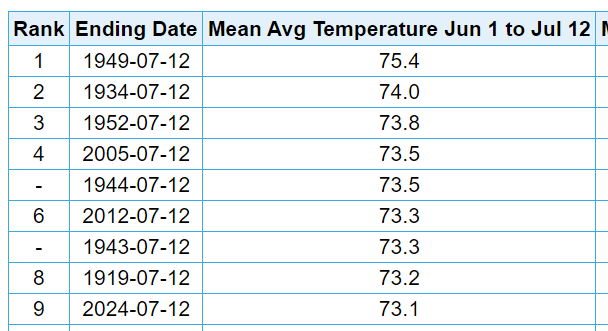
-
Pittsburgh, Pa Summer 2024 Thread.
TheClimateChanger replied to meatwad's topic in Upstate New York/Pennsylvania
In any event, today was the 10th day of 90+ for the summer. Looks like the next 4 days will do better than 90F, which would put us at 14 90+ on July 16. For the record, the 19th century summer data is absurd. Some of these years, the official summer mean temperature was warmer than D.C. Also, 1875-1900 averaged a ridiculous 29 days of 90+ in the official record. But 1901-1930 had an average of 9 days at the downtown site [which is even weirder when you consider most sites with PORs that long show that to be a warmer period, with hot summers in 1901, 1911, 1919, 1921, 1930]. The 1901-1930 average is actually one fewer than the current 1991-2020 mean.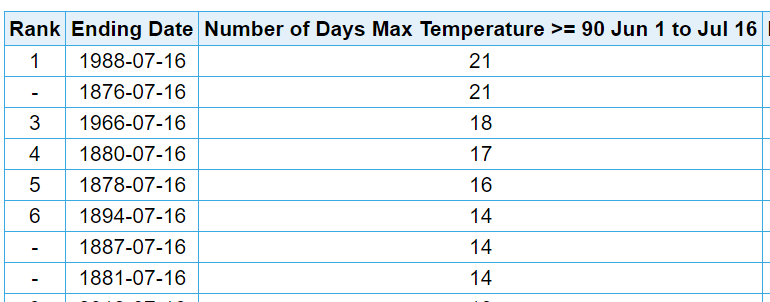
-
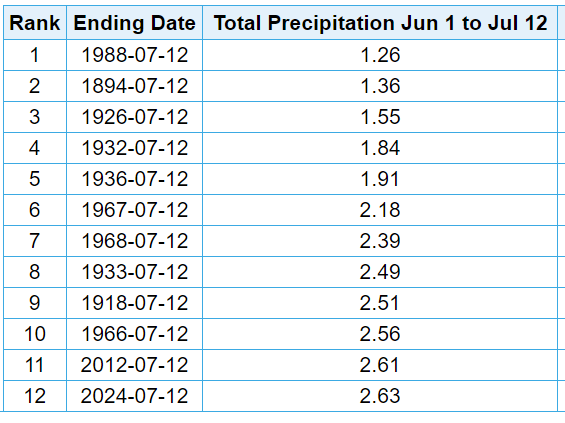
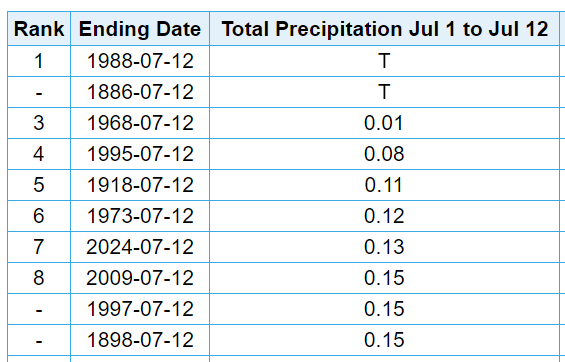
Pittsburgh, Pa Summer 2024 Thread.
TheClimateChanger replied to meatwad's topic in Upstate New York/Pennsylvania
Drought feedback? 12th driest start to summer on record, and 7th driest start to July. Meteorological Summer to date July to date