vortex95
-
Posts
1,488 -
Joined
Content Type
Profiles
Blogs
Forums
American Weather
Media Demo
Store
Gallery
Everything posted by vortex95
-
Powder blizzard in April, quite a storm. And the cold behind it? -25 C at 850. BOS high of 25 the day after the storm was colder than the previous record *low* temp for the day, despite full sun.
-
Scott would be happy w/ this from 39 years ago. Vicariously he would be impressed! 4/3/1987 A large, slow moving low pressure produced very heavy snows over the Appalachian Region starting on the 3rd and continuing into the 5th. 60 inches fell at Newfound Gap in western North Carolina -- the largest single storm snowfall in the state's history. Up to 36 inches was reported in southeastern Kentucky. The total of 25 inches at Charleston, West Virginia easily surpassed its previous record for the entire month of April of 5.9 inches. The 20.6 inch total at Akron, Ohio established an all-time record for that location. Interstate 40 was closed by snow for the first time since it was opened 20 years ago. This storm also dumped heavy snow in central and northeastern Alabama. Never before had a snowfall blanketed Alabama in April. 10 inches fell at Valley Head, 9 inches piled up at Fort Payne, and Birmingham recorded 6 inches. Lightning and thunder accompanied the snow in some areas while snow flurries fell as far south as Mobile. This was the first snow ever reported in the month of April in Mobile since records began in 1872. The storm became known unofficially as the "Dogwood Snowstorm" in the state. This same storm resulted in big flooding in New England. I recall the Merrimack River at ULowell ragin'! 4/4/1987 New England was in the middle of its second heavy rainstorm in 5 days. This was the same storm that produced record snows in the Appalachians. This storm dumped 4 to 7 inches of rain over the area and this, combined with snow melt and rivers already at bankfull, produced record flooding, especially in Maine. 2300 homes were flooded in Maine with 215 totally destroyed. Record water levels were reached at many dams. Damage in the state alone reached 100 million dollars.
-
We had the WWB in the WPAC and two strong TCs form in the SPAC w/ one currently developing in the NW PAC. A strong WWB like this is often a precursor for s sig El Nino.
-
Any "WE GRAUPEL" later in the day w/ the convective stuff?
-
April snow is ALWAYS welcome, esp. the big PHATTY flakes! LOL.
-
It's bad enough the hard science gets mucked up, but an increasing problem w/ time is the how all/any information is presented. It has become egregious in many respects So many tropes, logical fallacies, slant/spin, and sleazy rhetoric that taints the facts and truth! I get the business of the media and other outlets, it is a business, but they way things has degraded over time has become a disservice to the public by in large. Weather is fascinating enough as it is, and there is more than enough great info out there available to all to have plenty to talk about w/ distracting "bells and whistles." I find so many have a genuine interest in weather, but they have trouble where to start for info and even then have trouble separating fact from fiction, hype from the real deal!
-
Strongest in a century? We don't have adequate/detailed enough ocean temp records prior to the 1970s to properly quantify the true extent of super El Ninos, which explains why we have only have had 3 since the 1980. https://ggweather.com/enso/oni.htm of 4 if you use RONI: https://ggweather.com/enso/roni.htm Also, any headline that asks a question, the answer is almost always a "NO." It is a devious way to present something as if it will happen when it is not likely to happen or highly uncertain at the time. This is done in wx en masse w/ teasing suppositions and conjectures. And the sub-headline states: "increasingly likely wide-reaching climate impacts that last into 2027." First, it is not climate impacts, it is wx impacts. Atmospheric phenomena impacted from El Nino are short-term. That is wx, not climate. It does not impact "average wx over a long period," it impacts individual wx events/patterns of various degrees in the 1-1.5 year window El Ninos last. This idea that wx=climate and vice versa is ridiculous. Changing the meaning of words to fit a narrative/ideology. Second, why wouldn't El Nino (of any strength, or La Nina for that matter) not have wide-reaching impacts? This is redundant. We know ENSO has wide-reaching impacts, as do the at least a dozen other global and hemispheric oscillations that exists. Third, how can a potential of something be increasingly likely to have impacts? You have something that is uncertain to occur (potential), so how can it be scaled as being increasingly likely to have impacts when you are not even sure if it will occur in the first place? You are putting the wagon in front of the horse here. Not being pedantic here. How science-based information is conveyed is important. Not defining terms correctly or using improper logic/reasoning is bad science.
-
-
Full PT by evening? Bordering on priapism I bet! LOL.
-
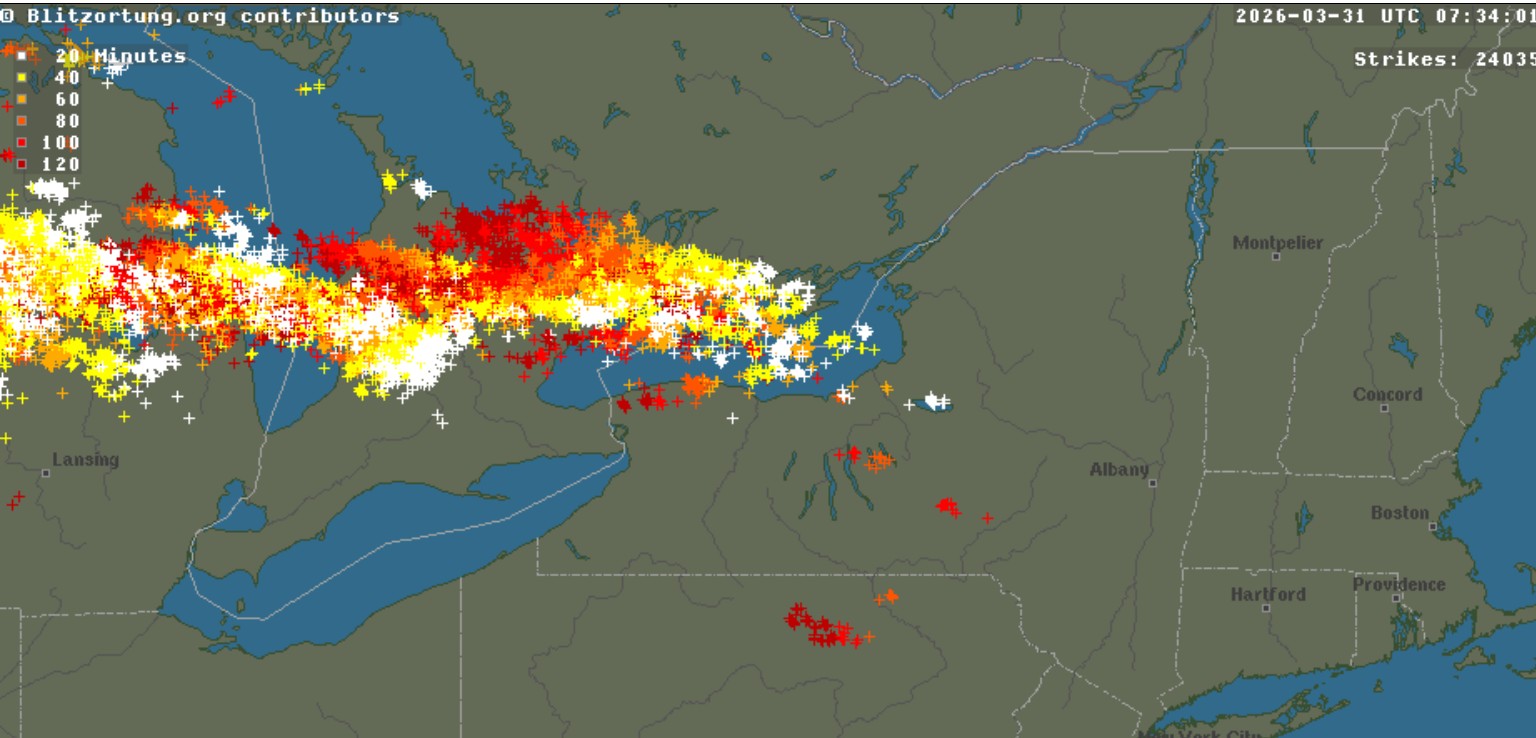
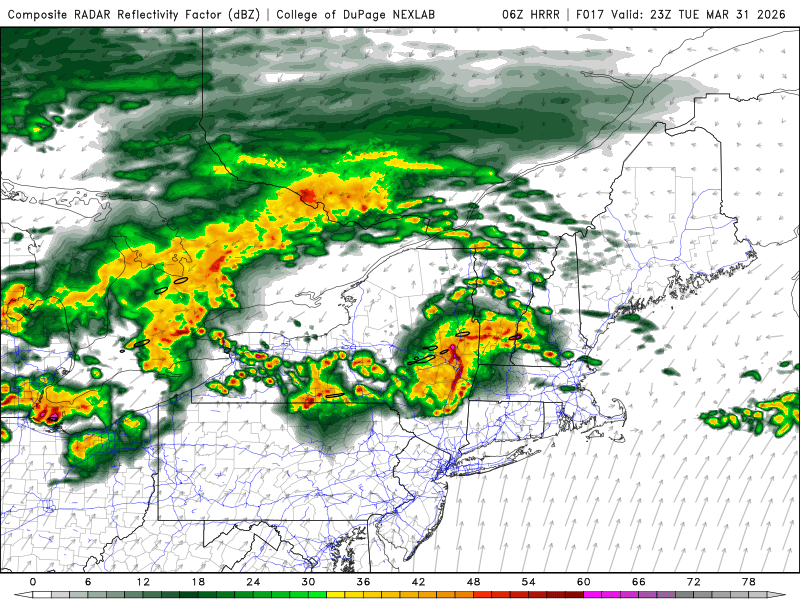
That is a *lot* of LTG in last 2 hr (24k+) ending 334am EDT for this time of year to our WNW. CoastalWx may have to pull out his laptop for a LTG PT event for renegade +CG! LOL. At the very least, he should prepare for wicked loud thunder booms under the inversion! Steep mid-level lapse rates all day should give us a couple of rounds TRW+ today. 06z HRRR shows an rather impressive mini-bow echo in ern NY early this evening moving E at nearly 60 mph. Supercell composite not bad in wrn MA/nrn CT/srn VT. ISOLTD "Scott spinner?" I would not be surprised if SPC extends the MRGL into western New England at 13z.

-
2026 Atlantic Hurricane Season
vortex95 replied to Stormchaserchuck1's topic in Tropical Headquarters
Sandy, whatever you chose to call it at at landfall, made landfall over southern NJ. That's more the Mid-Atlantic than NEUS. I was confined things to a hurricane center crossing the New England coast or Long Island. We've had lots of side swipes from hurricanes in the NEUS, but for a direct landfall, sensible wx impacts are typically much greater, esp. for wind and power outages. -
2026 Atlantic Hurricane Season
vortex95 replied to Stormchaserchuck1's topic in Tropical Headquarters
It's now been over 34 years since the last hurricane landfall in New England or LI. This is the longest gap by a considerable margin for the region going back to 1851. If you told me in 1995, the next 30 years would be the most active Atlantic TC period on record, but no NEUS landfalls, I would have said, "NO WAY!!!" Yet, it has happened. NEUS may be more vulnerable in "quiet" periods dictated by the AMO, such as 1970-1994. 3 landfalls then, but that doesn't explain the record 5 in 22 years 1938-1960 during the active period 1926-1969. One reason could be that during "quiet" periods, the MDR being less active, and more "home grown" storms that form closer to the E Coast, increasing the odds of a direct hit. -
The big problem is these days, there is no accountability for such forecasts, and those that make them will do everything to gaslight to tel you their forecast actually did verify or there is significant skill. I find this disingenuous and unethical. That doesn't mean LR forecasting should not be done or researched, but it is the classic "putting the wagon in front of the horse" here. Also, when you post on social media and want to be taken seriously, one should avoid levity, "flowery" language, and showing implied bias such as the post above ("who's excited for winter"). That is not being objective and scientific. Excited or not is irrelevant to the actual forecast and its skill! On moderated groups like here where it is wx weenies and the like, levity and implied bias are ok b/c we implicitly understand how things are for wx and forecasting and are a niche group, What we post is not meant for public "consumption" b/c they have no clue as to the nuances and idiosyncrasies of the profession, among other things!
-
Models forecasting two sig ZR events for NNE this week. It is quite rare to have sig ZR events this late in season in the NEUS (I'll let CoastalWx explain why, IF he knows! ), and in April it is practically unheard of. Please share any events that come to mind. This one from early March 1991 in NY state is the only "big" one in March in the NEUS in recent decades I know of. 3/3/1991 Freezing rain commenced over central and northwestern New York state late on this day and by the time it ended on the 4th, one to two inches of ice had accumulated in many places, resulting in the most costly natural disaster in the history of New York state up to this time. 19 counties were declared state disaster areas. At. one point, nearly 325,000 customers were without power and some did not get power back until the 16th. Storm damage exceeded $375M.
-
Well, you ain't seen nuthin' yet. Wait until Tue aftn! At least Weymouth should get some elevated TS.
-
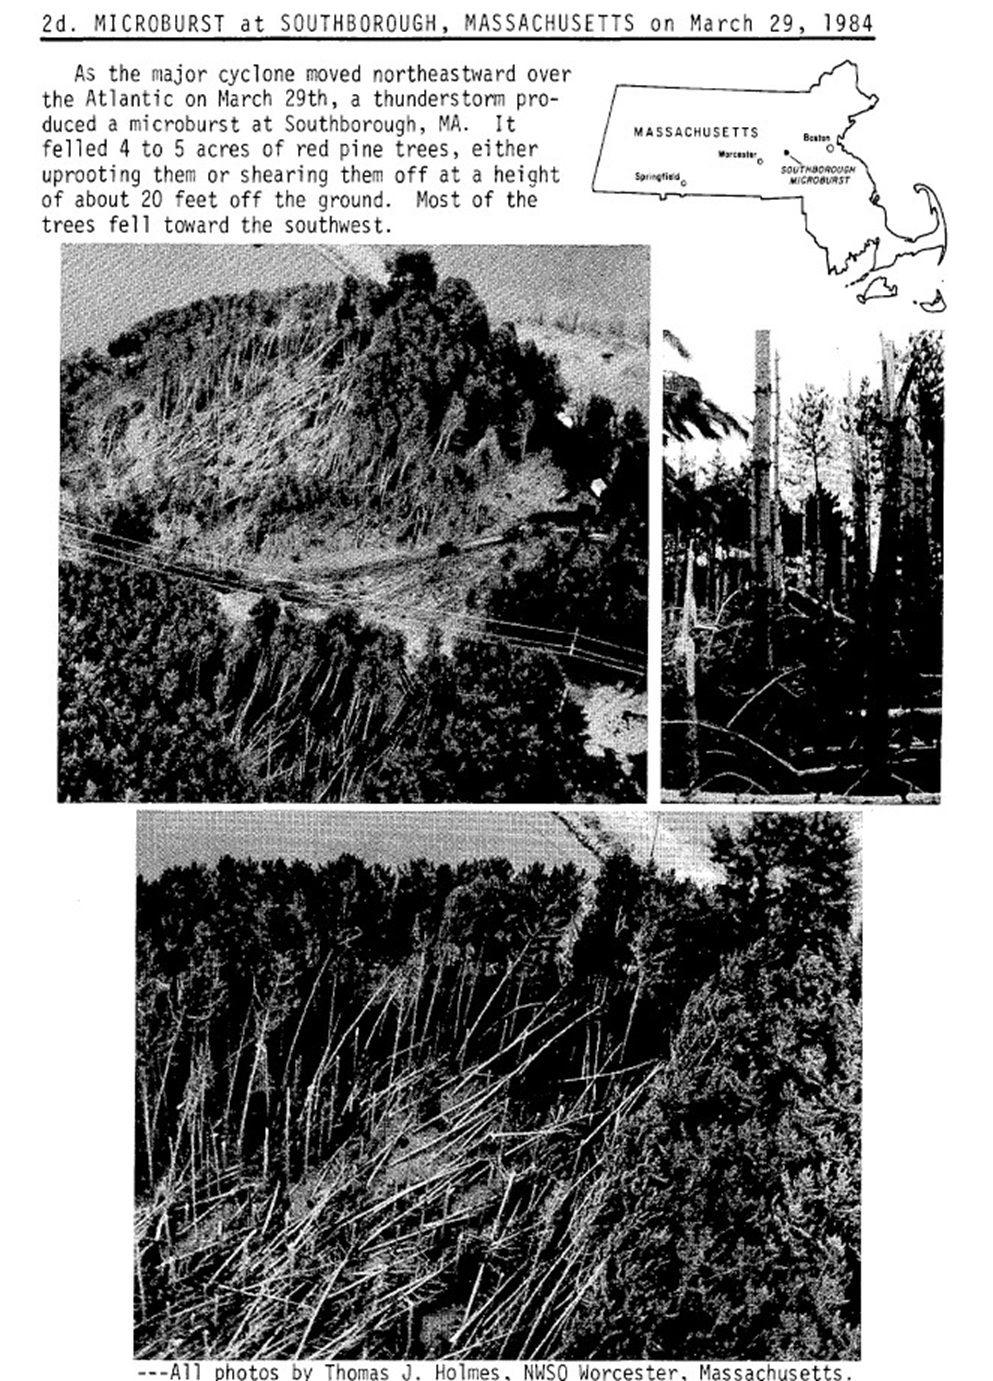
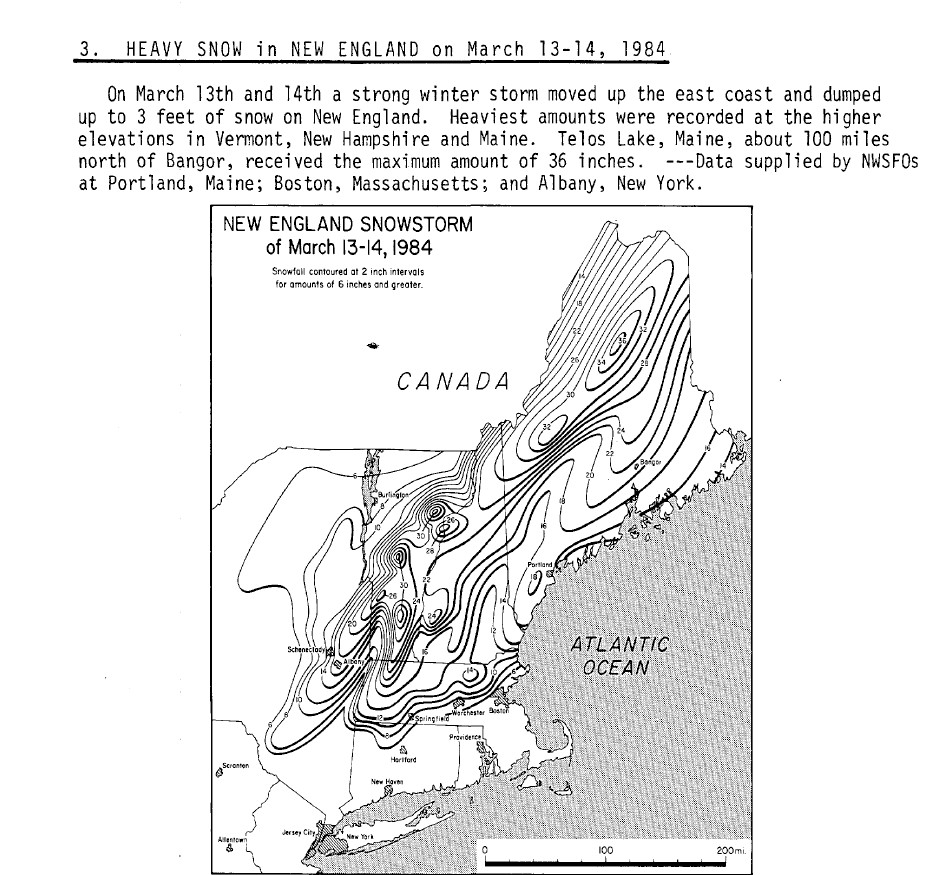
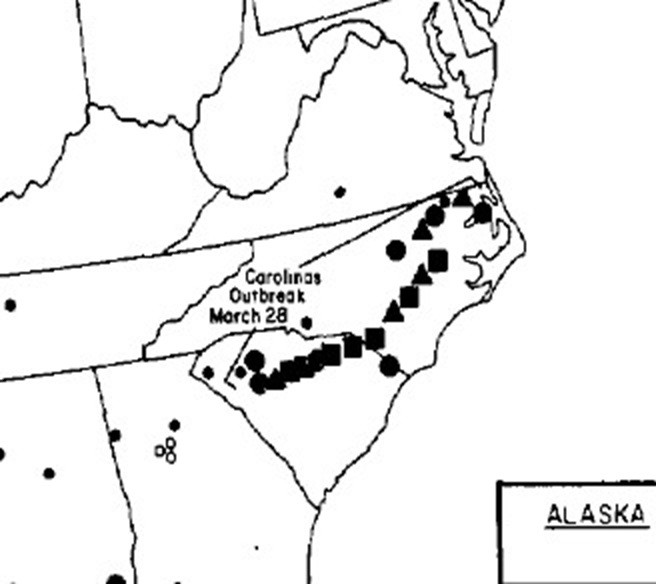
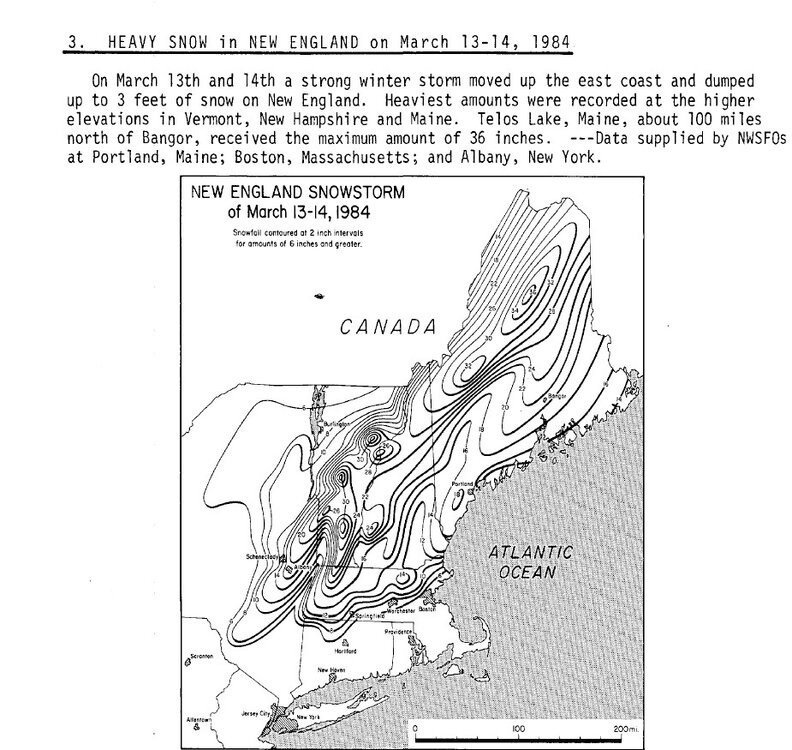
42 years ago today, one of the nastiest March blizzards occurred. Actually it was a 3 day event for the country. Storm (all STJ-driven) set pressure records for the month from the Desert SW to the SEUS/Mid-Atlantic. On 3/27 ahead of the low, Cotulla TX hit 108 F for to tie the highest temp in March for the U.S. (first set in 1954). Brownsville hit 106 F for not only its all-time record high March temp, but also all-time for any month. On 3/28, the worst tor outbreak for NC/SC occurred (57 fatalities). A single supercell long-tracked supercell produced 7 F4 tors, the most violent tors from a single storm, and it acted a lot like the Tri-State Tor from March 1925. Supercell was very close to the synoptic-scale low pressure that was sub-980 mb - that's really deep over land that far S. This storm produced 16 tors total w/ 3 F2 and 3 F3. The 13 F2+ tors I think is record for most F2+ tors from a single storm. One tor in SC was 2.5 mi wide at one point, which was the record width until 2013. On 3/29, the sfc low deepened to 963 mb E of the Delmarva and produced a blizzard (paste bomb) in New England w/ among the largest power outages/ worst tree damage on record for a winter storm for southern New England (worst power outage for MA since the 1965 E Coast blackout). 17" at ORH. MQE gusted to 108 mph, its highest gust since Donna in 1960 and nothing has matched that since. TS+ was widespread and legit microburst occurred in Southborough MA during the blizzard, flattening an area of trees. How crazy is that? I know of no other documented case like this. I recall it well. Doing my paper route that morning, it was the first time I saw a morning rainbow (not your typical pre-snowstorm sky, very convective-looking). Rain starting almost immediately turned to snow while on my route. Of course, school was not cancelled and the didn't even send us home early, despite blizzard conditions by late morning. March 1984 had a another biggie for interior sections mid-month w/ CAR getting 28.6" in 24 hr, by far it greatest 24 hr total on record. I attached a snowfall map. Something about those hand-drawn snowfall contour maps that look so cool!

-
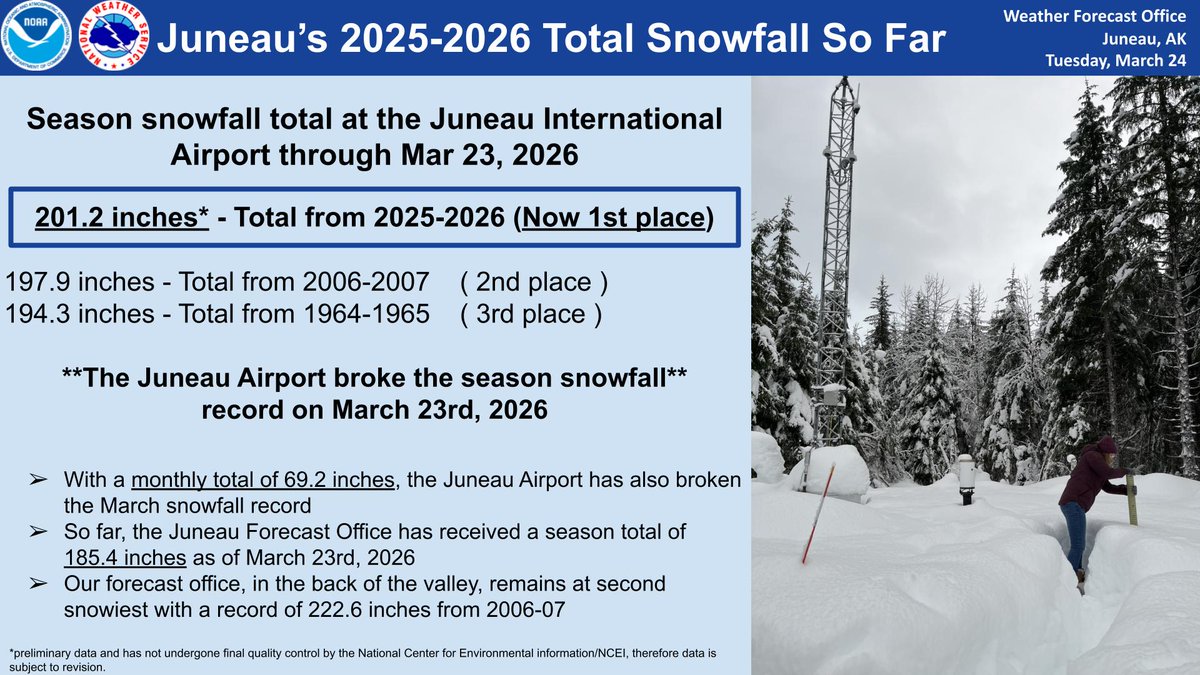
Juneau AK record snowy March and new seasonal snowfall record. CoastalWx is "mad!" -- his trope, "WHY can't we get that HERE!!??" https://x.com/NWSJuneau/status/2036403992503161041 And Vostok in Antarctica does it again -- coldest March temp globally on record on 3/24. https://x.com/ThierryGooseBC/status/2036618251300680011 Speaking of Antarctica, see this article and paper from 2015. https://www.science.org/content/article/rising-atmospheric-carbon-dioxide-actually-cools-part-antarctica https://agupubs.onlinelibrary.wiley.com/doi/full/10.1002/2015GL066749 And since 2015, the continent has continue to cool and record low temps being set, So empirically, we have proof, it's not just future speculation/conjecture based on model output. Actual hard observations override model forecasts/predictions every time. How many reading this and overall actually are aware of the above? I would say not that many. This exemplifies how there is often much more to a story than what the MSM reports on (cherry-picking is rife). And they often prey on the logical fallacy correlation = causation b/c that's how our minds are hardwired to do. Complex systems, such as the Earth's environment, do not work that way across the board. What may seen counterintuitive is actually reality in many cases. In this case, CO2 results in cooling in a polar region b/c of its unique geography. And given the East Antarctic Ice Sheet holds about 90% of the world's ice, this is non-trivial when it comes to sea level rise, among other things. It also goes to show the non-linear nature of the atmosphere and climate. Simple extrapolation or treating one changing parameter in a vacuum (e.g. rising SSTs automatically mean larger, more frequent, and stronger TCs globally across the board) is flawed and not good science.

-
I didn't know "lawn" was a verb! But this is coming from someone who used to say often to me at WSI "I HAZ!!!" LOL.
-
Saw this post the other day: "Numerical weather models are projecting huge westerly wind burst signal over the west Central Pacific over the next few weeks, some AI models are projecting signals that would achieve near record intensity. The westerly wind burst projected is as zonally and meridionally broad as any historical event I recall, and becomes better centered on the equator than the comparable event of March 1997. Oh boy, March 1997 comparable? 1997-98 was a super El Nino! And 2015-16 was a super one as well. So was 1982-83. So for next winter here? Right away, CoastalWx will go, "IT WILL BLOW b/c it is too warm! Any snow that falls will not stick around!" LOL. Well, it is not all lost, all three of those super El Nino years, we go something good in SNE. Feb 1983 and 2016 E Coast biggies and the "surprise" event 12/23/97 (SNOINCR 8 at Ayer MA). Also, the nasty ZR event NNE and sern Quebec Jan 1998. And the only decent cold shots in such winters are in the NEUS, while the rest of the country is a furnace!
-
Social media we all know can be a wicked minefield. It's the nature of the beast. As long as you understand that, it is much easier to handle it all. Still, it is so easy for things to be taken out of context or one's tone misinterpreted. The pitfalls of social media. You lose a lot in translation not being face-to-face talking or the like! Etiquette is important, and also not to knee-jerk react to anything you may not like or offends you, but that is NOT easy! We all fall into that trap for just about anything one time or another. And I dislike it b/c it distracts me from enjoying the topic at hand. I say to myself often, "I liked it so much better when we could all enjoy and weenie out about the wx w/o fostering blame, pushing messaging, or seeing non-wx ppl/the public freak out/worried sick about the world ending! Can't we just enjoy wx for what it is? It is amazing and fascinating in its own right. That is more than enough to keep us busy and engaged!" It not always about being self-righteous or correct on social media, just, and we know this well being wx weenies, is that so often we see stuff posted all over the place, and we *know* it is factually wrong. Such as wx history and the media buzzword 'unprecedented" said far too often b/c it sounds dramatic and sells. And lame derivatives like "almost unprecedented" - yes, I have actually seen that. Stupid, either it has happened before or not. How about say, "rare" instead! LOL. This is what gets me more and more, how things are worded and communicated. It's not about being pedantic, despite being precise and accurate is important in many sciences, just I feel for those (the public) who don't know any better, and get duped easily. And a lot of up and coming mets/wx enthusiasts get the wrong idea about things. So I don't mind heated discussion or debate, as long as it is kept civil. I am known for sometimes getting on a high-horse, and then I have to scale it back. I can't tell you how many times I have written something up quickly on social media n response to something that got under my skin, finish it, then re-read, and then I go "nah, not worth it!" and delete, or edit it down to make it less verbose and pedantic.
-
That's true, calling bad obs out is good, but then many "break" or "wander" again, and the cycle repeats. So it doesn't go away really for long-term average temps impact. UHI is not to be discounted. It impacts long-term temp averages significantly, and in certain cases, the short-term as well. Such as days hitting some psychologically pleasing number ending in 0 or 5 (e.g. temp 90+). UHI adds a couple of degrees to the max for many cities. and w/ time, the warm biases are getting higher. ***** Here is something I think some may find useful concerning wx data and stats,, esp. when it comes to reporting today, perceptions, and how things can be manipulated and skewed easy when details or facts are left out. This goes back to what I said about data sets and how they can be processed and interpreted in many different ways, and how the resultant stats can be made to say just about anything. You need to be skeptical and put on your critical thinking that more than ever these days, that is what I emphasizing here, not who is "right" or "wrong" or the like. ----- I would caution as to the number of records broken in any given event w/ primary wx parameters involved. I've seen posts that over 600 all-time temp records have been set w/ the current heatwave. That may be true, but there is a caveat. What stations are they using to get that number? I ask b/c the period of record (POR) for many wx stations now is very short since we have installed a *lot* in the last 30 years alone. I know this subject very well b/c I was the keeper of files for wx reporting sites across the globe when I was at WSI, and I still keep track of it all on my own time now. In last 25 years alone, over 600 AWOS sites have been installed and METARs available from the MS Valley to the West Coast. Just in TX, over 130. So you can see where I am going w/ this. When it is claimed a temp record is set at any site, you *have* to ask, "what is its POR?" Sure, we have many GHCN sites and those are proper to use, but I found in order to inflate and hype totals, sites that do not have a long climate history are included. I shouldn't have to spell it out, but can you see how easy it is to set temp records of *any* kind when POR is short? This doesn't discount the nature of current heatwave as to high-end, but you see how numbers can be "played with" to make things appear more impressive than they really are. Disregarding POR is disingenuous when you are talking climate records. This comes all around to how we report on things, and "adjust" for the max effect for hype and to promote certain narratives. Considerable exaggeration and plain lies derived from wx data exist and this practice is rife for a host of non-scientific reasons, and it is lopsided toward gloom and doom b/c of warmer overall temps to the point it has become ridiculous (i.e. everything bad that happens now is due to warmer global temps or "the Earth's day has increased by 1.33 milliseconds in the last century from climate change!"). And what I say above about POR, this is just one of many things that can be manipulated concerning wx data. POR omission is something straightforward and easy to detect, but it gets more complicated than that. Such as this: P-hacking The manipulative practice of re-analyzing or selecting data until non-significant results become statistically significant often by testing multiple variables or stopping data collection early. This technique generates false positives, misleads research findings, and undermines scientific integrity.
-
Thanks. The push back or snark does not bother me. I don't try to label ppl anything (e.g. usual suspects) b/c that tends to hurt the overall dialogue. I'm not here to tell ppl what to think, only present hard facts or items that some may not be aware of that can do a long way as to how one thinks about and approaches things. There are two things I focus on: 1) Past wx history (esp. recorded) - It has occurred and factual so you can't really debate its validity in a debate. And it is remarkable what is out there that you may not have know about that puts what occurs today to shame in many regards. Such provides context and perspective, and the more you look and learn, the better the picture becomes. 2) The social aspects involved w/ debate/argument - this is biggie, and is what wrecks many civil discussions/debates these days. Things like logical fallacies and cognitive biases, these are harmful to science. Human nature and all its shortcomings and nuances we all are susceptible to cloud issues to the max. Example?, recency bias - the tendency to assign more value or significance to what happens in the here and now or in recent memory vs. long ago.
-
Huge B&B fan!
-
I never questioned the overall scope of the heat out west currently. Just details are important in the sciences. Such an event allowed an exercise in presenting such details in the form of limits and caveats of how we measure and record wx data, along w/ some ancillary practical information. That is a good thing.
-
As CoastalWx might have said if he had this scenic view, "IT LOOKS VIOLENTLY BEAUTIFUL OUT THERE!!!" Never in 1000 years would have ever thought to pair the words "violently" and "beautiful" together!