

MN Transplant
-
Posts
16,360 -
Joined
-
Last visited
Content Type
Profiles
Blogs
Forums
American Weather
Media Demo
Store
Gallery
Posts posted by MN Transplant
-
-
34 minutes ago, pazzo83 said:
ground here is starting to look pretty rough - and some leaves are changing color that shouldn't be.
Yup, it doesn’t take long unfortunately. Measurable rain once here in 2.5 weeks.
-
14 minutes ago, George BM said:
Today's climate report just in shows that all three local airports have hit 99F today. A new 2023 high for DCA.
DCA: 99F
IAD: 99F
BWI: 99F
...
RIC: 98F
We'll see if any funny heat business occur over the next half hour or so.
All records, of course.
-
13 minutes ago, George BM said:
Today's climate report just in shows that all three local airports have hit 99F today. A new 2023 high for DCA.
DCA: 99F
IAD: 99F
BWI: 99F
...
RIC: 98F
We'll see if any funny heat business occur over the next half hour or so.
Sets us up for tomorrow with the slightly higher 850s.
-
 1
1
-
-
DCA joins the 98+ cohort
-
23 minutes ago, BlizzardNole said:
What the....low of 40 and a high of 90?! And it snowed 5-plus inches on March 10
Screams dry downslope. Amazing.
-
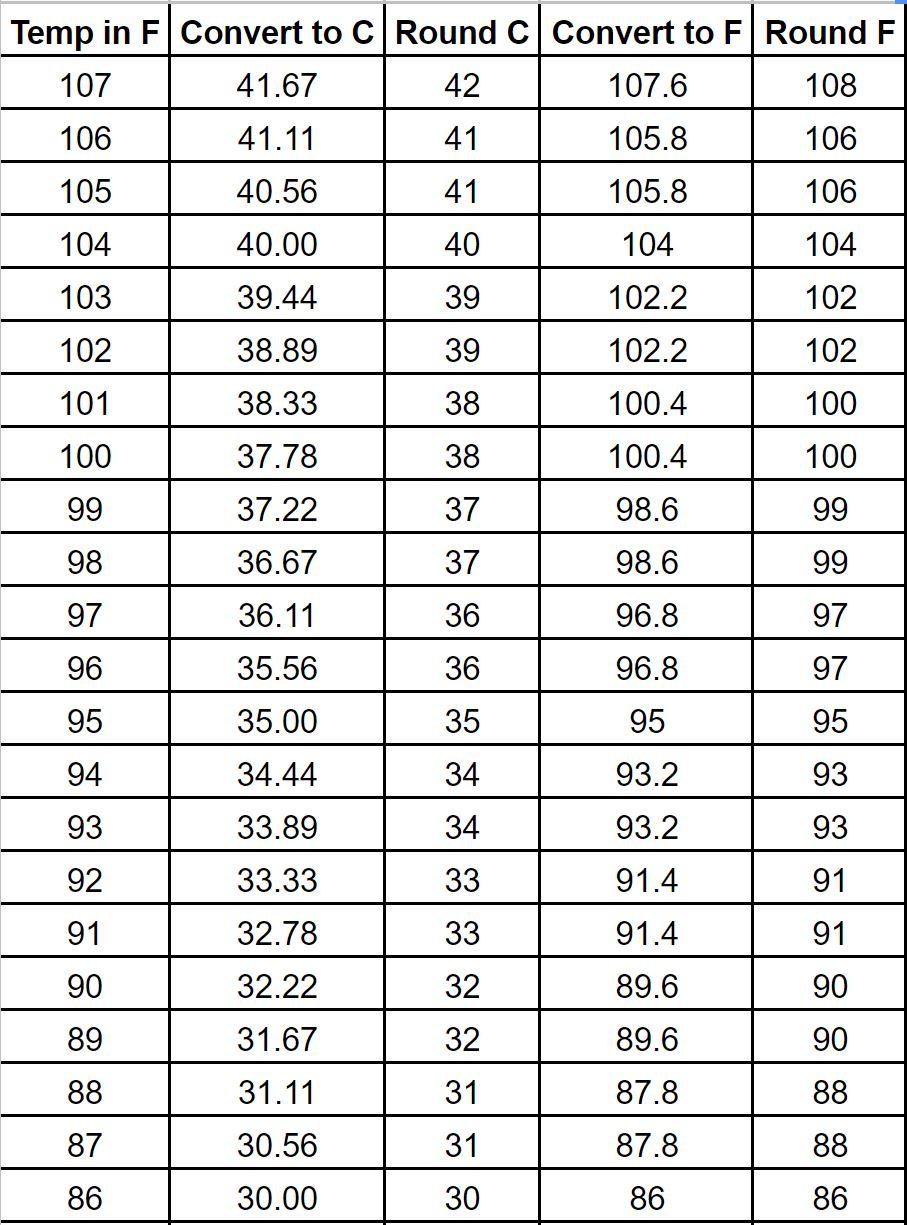
15 minutes ago, WxUSAF said:
99 at BWI
Might be a fake 5-min 99 unless the NWS has confirmed it. The official ob was 98.
IAD at least 98.
DCA at least 96.
94.8 is the high at home.
-
The 5-minute ob reminder. There will never be a 98 degree 5-min ob (only the hourly obs at 52 or 53 past) because of the silly rounding that is done, but any 100 is legit.
-
 2
2
-
-
22 minutes ago, pazzo83 said:
DC DPR is keeping two pools open through Sept 21 (Hearst in N Cleveland Park and Oxon Run Pool in Anacostia. A bunch of spray parks are also remaining open until then.
It is all about finding lifeguards.
-
26 minutes ago, Its a Breeze said:
So hear me out....
RIC is technically in southern Virginia, and therefore should not count. Also, with Labor Day being the end of summer, we can ignore any subsequent readings and close the contest as of yesterday.
Since you and I have DCA/IAD identical, I really just need BWI to hit 100 and not RIC.
Of course, we are both going to lose when IAD/DCA hit 100 tomorrow.
-
1
-
-
1 hour ago, mattie g said:
Hell of a closing weekend at the pool. Place was mobbed yesterday, and was probably the most fun of any days we had all summer!
Definitely a bummer to know we won't have any more long weekend days of just chilling with friends around the pool, but it does get us started on Friday happy hours on the cul-de-sac!
Our pool was hopping too, but they are open for two more weekends (and 4-8pm during the week).
-
1
-
-
44 minutes ago, pazzo83 said:
there will prob be widespread 100+F temps today (including DCA if we keep the NW wind).
DCA is running well ahead of yesterday while IAD is a touch ahead. The clouds hung around yesterday so the comparisons are a bit tough to make. My station is actually a degree behind.
-
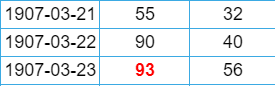
8 hours ago, astarck said:
I dug a little deeper for DCA. Counts by month (the count is higher than the period of record because of ties):
March: 1 (1907)
April: 2 (1960, 1976)
May: 4 (1889, 1963, 1996, 2004)
June: 35
July: 83
August: 42
September: 13
October: 0 (In 2019 DCA was one degree away with 98 in October, the annual high was 99)March 1907 is amazing. There are 4 record highs that still stand including the hottest March temp (93).
-
98 at DCA. Believe that is the new high for the year.
-
1
-
-
Topped my high from yesterday. 94.5 and gross.
-
1
-
-
11 hours ago, Roger Smith said:
Two of the four contest locations edged up by 1F today (so I read on NWS) ... IAD 99F and BWI 98F ... here are the updated contest standings:
Current standings as of September 3, 2023
Table is now in scoring order. Errors underlined are the few that are forecasts already passed by actual maxima so far (IAD only to date).
__ Max values to date ____________ 97 __ 99 __ 98 __ 98
The qualifier for rank is the separation of equal error totals by the rules outlined earlier.
This table will be adjusted if or when necessary, and if not, it will be posted again in rank order later in the summer.
(table adjusted Sep 3 for IAD 99 and BWI 98)
(Note: errors underlined are subject to future increases as the forecasts are already below outcomes _ applies to IAD only so far)
FORECASTER (order of entry) __ DCA _ IAD _ BWI _ RIC _____ Errors ____Total __ Rank __ qualifier (what separates tied totals)
LittleVillageWx (10) ______________ 98 __ 97 __ 98 __ 98 ______ 1 2 0 0 ____ 3 ____ 1
MN Transplant ( 5 ) ______________ 98 __ 99 _ 100 __ 99 ______ 1 0 2 1 ____ 4 ____ 2 __ earlier entry (of 4 total scores)
A lot of the entries are still in play. Stupid BWI pavement stopped working.
-
1
-
 1
1
-
-
I was tracking IAD for a while earlier today but fell off the pace. Only 94.
-
93.4 is the high so far here.
-
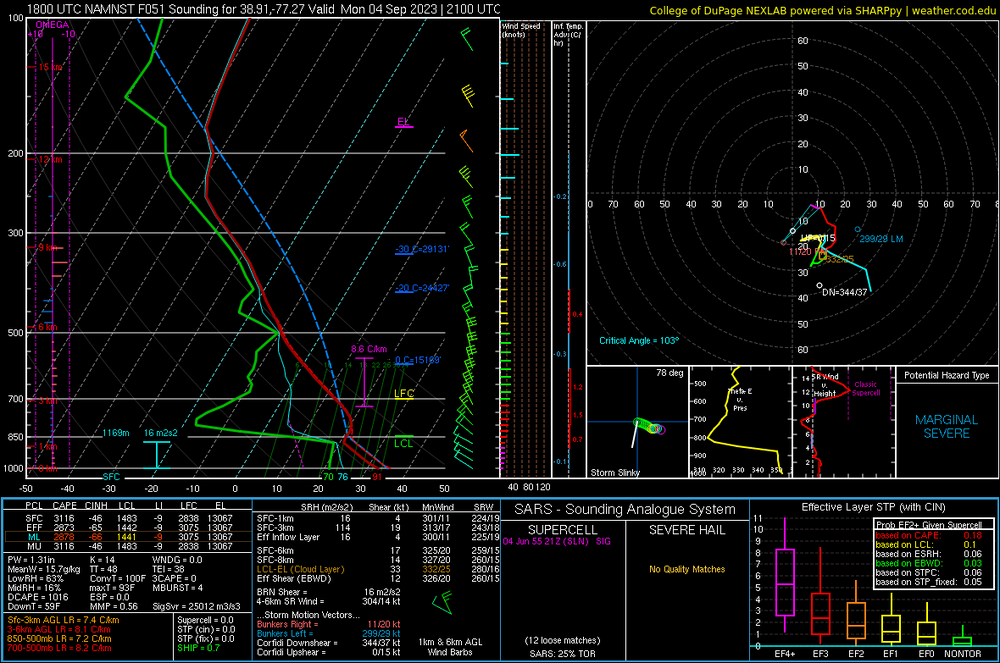
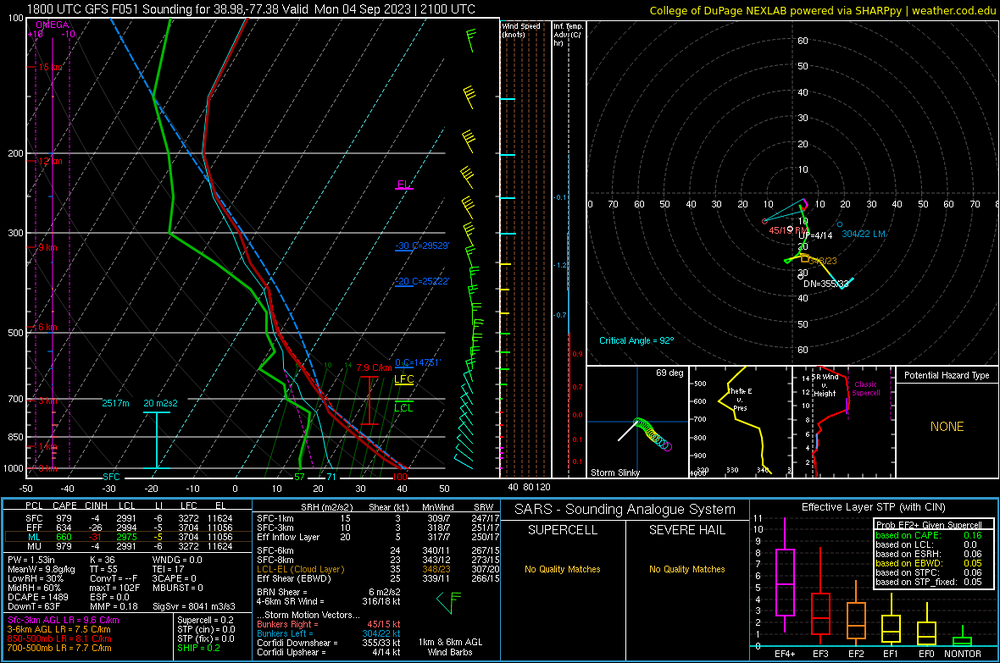
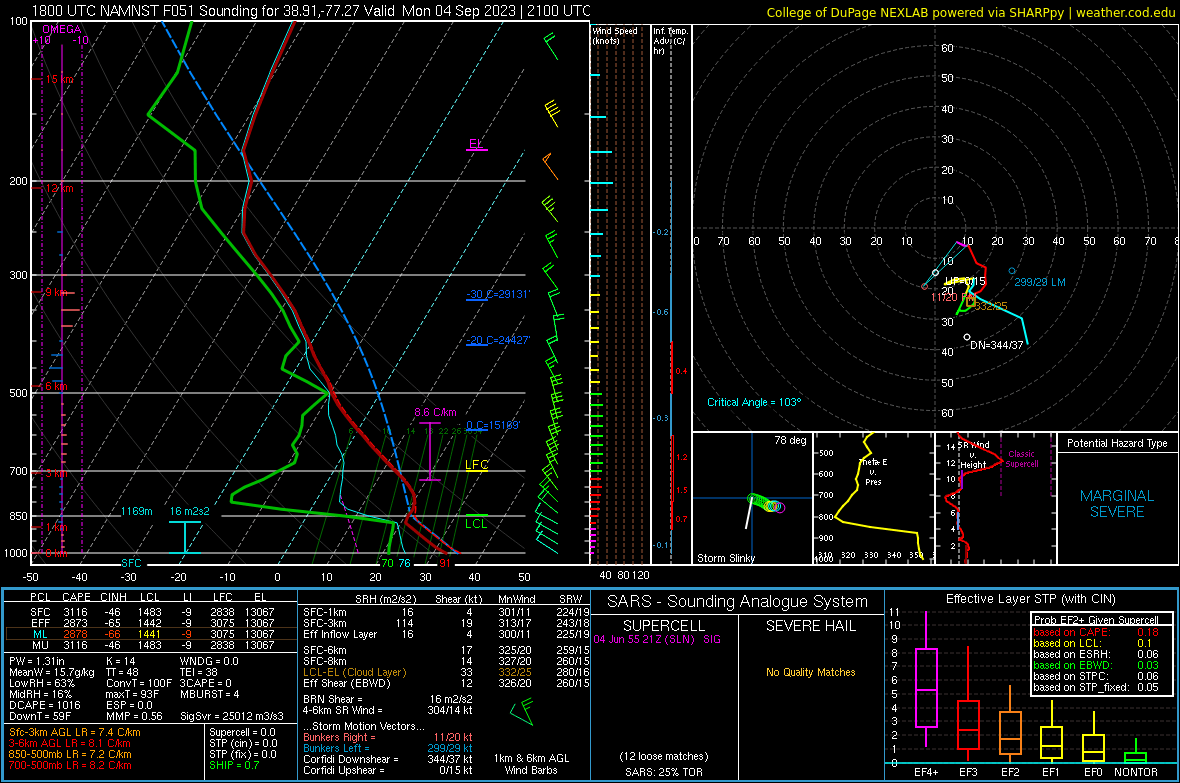
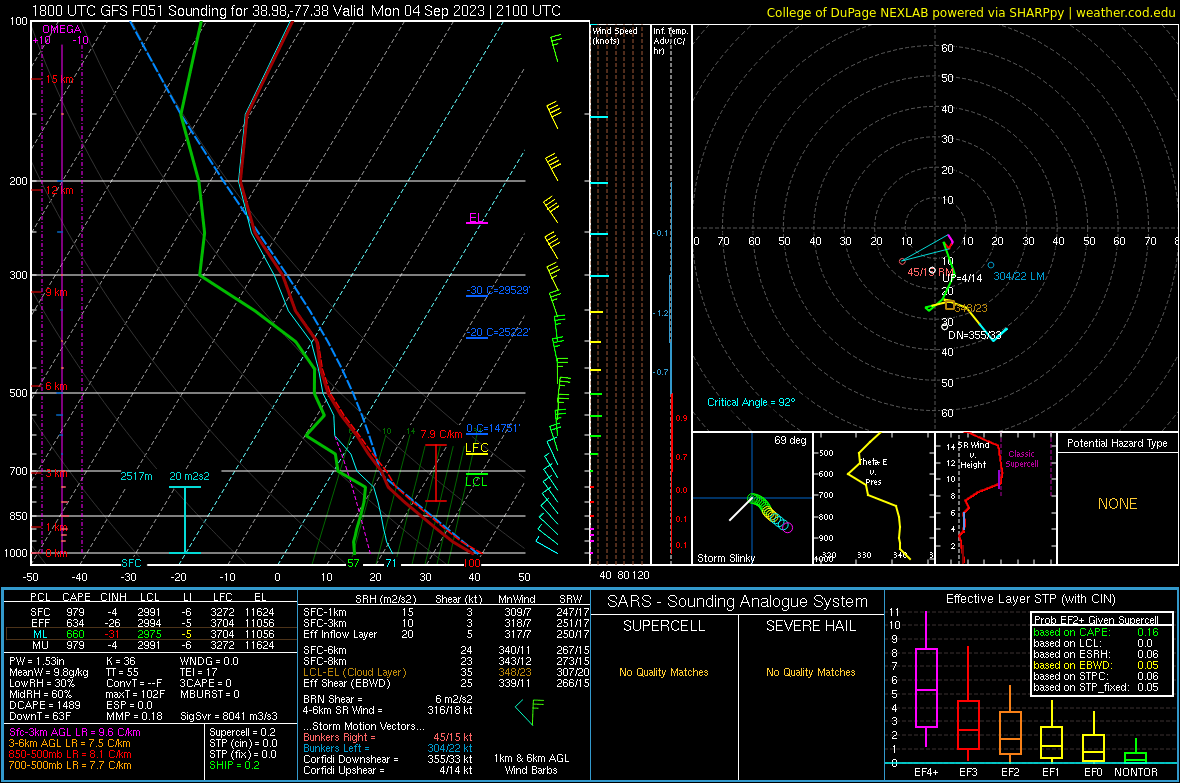
These differences are just wild for Monday afternoon. The NAM seems way too humid at the low levels, but the GFS mixing depth is, uh, let's go with aggressive.
-
1
-
-
1 minute ago, Terpeast said:
Looks like my analysis supports this.
Yeah. This is a brutal image. The +2 period is basically ending in 2040, +3 in 2060, and +4 in 2080.

Projected changes to mean annual snowfall (%) at Toronto, Ontario (a); Montréal, Québec (b); Halifax, Nova Scotia (c); Boston, Massachusetts (d); New York City, New York (e); and Washington, D.C. (f) for the three global warming levels. Relative changes with respect to the 1980–2009 mean are plotted for each CRCM5 simulation (symbols indicated in the legend). A kernel density estimation of the distribution of projected changes among the CRCM5-ClimEx simulations is shaded in the gray violin plots generated using the Seaborn package (Waskom, 2021). Within each violin plot, a smaller box plot is included indicating the median (white dot), 25th–75th percentile (dark gray box) and complete range of the CRCM5-ClimEx data (dark gray vertical lines). Values calculated from the pooled data for all 50 ClimEx members are indicated by the purple circles. Signal-to-noise ratio (S/N) calculated from the ClimEx data is indicated under each violin plot.
-
2
-
2
-
-
https://agupubs.onlinelibrary.wiley.com/doi/10.1029/2023JD038804
Plain Language Summary
Snowstorms affect the highly populated regions of the northeastern United States and southeastern Canada every winter, disrupting ground and air travel and resulting in substantial socioeconomic impacts. Understanding how climate change may impact snowstorms is necessary for this region to prepare for the future. We explore how snowstorms in these regions may change in a future, warmer world using two sets of climate model simulations. We find that yearly total snowfall is likely to decrease over most of this region, with the largest declines to the south and smaller declines farther north. Despite these decreases, we find that the snowfall amounts that currently occur during the largest snowstorms are still likely to occur even in a much warmer future climate. Finally, we examine snowstorms that produce a large percentage of the annual snowfall during a single event. We find that the region where these big snowstorms relative to the yearly snowfall occur most often will shift northward in the future. In summary, while yearly snowfall is likely to decrease nearly everywhere in eastern North America, significant snowstorms will continue to occur, and some regions will see more of their yearly snowfall during a few large events.
-
3
-
1
-
-
https://journals.ametsoc.org/view/journals/clim/34/6/JCLI-D-20-0197.1.xml
5. Summary and discussion
This study investigates effects of global warming on extreme snowstorms along the NEUS coast by conducting and comparing dynamical-downscaling WRF simulations driven with and without the mean climate change signal extracted from HiRAM historical and future simulations. The 93 observed snowstorms in 1980–2015 documented in G. Chen et al. (2019) were adopted as surrogates for studying the potential effects. Results show that the number of events with moderate and heavy daily snowfall (SWE greater than 10 mm day−1) at Boston, New York City, Philadelphia, and Washington, D.C. is decreased from 60, 54, 43, and 30 to 32, 29, 30, and 20, respectively (Fig. 7). In addition, although the rainfall increases in all four cities, total precipitation increases in the south (especially along the coast), where the rainfall is increased due to the warming-caused increase of water vapor content and upward vertical motion, but decreases in the north (especially along the coast), where the rainfall increase is overwhelmed by the snow decrease (Figs. 5–7). As a result, the precipitation distribution exhibits a southwestward shift. Another notable effect is that the frequency of mixed rain and snow and freezing precipitation events is increased in the north of NEUS (Figs. 8 and 9), attributed to the northward retreat of the 0°C zone and the expansion of the zone with temperature near 0°C.
-
2
-
1
-
-
23 minutes ago, George BM said:
Take this for what it's worth, which may not be much, but IAD may have managed to sneak in a 90F today.
Forecast high for today was 84F...
No I'm not trying to imply that IAD will may 104F on Tuesday... They won't.

They'll probably at least get into the upper half of the 90s... as forecasted anyway.
Yeah, IAD 90 after a low of 54 today! So, IAD hit 90 in September and still had a negative daily departure. BWI 87, DCA 85.
-
1
-
-
20 minutes ago, TSSN+ said:
We be cookin.
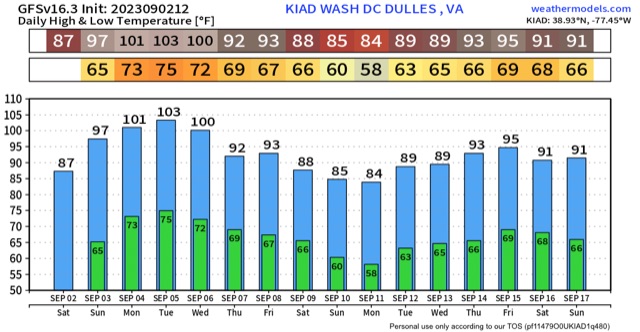
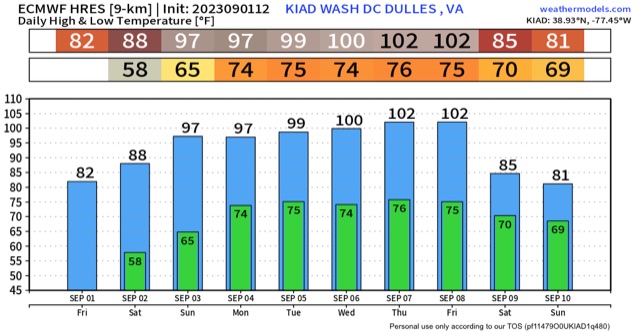
The GFS is broken. The NAM's 95ish makes more sense.
-
59 minutes ago, TSSN+ said:
Rough
It has never hit 100 at Dulles in September.
September Discobs 2023
in Mid Atlantic
Posted
IAD and my station are running slightly ahead of yesterday. BWI about even and DCA a touch behind.