ORH_wxman
-
Posts
93,099 -
Joined
-
Last visited
Content Type
Profiles
Blogs
Forums
American Weather
Media Demo
Store
Gallery
Everything posted by ORH_wxman
-
Yeah not buying it right now. We need to get closer to the first event anyway and figure out how amped or not it ends up because that would impact any potential second wave developing along the stalled boundary. Despite the mega amped OP runs, still a good amount of spread in the ensembles for 12/1.
-
Yeah he’s on the wrong side of Pinkham notch for upslope. The synoptic stuff will come though. Some years there’s a couple good ones in November but other years it seems like you’re waiting and then all of the sudden you get destroyed by several in a row in December.
-
I love the sea scallops...the bay scallops are too small for me. I’ll maybe eat them if they are an appetizer at a party or something.
-
It definitely “feels” like this season is starting sluggish based on the last two Novembers (October warning criteria snowfall down here not withstanding)....but then I think back to like the 2007-2010 years which were excellent for snowfall but several of those Novembers weren’t exactly rocking, even in NNE. We weren’t starting permanent snowpack in NNE in early to mid November like the past two Novembers.
-
I used to go to Yankee lobster all the time by Harpoon Brewery back before it became a circus on the seaport and I loved their scallop and clam plate. Place is great because the boats come right to their dock in the back. Fresh stuff.
-
If it produces a bout of blocking (even if only for a couple weeks) in January, it could be very helpful.
-
Yeah it was pretty terrible....there were a few fleeting moments of snow...esp for SNE (NNE was screwed even worse) in February. But yeah, more or less garbage pattern all winter. My guess is you'll start "permanent" pack season there behind the rainstorm that models have for Dec 1. Decent chance you get upslope behind it with that ULL takings its sweet time to move out, and then hopefully we start adding some synoptic stuff after that.
-
Who knows...good question. Something similar happened in the strong La Nina of 1975-1976. Might be a good couple case studies some day.
-
The Aleutian low holds pretty firm which keeps the PNA ridge in place...sort of just reloads instead of rolling over....it's a pretty stable setup if you can keep those two pieces in place. Hopefully that prodces some threats after 12/5-12/6 or so.
-
What's nice is the EPS are resisting rolling the PNA ridge over like on some previous runs, so if that is correct, then we could definitely have some chances in the 2nd week of December...maybe something slightly sooner, though for now, I'd bet against that.
-
I've been thinking more progressive too for the last couple days, though the 12z models want to stemwind it more aggressively again. I don't mind if that ends up the solution though because it will actually probably give us a better chance of something developing on the backside of that as another shortwave dives in....maybe steal an event in the first week fo December. Low probability, but possible.
-
There's plenty of solid seafood where we vacation like 30 minutes east of Phin in Maine. That whole area doesn't shy away from it just because they are an hour from the coastline. Good prices up in that area too.
-
I haven't tried it myself, but I've heard from others that the flame-broiled flavor helps versus some other meat-substitute burgers. Yeah you slather enough condiments on anything, you can probably mask some of the weird flavor. Anyways, beef burgers for me int he foreseeable future.
-
I've had tofu twice in my life. It was horrendous each time....including the 2nd time when a vegetarian friend insisted "this one is really good". The concept of a "Tofurkey" sounds nightmarish. Maybe there's some good tofu out there but I'm not actively going to search for it.
-
IF we end up getting another system redevelop along the frontal boundary just offshore with that deep trough around Dec 3 or Dec 4, then it's possible we could see something in first week of December, but I'd put that at a long shot right now.
-
We were going to have my sister and mother over if it was warm enough to eat on the deck, but since the weather looks like dogshit, it will just be our immediate family.
-
The graph you posted shows that the GEFS have had a bias of forecasting the NAO/AO too negative....just look at the black observed line vs the blue forecast lines,.
-
Meanwhile scooter had like 8 warning events and a couple of 20 inchers.
-
Yeah it's weird. Hard to find other moderate Ninas (or stronger) that show this behavior. As I mentioned earlier, 1975-1976 did have a similar pattern that lasted quite a while, but I don't know of any others that weren't weak (like '95-'96)
-
btw, I moved the early December talk to the December thread...in case you were wondering where the posts went.
-
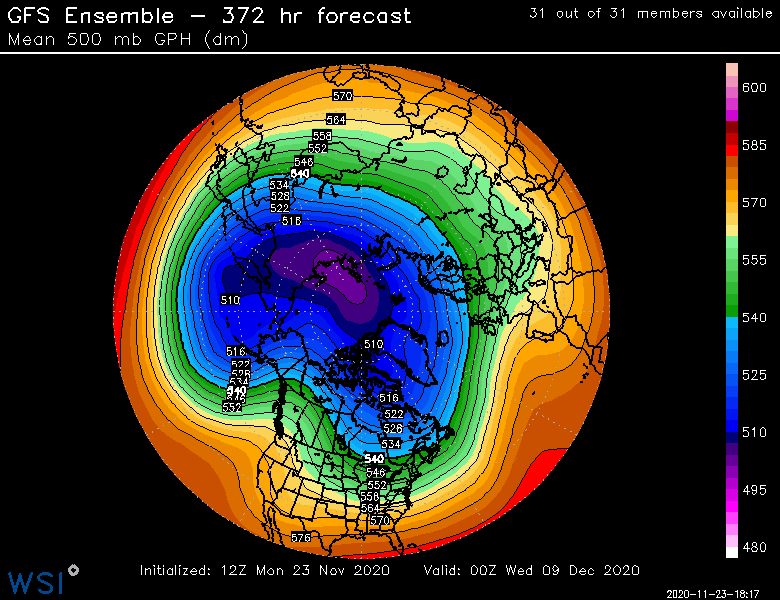
The pattern does get better as Scott said beyond that...it's still not "great", but you'll note how the low heights/vortex has retrograded from AK/Bering Strait back into eastern Siberia/Kamchatka....into a Aleutian Low/+PNA/neutralish EPO pattern. But we'll see...that's at the end of the run once again.
-
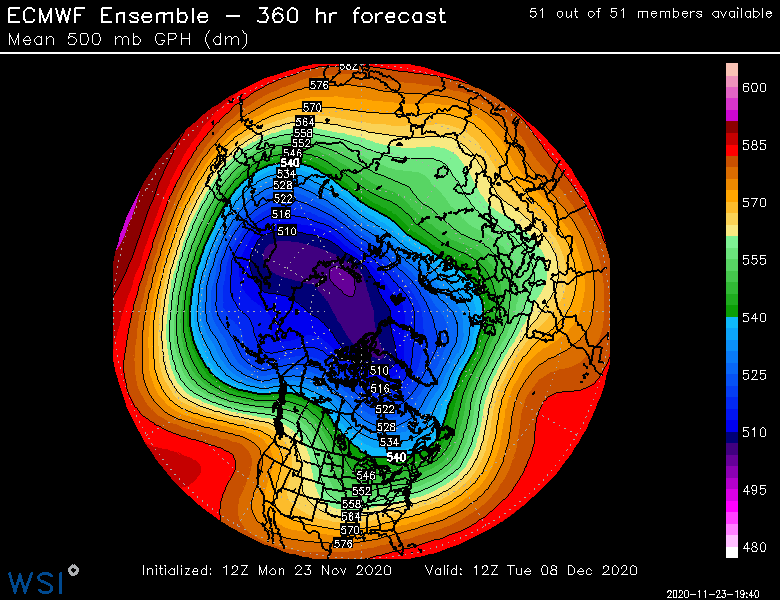
Euro ensembles are kind of a mess....not very cold, but there is a chance if things line up perfect. You can see the PNA ridge which has been there all along, but the plethora of waves to the east are kind screwing with the solutions. I agree with you that the stemwinder cutoff in the lakes is unlikely.
-
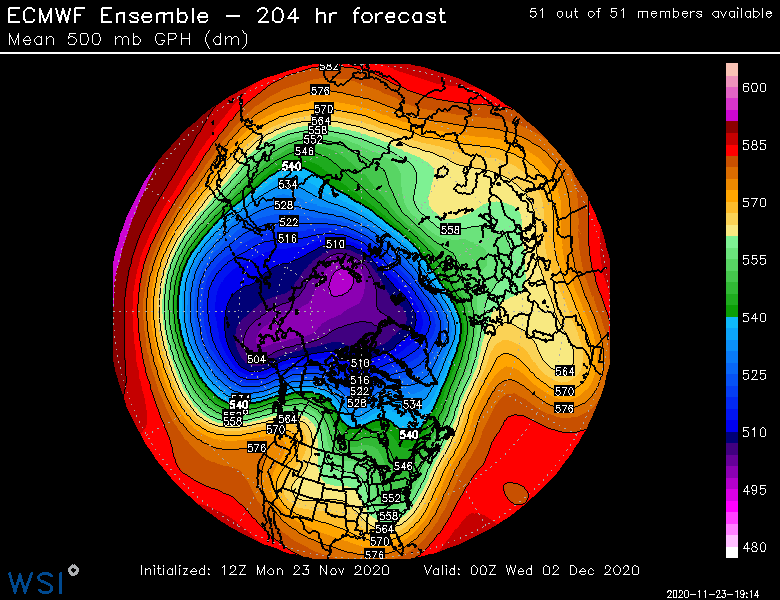
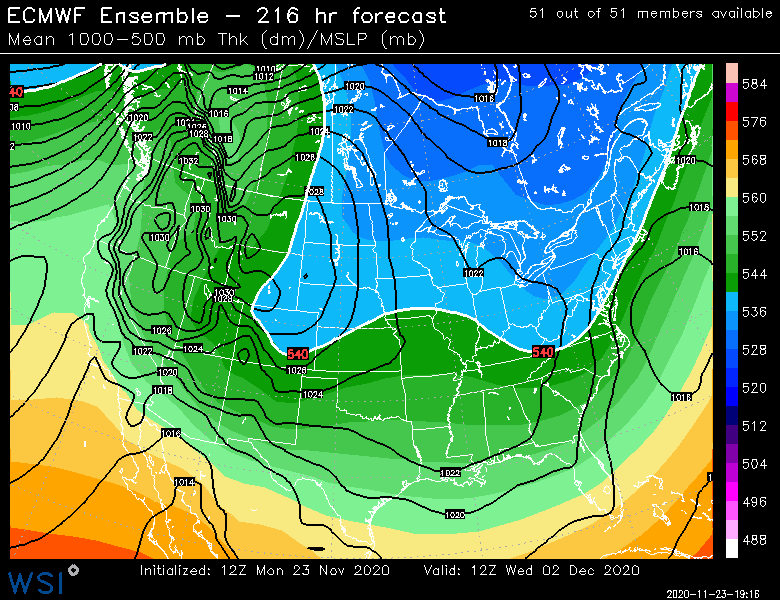
Funny, the Euro is trying to thread the needle the first few days of December. It's an unlikely scenario, but you can sort of see how it would be done....timing the southern stream with a northern stream wave, and that will be marginally cold enough. EPS show a hint of it too.
-
This is actually how December 1975 turned good for New England after starting off the month like garbage. Despite being a strong Nina, we got an Aleutian low and western ridging with a +NAO/+AO. Hopefully we can get something similar
-
This is a pretty solid look if we can reach this.....you actually have some cold replenish happening by this point. But again, this is near the end of the run....granted, it starts to look better by D12ish, but the EPS are still a little grouchier on the idea of that much amplification that soon.