eduggs
-
Posts
5,950 -
Joined
-
Last visited
Content Type
Profiles
Blogs
Forums
American Weather
Media Demo
Store
Gallery
Everything posted by eduggs
-
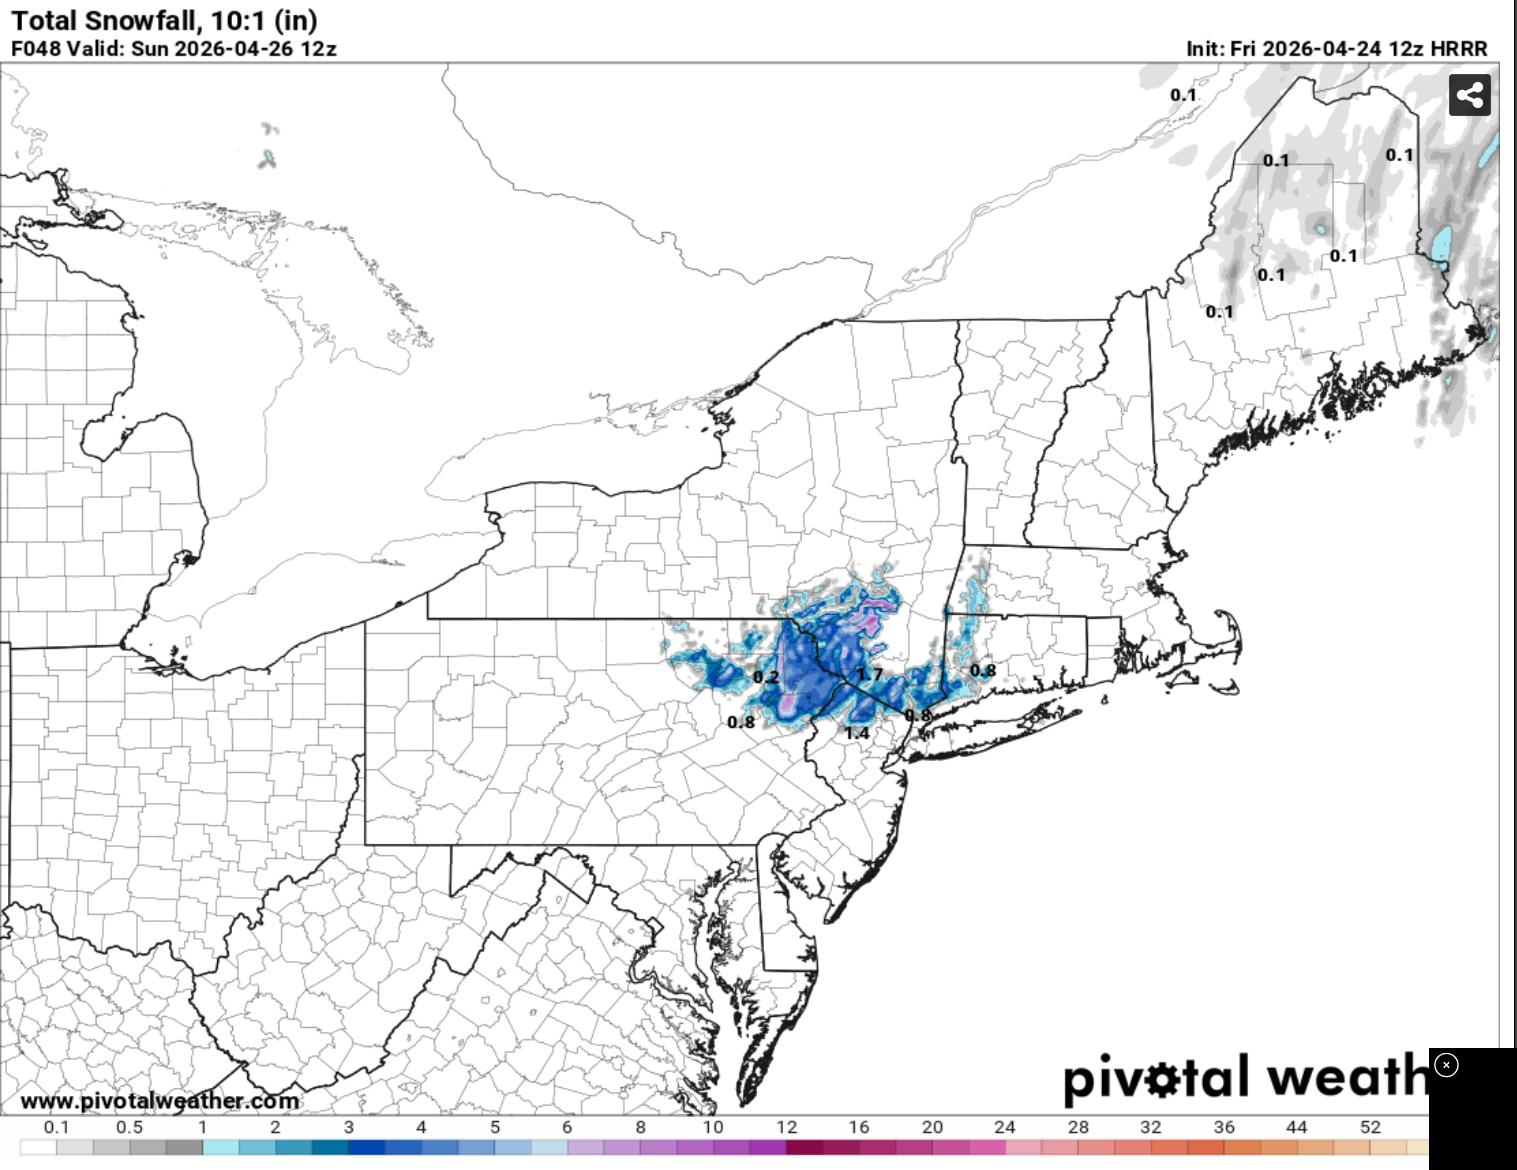
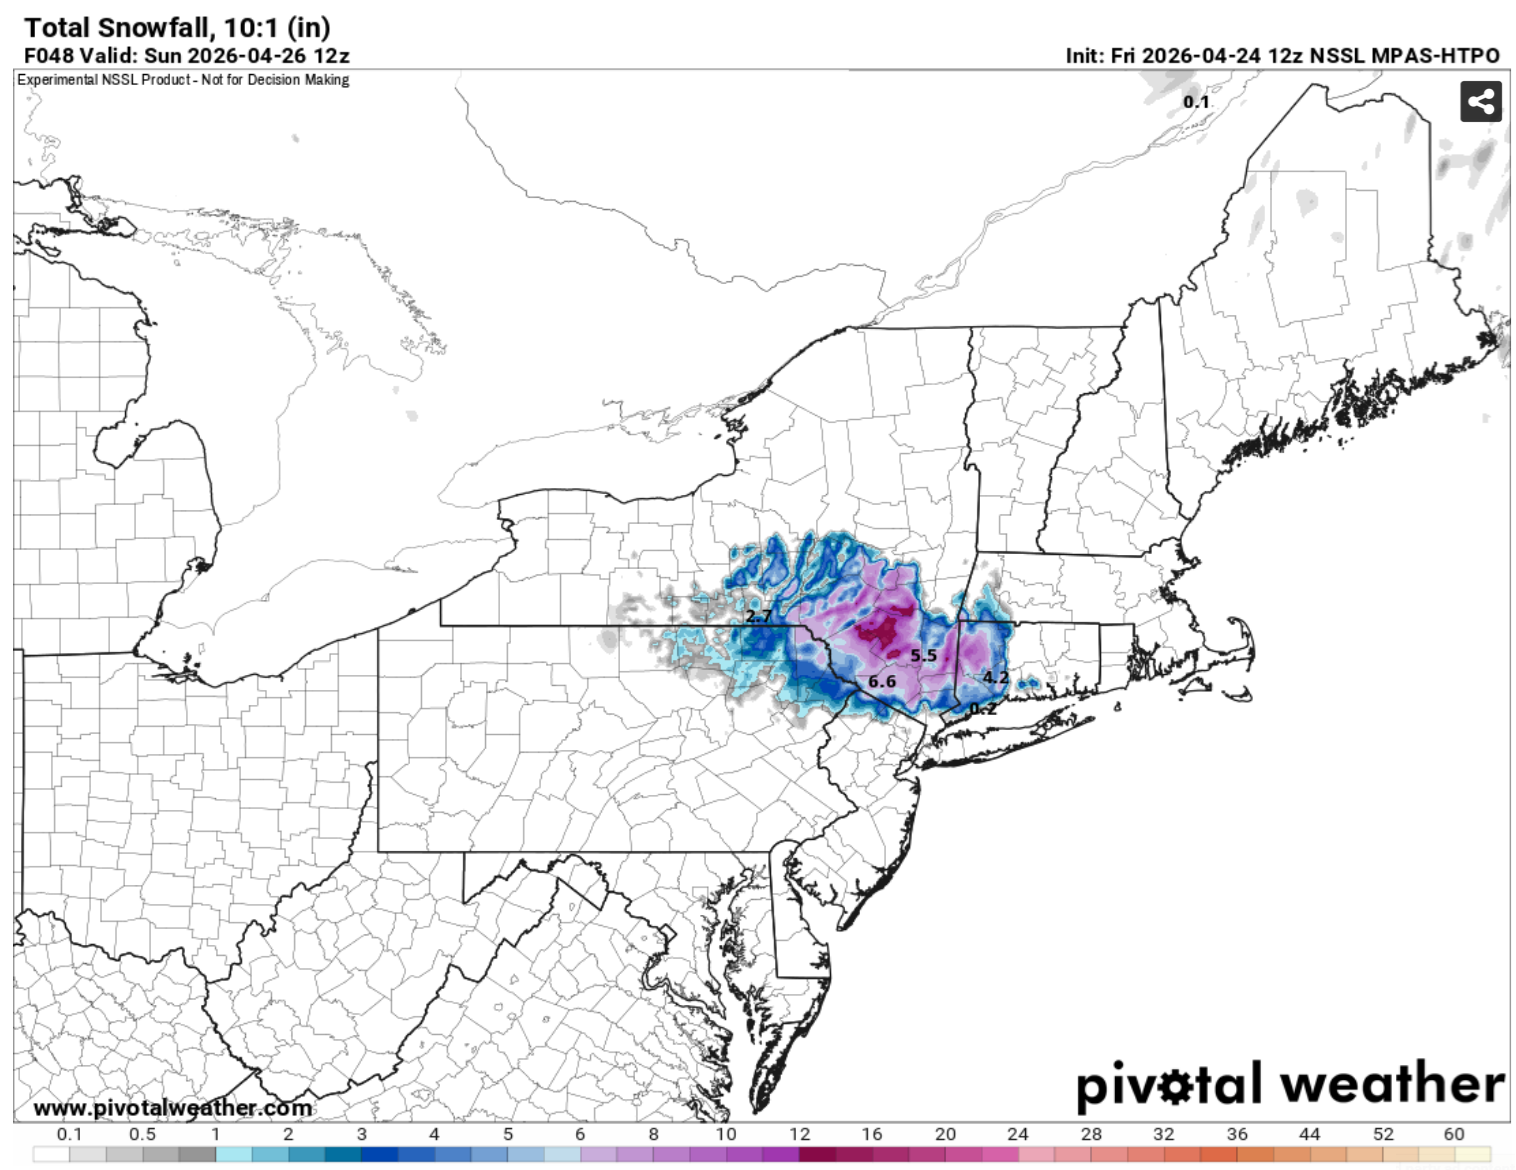
Several of the CAMs show snow in the Hudson Highlands and NNJ ridge tops Sat night into Sun morning. There's a pretty impressive CAD/low-level cold drain setting up. The warm boundary layer is the only thing preventing flakes below 1000ft but at least one model - the MPAS - says F-that... let's snow to the valley floor. Anybody think this could bring a wintry surprise for the N&W crew? Based on cold 925mb temps and some pretty strong lift, I think flakes down to 1000ft or even lower are likely but right now I expect light accumulations to be primarily above 2000ft. And probably 4-6"+ across the Catskill high peaks for the hiking crowd.


- 970 replies
-
- 1
-

-
- april showers bring may..
- rain
- (and 2 more)
-
Monday was the better shot at snow. The ceiling for Tuesday is much lower and the duration, much shorter. But we might be finally setting up for a rainy period.
-
It started chilly this morning and the airmass starts fairly seasonable and we're still going to tickle 50 today and possibly eclipse it tomorrow under full sun. That's late February for you. It almost always feels warmer than expected this time of year when the calendar still reads winter but we've forgotten how warm this time of year actually feels in sunshine.
-
Biggest snowstorm in years and yet it somehow feels a little disappointing considering totals 10 miles east.
-
Newark has reported 12 hours of heavy snow and counting. I'm probably 20 miles from the airport and have had 0 hours of heavy snow. I hate this storm lol. Seriously anybody getting the goods today needs to get outside and walk around in it. I'm older than most of you and I've never personally experienced a 20" snow event... always in the wrong place at the wrong time. These events are not common.
-
Looks like Caldwell, NJ reported only 1 hour of heavy snow. Sussex only reported 2 hours of moderate snow. Rates just never really got going in N&W NJ. The bands never quite rotated far enough around. A far cry from the NWS forecast discussion language from 36 hours ago.
-
Running a net negative on snow depth out this way since I measured at 7:30am. Temperature approaching freezing now with lots of dripping. The middle of the storm was great but the ending third has been disappointing. The duration of accumulating snow here was about 12-14 hours. It was looking closer to 20 hours plus back this way a day or two ago. We'll get ours one of these years.
-
Picked up a half inch since 7:30am. It's painful looking at that heavy band just a few miles to the east. I was really hoping for some heavier stuff during daytime.
-
I was away for a few events so I'm not sure. I typically track close to Morristown but a few inches more long-term average. It's gotta be in the 40-50" range. Best season in a while for sure. It just feels like we left a lot on the table. Like synoptically, we weren't far off from an 80" season. I wasn't living in NJ in 2017-2018, so I've never seen a snowy winter IMB.
-
The NBM and the western leaning models were too aggressive, especially a day or two ago. But the eastern-most models were too dry/east.
-
This has been one of those winters where the stats say it's been a solid winter, but places to the east have consistently cashed in more on every event, which sours it just a touch. It would probably have been better not to check this forum or the radar.
-
Enjoy it! You are on the snowy side of the gradient.
-
Bummer for metro west. Looking at radar, it looks like the City is in a solid band. Congrats! Just flurries/light snow out this way. NYC East Winter.
-
Central Morris County: 14.5", 29.2F. The snow tapered off about an hour ago? It seems early to be over. Not quite historic and not as fun here in NJ as the Jan 25th event was visiting up in Putnam and Dutchess Counties due to less favorable timing and warmer temperatures, but still a really enjoyable event!
-
Central Morris County: 5" since accumulations began around 5pm. 30.0F. I cleared the snow board for the first time at 11pm. The temperature is a little warmer and the snow consistency a little wetter than I expected. The visibility has also been a bit higher than typical for big snow events - generally above 0.5mi - which is probably related to the relatively warm temperatures. Snowfall rates have been a little above 1" per hour for the past few hours.
-
That 01z HRRR run shows a lot less QPF for western NJ and EPA than modeling I saw a day or two ago. I hope it's wrong but radar returns are indeed having difficulty pushing west into PA.
-
Central Morris County: 2.75" OTG. 30.5F. 1.25" in the past hour. I just went for a long snow walk. It's a glorious evening and blissfully quiet. Most people are inside their cozy homes avoiding the snow. They don't know what they're missing. I've intentionally avoided looking at models for the past day to try to enjoy this snow event as it comes. It's definitely not snowing gangbusters at the moment and so far the event isn't giving off the characteristic feel of an historical event. Hopefully that changes later tonight. Even this solid but unspectacular rate should be good enough to achieve double digits. I'm hoping the good banding doesn't shift too far east.
-
Excitement is definitely warranted IMO. But just a little bit of caution to keep the discussion grounded. That 2" liquid to NYC includes about 0.3" from today. And the 6z GFS had more QPF a little further west into PA than 12z.
-
The AIGFS continued a multi-run improving trend and the GFS was another excellent run... but it was actually slightly east of 6z with mid-level and surface lows. Reading the descriptions before checking the model, I expected an improvement. I think unfortunately people mostly just look at the QPF for their backyard when interpreting a model run. Anyway, a minor wobble in an OP run is just noise. The consistency of the GFS, especially considering other model trends, is very encouraging.
-
The airmass today is actually pretty cold - seasonably cold at least. And yet the warmer spots in the City will tickle 50 and places like Poughkeepsie and Hartford will near or exceed 40. Classic winter feel in the mountains with springtime in the valleys.
-
I thought your language was good. And I'm not trying to talk down - there's plenty I don't know. It's just that at quick glance the plot and summary give the impression that warmer temps cause less snow.
-
I would advise caution here against a misinterpretation of the data. The statistical definition of "explains" means correlation. It is not the same thing as the plain English language understanding of "explains" that implies causation. All we can say from the data is that warmer winters are correlated with less snowy winters. And about half of the correlation can be accounted for by the correlation. But hypothetically, if the root cause is not warm temperatures, but something else related to both variables - say "unfavorable storm tracks" the data might still look exactly like that. In this scenario, a 3rd variable would be causing both warming and less snow even if there were no causal connection between them. I'm not arguing that this is the case... just that we can't really say what is "driving" the decrease in seasonal snow at State College. With this kind of statistical test we can only identify correlations. As an engineer and hydrologist I am a stickler for analytical preciseness. I'm not saying you don't know this. But some might come away believing that State College gets less snow these days because its local climate has warmed
-
Verbatim one of the best 10-day runs of the season. Several snow threats in there. But there are no slam dunks or easy wins in that run. Could be several hits or several misses. Low margins as usual. Before I get excited about the mid- or long-range I'm pulling for a 2-4" event Sunday night.
-
The Ukie is north of 12z too. Gets precipitation to CNJ and tickles the City. Looks better aloft too.
-
It's kind of an interesting scenario because just about all models are trending towards a better phase if you cycle the past 4 runs or so. Even the RGEM and NAM which don't look great at the surface. QPF increases dramatically among the individual ensemble members based on degree of phasing. But as is right now the model consensus is still miss or fringe.