

Chicago Storm
-
Posts
18,169 -
Joined
-
Last visited
Content Type
Profiles
Blogs
Forums
American Weather
Media Demo
Store
Gallery
Posts posted by Chicago Storm
-
-
0.9” of snow at ORD thus far today.
That 0.9” plus the 0.3” on the month going into today brings the monthly total to 1.2”, which knocks this December out of the top 10 least snowy.
.-
 3
3
-
-
Solid meso-low tonight on the western shore of Lake Michigan, between Manitowoc and Algoma, WI.

.-
 3
3
-
-
the useless cfs, posted with love for our wisconsin brethren…


.-
7
-
-
S WI, E IA and NW IL will end end up the winners with this second round.
Should end up with advisory level snowfall accumulations in that corridor.
. -
Someone around the MO/IL border area (Near STL) is going to end up with advisory level snow accumulation when all is said and done with this first wave.
Looks like a corridor of 1-3” occurred across Southwestern and Southern Illinois.
. -
Wake up, loop euro, nothing cooking, post some zzzzzs, repeat
might be time you take a break.
.-
5
-
2
-
-
22 minutes ago, DocATL said:
This is incomplete information. I would expect a pattern change but not until the end of January. We will have to get through the warm MJO phases. The PV likely goes to Europe as it seems that is the hot hand in recent years.
.The pattern change is already occurring, with additional evolution likely with time.
-
3
-
-
Someone around the MO/IL border area (Near STL) is going to end up with advisory level snow accumulation when all is said and done with this first wave.
-
4 hours ago, DocATL said:
Might be interesting tomorrow morning if our fetch here in Naperville is more NNE than NE.
.The metro is out of the game most likely.
The occluding-stacked low is wrapping in a tongue of mild temps, enhanced by the mild lake.
-
1
-
-
7 minutes ago, Spartman said:
Some of you need to lay off of the trash sources.
-
3
-
 1
1
-
-
Sneaky potential across portions of IA/IL/MO/WI the next few days…
A big gyre-y mess of a nearly stacked low moving through the region, with several vorts/disturbances spiraling around it.
Should see a few distinct time periods with rain/snow potential. First across MO/IL Wednesday morning through Thursday morning, and then across WI/IL/IA Thursday morning through Friday morning. Both periods look likely to feature minor snowfall accumulation for some areas.
.-
3
-
-
15 hours ago, OHweather said:
Wanted to lay out some things happening with some larger scale pattern drivers now and over the next few weeks and look at how they may impact chances for cold and snow potential. Chicago Storm's post on the prior page touched on most of these things. Behavior of the Pacific jet and potential for high latitude blocking will determine much of how this goes...something that can probably be said most of the time in the winter months.
Solid stuff.
I forgot to mention anything regarding the mountain torque evolution, so it's good you had a big mention of that.
-
2
-
1
-
-
The final numbers on the mild Christmas for Chicago...
•Tied 8th warmest max temp on Christmas Eve.
•3rd warmest min temp on Christmas Eve.
•2nd warmest max temp on Christmas Day.
•Warmest min temp on Christmas Day.
•5th wettest Christmas Day.Top 10 Warmest Christmas Eve Max Temps
1. 64 - 1889
2. 62 - 1982
3. 59 - 1877
4. 58 - 1932
4. 58 - 1893
4. 58 - 1875
7. 57 - 2021
8. 55 - 2023
8. 55 - 2019
10. 54 - 1936
10. 54 - 1895Top 10 Warmest Christmas Eve Min Temps
1. 51 - 1982
2. 49 - 1877
3. 48 - 2023
4. 46 - 1893
4. 46 - 1889
6. 40 - 1888
7. 39 - 1931
8. 38 - 1932
9. 37 - 1979
9. 37 - 1875Top 10 Warmest Christmas Day Max Temps
1. 64 - 1982
2. 59 - 2023
3. 57 - 2019
4. 56 - 1936
4. 56 - 1895
6. 55 - 2021
6. 55 - 1971
8. 52 - 1994
8. 52 - 1893
8. 52 - 1891Top 10 Warmest Christmas Day Min Temps
1. 50 - 2023
2. 46 - 1936
3. 42 - 1940
3. 42 - 1877
4. 37 - 2019
6. 36 - 1982
7. 35 - 1957
7. 35 - 1941
7. 35 - 1888
7. 35 - 1881Top 10 Wettest Christmas Day's
1. 0.50" - 1950
1. 0.50" - 1909
3. 0.47" - 1982
4. 0.46" - 2009
5. 0.39" - 2023
6. 0.38" - 1957
7. 0.35" - 1973
7. 0.35" - 1949
9. 0.34" - 1965
9. 0.34" - 1879
9. 0.34" - 1877-
2
-
1
-
-
As expected, cracked the top 10 or top 5 on every list...
•Tied 8th warmest max temp on Christmas Eve.
•3rd warmest min temp on Christmas Eve.
•2nd warmest max temp on Christmas Day.
•Warmest min temp on Christmas Day.
•5th wettest Christmas Day.Top 10 Warmest Christmas Eve Max Temps
1. 64 - 1889
2. 62 - 1982
3. 59 - 1877
4. 58 - 1932
4. 58 - 1893
4. 58 - 1875
7. 57 - 2021
8. 55 - 2023
8. 55 - 2019
10. 54 - 1936
10. 54 - 1895Top 10 Warmest Christmas Eve Min Temps
1. 51 - 1982
2. 49 - 1877
3. 48 - 2023
4. 46 - 1893
4. 46 - 1889
6. 40 - 1888
7. 39 - 1931
8. 38 - 1932
9. 37 - 1979
9. 37 - 1875Top 10 Warmest Christmas Day Max Temps
1. 64 - 1982
2. 59 - 2023
3. 57 - 2019
4. 56 - 1936
4. 56 - 1895
6. 55 - 2021
6. 55 - 1971
8. 52 - 1994
8. 52 - 1893
8. 52 - 1891Top 10 Warmest Christmas Day Min Temps
1. 50 - 2023
2. 46 - 1936
3. 42 - 1940
3. 42 - 1877
4. 37 - 2019
6. 36 - 1982
7. 35 - 1957
7. 35 - 1941
7. 35 - 1888
7. 35 - 1881Top 10 Wettest Christmas Day's
1. 0.50" - 1950
1. 0.50" - 1909
3. 0.47" - 1982
4. 0.46" - 2009
5. 0.39" - 2023
6. 0.38" - 1957
7. 0.35" - 1973
7. 0.35" - 1949
9. 0.34" - 1965
9. 0.34" - 1879
9. 0.34" - 1877-
2
-
-
Zzzzzz
On to February
lol.
.-
1
-
-
Seeing how we are only almost three days into winter, I would hold off on grading the whole winter at this point. Still have January and February to go yet.
we all know that astronomical seasons are nonsense.
.-
1
-
-
The gyre of a storm system moving across the country the next few days is pretty much the lead-in to the new pattern.
Going to end up with a solid snowstorm (Blizzard?) across portions of the Northern/Central Plains, something that has been lacking out there this season so far.
-
3
-
-
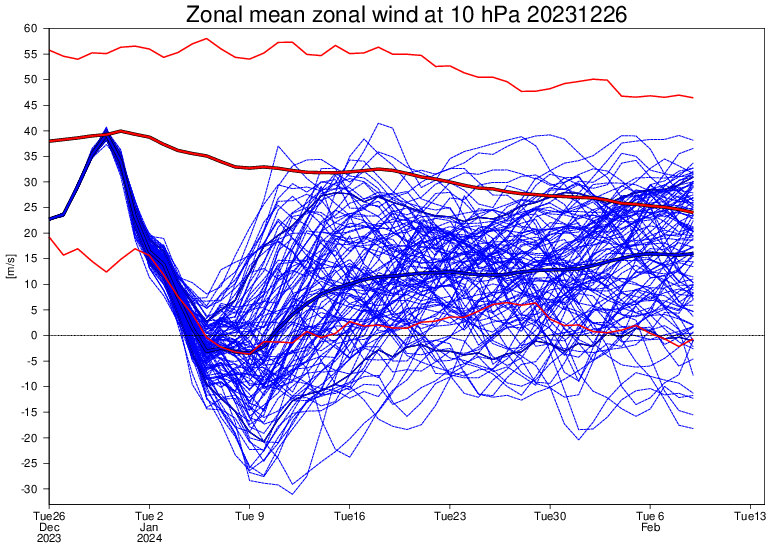
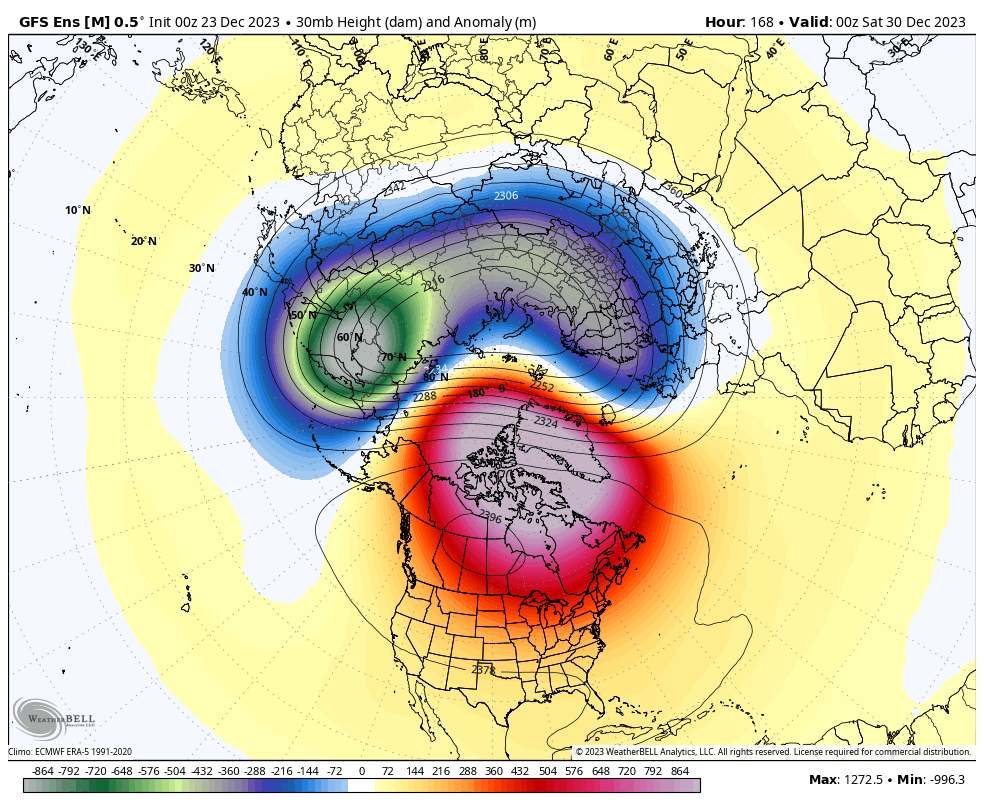
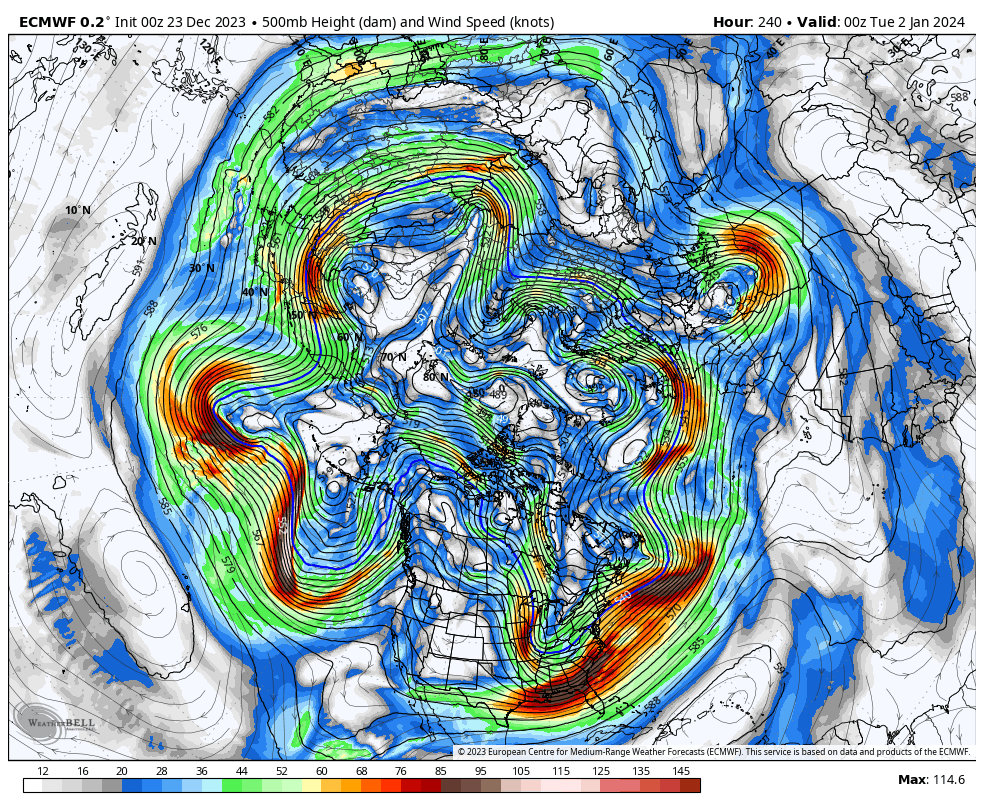
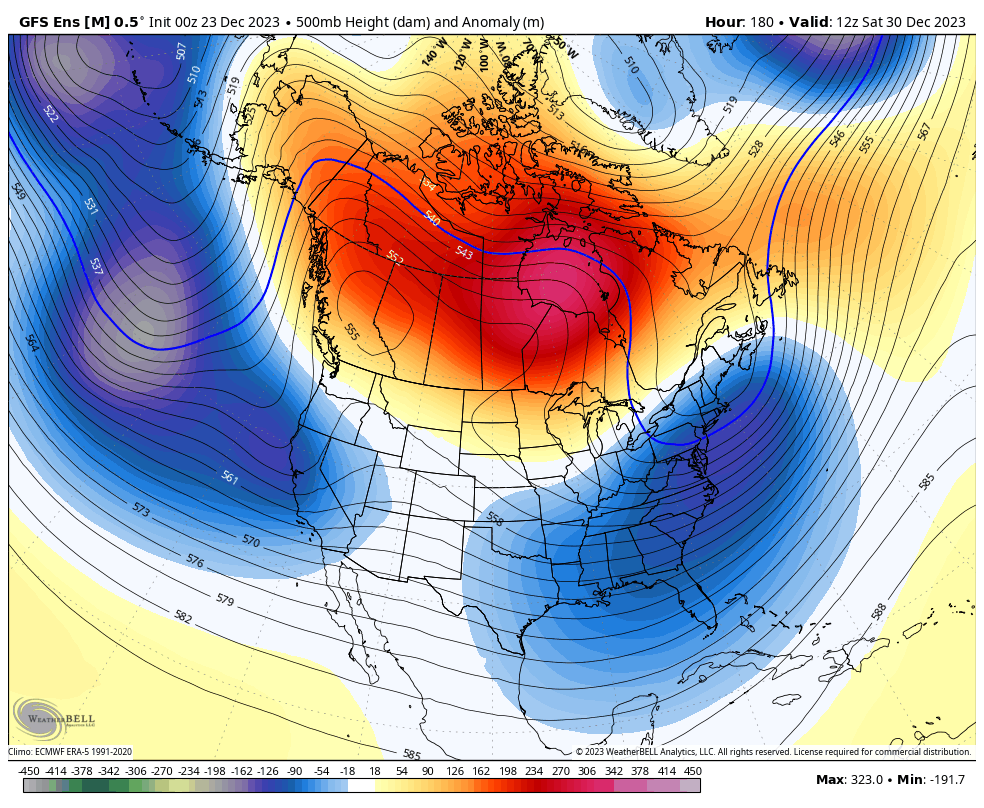
As has been mentioned, we are heading into a significant pattern change. Changes on the large scale really start to appear this weekend and into the beginning of this upcoming week. This new pattern, which may very well evolve over time, will extend through the first 1/3rd of January, and quite possibly the first 1/2 of January.
Two big changes that we are seeing right off the bat and that have already begun are a progression of the MJO into the colder phases and a stratospheric warming event. The MJO recently entered the COD, after being in low-amplitude warmer phases from the very end of November through the first 2/3rds of December. The trip through those warmer phases is one of several reasons (Raging Pac Jet is another) that we have been stuck in a consistently mild (Sometimes very mild) regime. The MJO has now entered a colder phase, low amplitude phase 8, and is expected to make a trip at lower amplitude roughly through colder phases 1-2 over the next 1-2 weeks. Another thing that we will be watching unfold is stratospheric warming. This event is expected to disrupt the main SPV placement and strength during the potentially 1-3 week event. As is usually the case, any effects of the SSWE will not be seen right away; that is something to keep an eye on from around week 2 in January through early February.
.png.3a89226efde1d366c1eaa9979c7493ee.png)

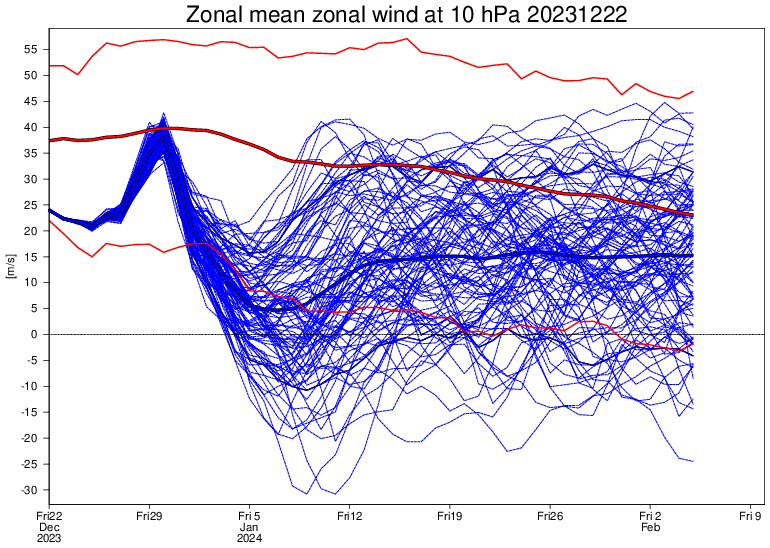
As mentioned above, there are a few reasons we have been seeing consistently mild (Sometimes very mild) conditions over the past several weeks. The raging Pacific jet is one of those bigger reasons. The Pacific jet is expected to break down soon, with increased troughy-ness (Wave breaks) developing. Canadian ridging, which will retrograde from Central to Western Canada and eventually Alaska, will also tend to lower Pacific influence as well.

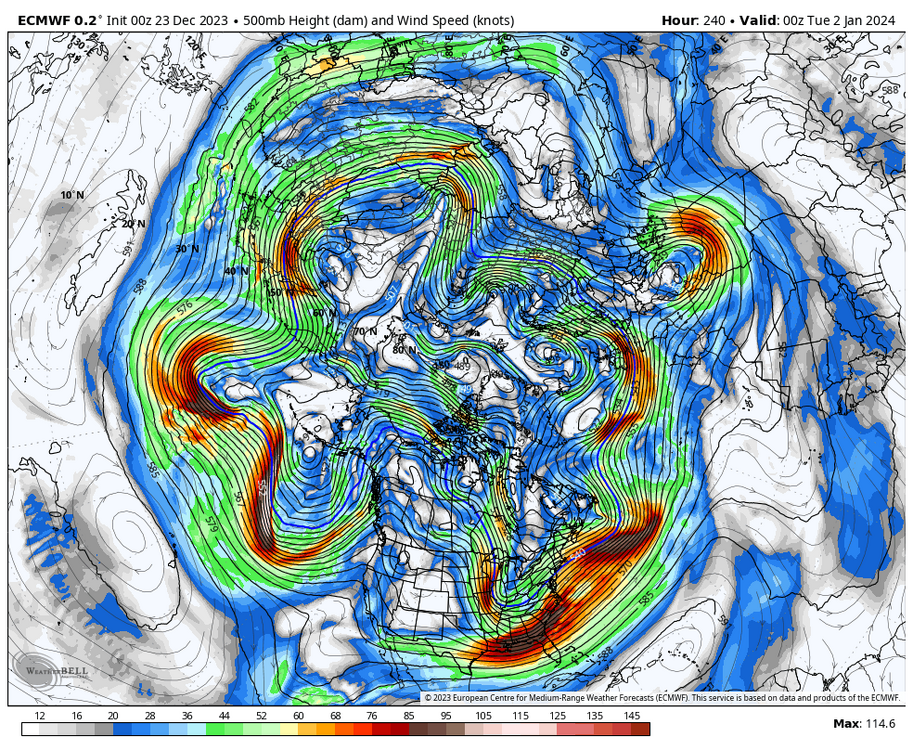
Getting beyond the MJO, SSW and Pac jet... We are likely to see a fairly consistent flow of waves/disturbances/troughs enter the CONUS along the West Coast, originating from the deep/mean trough from the Aleutians down into the Northeast Pacific. This is characterized by the lower-height anomalies from the Northeast Pacific and then across the southern 2/3rds or so of the CONUS. Additionally, with the Pacific jet breaking down and the retrograding ridging in Canada, this will lead to generally cooler/colder conditions overall than have been seen, with an airmass origin more often than not from the Northeast Pacific to Pole regions.
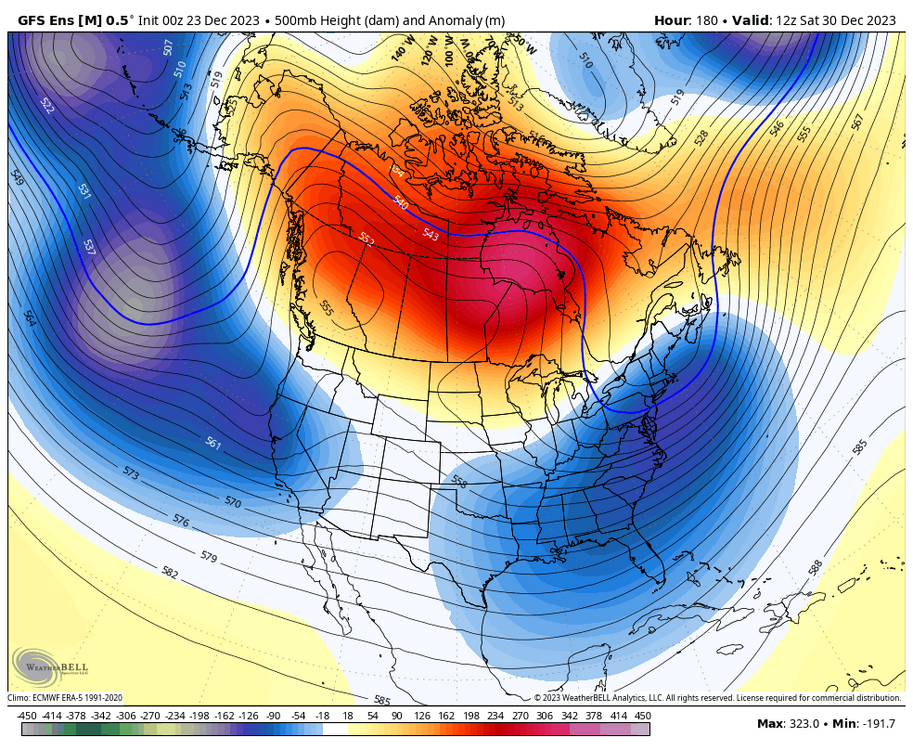
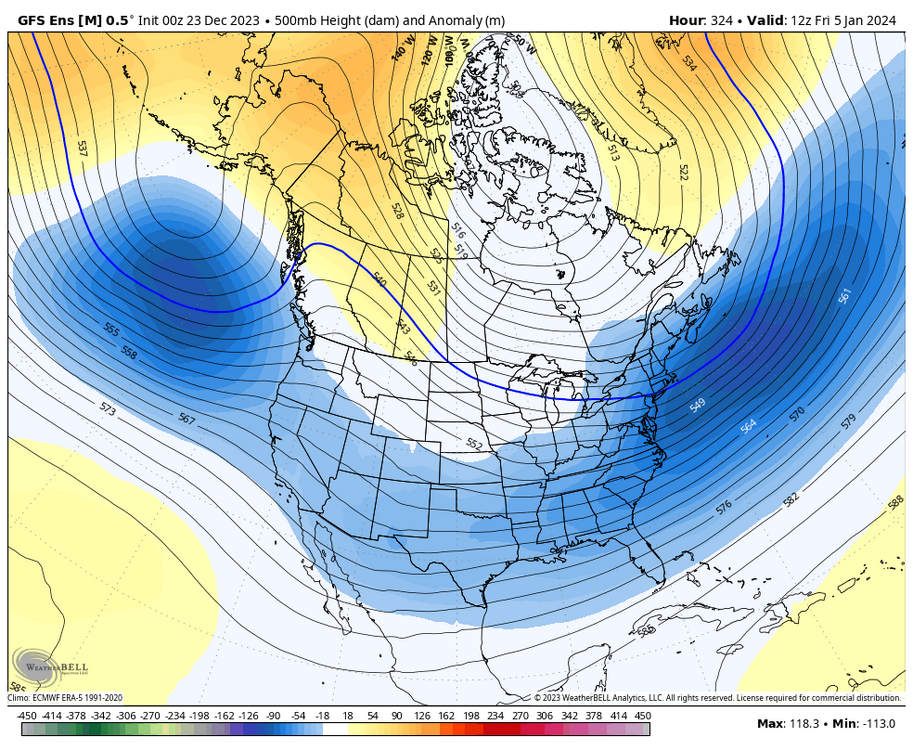
All in all, with this pattern change...
-While it may not be super/hyper active, there will be a steady stream of disturbances that traverse the CONUS. Will they all turn into something interesting? No. But having a feed is a start.
-It is very clearly not going to be as significantly/consistently as mild as it has been. That's not to say there won't be any bouts of mild temperatures, but what we have been seeing will be in the past for now.
-The chances for wintry storm potential are not amazing, but definitely an improvement compared to much of the past 1-2 months.-
18
-
5
-
1
-
-
Cross-posting from the Chicago record thread...
A few stats to watch for Chicago, for Christmas Eve and Christmas Day. Top 10, if not top 5, a lock for pretty much each list.
Warmest Christmas Eve Max Temps
1. 64 - 1889
2. 62 - 1982
3. 59 - 1877
4. 58 - 1932
4. 58 - 1893
4. 58 - 1875
7. 57 - 2021
8. 55 - 2019
9. 54 - 1936
9. 54 - 1895Warmest Christmas Eve Min Temps
1. 51 - 1982
2. 49 - 1877
3. 46 - 1893
3. 46 - 1889
5. 40 - 1888
6. 39 - 1931
7. 38 - 1932
8. 37 - 1979
8. 37 - 1875Warmest Christmas Day Max Temps
1. 64 - 1982
2. 57 - 2019
3. 56 - 1936
3. 56 - 1895
5. 55 - 2021
5. 55 - 1971
7. 52 - 1994
7. 52 - 1893
7. 52 - 1891
10. 50 - 1940
10. 50 - 1877Warmest Christmas Day Min Temps
1. 46 - 1936
2. 42 - 1940
2. 42 - 1877
4. 37 - 2019
5. 36 - 1982
6. 35 - 1957
6. 35 - 1941
6. 35 - 1888
6. 35 - 1881
10. 34 - 1973
10. 34 - 1923
10. 34 - 1913
10. 34 - 1891Wettest Christmas Day
1. 0.50" - 1950
1. 0.50" - 1909
3. 0.47" - 1982
4. 0.46" - 2009
5. 0.38" - 1957
6. 0.35" - 1973
6. 0.35" - 1949
8. 0.34" - 1965
8. 0.34" - 1879
8. 0.34" - 1877-
2
-
-
A few stats to watch for on Christmas Eve and Christmas Day. Top 10, if not top 5, a lock for pretty much each list.
Warmest Christmas Eve Max Temps
1. 64 - 1889
2. 62 - 1982
3. 59 - 1877
4. 58 - 1932
4. 58 - 1893
4. 58 - 1875
7. 57 - 2021
8. 55 - 2019
9. 54 - 1936
9. 54 - 1895Warmest Christmas Eve Min Temps
1. 51 - 1982
2. 49 - 1877
3. 46 - 1893
3. 46 - 1889
5. 40 - 1888
6. 39 - 1931
7. 38 - 1932
8. 37 - 1979
8. 37 - 1875Warmest Christmas Day Max Temps
1. 64 - 1982
2. 57 - 2019
3. 56 - 1936
3. 56 - 1895
5. 55 - 2021
5. 55 - 1971
7. 52 - 1994
7. 52 - 1893
7. 52 - 1891
10. 50 - 1940
10. 50 - 1877Warmest Christmas Day Min Temps
1. 46 - 1936
2. 42 - 1940
2. 42 - 1877
4. 37 - 2019
5. 36 - 1982
6. 35 - 1957
6. 35 - 1941
6. 35 - 1888
6. 35 - 1881
10. 34 - 1973
10. 34 - 1923
10. 34 - 1913
10. 34 - 1891Wettest Christmas Day
1. 0.50" - 1950
1. 0.50" - 1909
3. 0.47" - 1982
4. 0.46" - 2009
5. 0.38" - 1957
6. 0.35" - 1973
6. 0.35" - 1949
8. 0.34" - 1965
8. 0.34" - 1879
8. 0.34" - 1877 -
No I said our climate will be able to support in ground palm trees in 30 years. Not warming 30 degrees.
we already have them in-ground.
. -
On 12/15/2023 at 8:23 PM, Chicago Storm said:
Though, including some significant stratospheric warming on deck. Will touch on that early next week...
Will finally have something up tomorrow, but a few key points...
-The pattern is changing, and significantly at that.
-It is very clearly not going to be as significantly/consistently as mild as it has been.
-There will be a steady/consistent flow of waves/disturbances moving into the Western US, and then across the country.
-The chances for wintry storm potential are not amazing, but definitely an improvement compared to much of the past 1-2 months.
-A SSWE is most definitely going to occur, with the effects TBD in the weeks after it occurs.
-The MJO will make a 1-2 week pass through colder phases.
-The raging Pacific jet is likely to break down to some degree.-
7
-
1
-
-
7 hours ago, A-L-E-K said:
about as bad as it gets
february will be rocking
There will be opportunity in January.
-
3
-
3
-
-
Top 5 warmest high, top 5 warmest low and top 5 wettest Christmas for Chicago is within reach based on current guidance.
-
4
-


Winter 2023/24 Medium/Long Range Discussion
in Lakes/Ohio Valley
Posted
Beat me to it, as I was going to type up something while I’m the train this afternoon heading downtown.
This is the first evolution of the new pattern, which some may even consider a new pattern in itself. Winter lovers, your time has come. I’ll be boxing up the palm tree this week.
One tidbit of note is that we will be falling short of SSWE “criteria”. But it doesn’t even matter in the end, given the substantial amount of warming and disruption there currently is and will continue to be for a while. As you mention, the high latitude blocking is being shown consistently (And at times fairly significant looking), and the effects of the warming appear as though they will be real.
.