

so_whats_happening
-
Posts
1,485 -
Joined
-
Last visited
Content Type
Profiles
Blogs
Forums
American Weather
Media Demo
Store
Gallery
Everything posted by so_whats_happening
-
2024-2025 La Nina
so_whats_happening replied to George001's topic in Weather Forecasting and Discussion
I really don't have the time to get into a back forth about something that can be read through many journals. You realize it takes time for it to translate vertically right? This was not an instantaneous event nor was it ever advertised to be. Yes there is always a possibility that the east doesn't get significantly colder never mentioned once in my post that it would get significantly colder because of the warming event, maybe you inferred it differently because I said winter-like pattern? -
2024-2025 La Nina
so_whats_happening replied to George001's topic in Weather Forecasting and Discussion
I think we need to stop expecting every single warming event to be a major SSW I don't know why everyone seems to think that a warming event must be a reversal for us to get a winter like pattern. These reversals happen on average 2-3 times a decade based on averages, sometimes more sometimes less. A weakening of the SPV was enough to bring us some impressive cold conditions without a reversal. A reversal just extends the amount of time one of these events lock the pattern but it doesn't need to reverse in order to cause a changeup. -
2024-2025 La Nina
so_whats_happening replied to George001's topic in Weather Forecasting and Discussion
I do like that we saw a large spike in the MJO phase 3 this is usually a precursor to these type of events to unfold. From the looks of it we have a weakening MJO wave as it pushes into 4/5/6 and eventually 7 by about mid February. The key will be how quickly all this moves through the phases, I have a feeling we may start to halt MJO progression as we get to phase 6 and eventually 7 but how quickly we move through 4/5 will how warm the east gets. The active storm track that looks to set up may create quite the boundary across the country with the SE to Texas rather warm and mid atlantic ohio valley battling it out. Lets see what happens, one more bout of winter could bring us awfully close to seasonal average (maybe above depending on quite a few factors).
-
2024-2025 La Nina
so_whats_happening replied to George001's topic in Weather Forecasting and Discussion
Looks like on the horizon (to about hr 240) we have yet another solid warming event taking shape in the stratosphere. We can not seem to link up both the Atlantic and Pacific ridging patterns so gotta take what we can get. This may on the level of what we saw about a month ago placement is a little off compared to the last go about but have to see how it eventually translates to the surface. Usually this time of year these connections start to become quicker in the overall affect to the 500mb pattern, I believe Stormchaserchuck may have mentioned it once or twice before. You know something is up when surface temps on the Euro in all high latitude locations start to show +20 to +30 anomalies. It looks as though the Euro may actually be trying to do a bottom up split of the SPV one caveat here is it may not fully translate to about 10mb splitting which is fine because it can still disrupt the pattern at 500mb if such a response occurs. Lets see how it translates over the next week. This would lead to a second half of February into early March not being as canonical. Everything seems to be going according to plan though where we have averageish temps to finish out the last week of January and the first week of February average to above average. Depending on storm track some areas do look to have a 1 day spike in temps to well above average but to pinpoint when and where at this time is a tough call.
-
2024-2025 La Nina
so_whats_happening replied to George001's topic in Weather Forecasting and Discussion
Such a shame to read this but this sounds like a training issue in measuring. As a weather observer, we go through training every season/ monthly (depending on what training is needed) to refresh what may come our way. Sounds to me like they did an end of system measurement versus an hourly which would offer a completely different outcome for totals. This is an SWO/Contractor issue that will be looked into because someone will be on the line for such erroneous measurements. This tends to be an issue that comes up in areas that don't experience certain weather conditions. Since the deep south typically does not experience a lot of wintry precip and if this happens to be a newer individual that would make sense. Just like further north around here we get thunderstorms but not often hail or tornadic systems so the training is important. Also as another aside the equipment being used is very old in most locations with no plans of upgrades anytime soon, if they upgrade it would be AI generated (whenever this comes about) unless it is absolutely necessary to upgrade. Hope it gets resolved properly. Edit: just saw the part it is unmanned that would mean either two things it would be a local EMS location that undertakes that role which is probably not properly trained to do procedures like this or it was a tower individual at that location doing the obs which they should know at least a little bit better but can't get on them as they are ATC not weather. This may be an issue that arises down the road if cuts do at some point come to airport weather programs (we will see what happens). If there was no auto during those times it was being monitored by someone which most likely would have been ATC then. -
2024-2025 La Nina
so_whats_happening replied to George001's topic in Weather Forecasting and Discussion
Yea with this snowfall yesterday we are sitting at about a foot so far this season which is a little less than half of our yearly climo snowfall and so far on the month to month we are right near average amounts. -
2024-2025 La Nina
so_whats_happening replied to George001's topic in Weather Forecasting and Discussion
It does look like we are finally getting poleward movement of the Scandi ridging pattern the one thing we have been missing. This is key in allowing a potential split SPV pattern down the road. Lets see what happens. -
2024-2025 La Nina
so_whats_happening replied to George001's topic in Weather Forecasting and Discussion
I feel like people see -PNA and instantly think it is all over. Not the case when you have the PV on this side of the globe, now if the PV was on the weaker side over here and more pronounced over into Russia/Siberia totally different story. This should help keep the SE Ridge/ WAR (whichever you like to call it) at bay. This would offer up a country wide cold outbreak with the deeper values into the mountains that spill east over time. I do still expect a brief time period of average temps maybe even slightly above average to occur into the first week of February as the pattern we have had relaxes a bit and sets up into this but not seeing a torch event right now. Im excited to get more precip thrown into the region and have the chances go up of potential snow then what we have been having. We need the precip as this is supposed to be one of the wetter times of the year even if it does fall as rain, unfortunately it may cause a lot of flooding if it is indeed rain since the ground would be a solid brick and most rivers and lakes are pretty frozen over at this time before the cold outbreak. -
2024-2025 La Nina
so_whats_happening replied to George001's topic in Weather Forecasting and Discussion
BTW some forecasts are already showing monday lows getting to near 0 in my area. Tuesday and wednesday morning potentially below 0? I think it will moderate a bit but single digits will be some of the coldest air we have seen in a bit. Highs in the upper teens, with some showing us barely getting above 15 as a high. -
2024-2025 La Nina
so_whats_happening replied to George001's topic in Weather Forecasting and Discussion
Looks to me like SWFE if you can get on the cold side it would be a beautiful setup. -
2024-2025 La Nina
so_whats_happening replied to George001's topic in Weather Forecasting and Discussion
Social media is killing you man, take a a step away. -
2024-2025 La Nina
so_whats_happening replied to George001's topic in Weather Forecasting and Discussion
Ill take this whatever winter pattern. Have had snow on the ground (~1") since January 3rd just refreshed with the last two systems 3" and 1.5" bringing our year total so far to about 7" on the season. This is the longest we have had snow on the ground in quite some time, yea sure it is not feet of snow but snow regardless. Still looking for one 12"+ system to end my season and Ill happily move on maybe something will get sniffed out here within the next 2 weeks. My heating bill is saying wtf is going on right now for how 'mundane' this cold pattern is. -
2024-2025 La Nina
so_whats_happening replied to George001's topic in Weather Forecasting and Discussion
This is impressive to say the least. Definitely did not expect to see this 500mb look as we approach the halfway mark through the winter season.
-
2024-2025 La Nina
so_whats_happening replied to George001's topic in Weather Forecasting and Discussion
If the trade winds forecasted continue to show west of the dateline being more anomalous than normal versus over 3 and 3.4 this will certainly keep pushing the 'Nina' waters further and further west. This will ultimately also allow for sinking air to start being more prevalent around the eastern portions of the Maritime Continent (around 5/6/7 of the MJO Phase) and a less concentrated region of lift over phase 4 region like we saw November into December. We would start to have a dual or split lifting region of 1/2/3 showing up and potentially avoiding the dreaded 4/5/6. This of course is still a few weeks out but we should start to approach close to phase 3 by the last week of January after that I am not so certain on a 4/5 swing as we go into February as many seem to be so keen on. I personally see us to have peaked with this Nina at this point unless we get some rogue constructive interference in the next 2 weeks showing up, which I have my doubts. I think what likely happens is the subsurface we currently see just maintains what we currently have and lets it slowly fade over time. These are just some thoughts popping about in my head for what could be the next 3-4weeks. On a side note this would certainly be a noteworthy situation if we somehow ended the season below average snowfall wise around here yet ended up with more snow than Boston...
-
Arctic Sea Ice Extent, Area, and Volume
so_whats_happening replied to ORH_wxman's topic in Climate Change
Thank You! -
Arctic Sea Ice Extent, Area, and Volume
so_whats_happening replied to ORH_wxman's topic in Climate Change
Anyone have sea ice thickness maps and numbers everything I have bookmarked took a crap and is not accessible. -
2024-2025 La Nina
so_whats_happening replied to George001's topic in Weather Forecasting and Discussion
Within 240 hours now is usually my go to for a strong possibility of this occurring especially with it being the stratosphere not a whole lot of fluctuation happens at that layer within 5-7 days. 10 days you can get some minor changes in position and intensity but this is looking promising. This would throw ideas of a really warm February off a bit considering the connection of strat to 500mb. -
2024-2025 La Nina
so_whats_happening replied to George001's topic in Weather Forecasting and Discussion
Wait wait so CDAS is ok to use now? -
Congrats @wxallannj! Great forecasting
-
DCA _ NYC _ BOS __ ORD _ ATL _ IAH ___ DEN _ PHX _ SEA -4.4 -3.1 -2.6 -3.7 -5.1 -1.6 -1.2 +2.8 +1.5
-
2024-2025 La Nina
so_whats_happening replied to George001's topic in Weather Forecasting and Discussion
Also models have backed off the SSW wave 2 response, such a bummer. They seem to be pointing toward a very strong wave 1 response similar to what we had last year as we go into mid month. With that type of response I do not see it breaking the SPV just significantly weakening it and maybe allowing for maybe a reversal (major warming) event to take place. Once the warming wanes the SPV should still be intact and probably some regaining of strength into February which could reverse the course of what we are seeing at 500mb currently but this is far to ahead of the game to know for sure, plus being close to the end of the season my mindset kind of says so what? Lol Until then we are seeing a different response at 500mb last year to the current SSW setup so hopes are we don't go uber torch but honestly I feel I would be fine with one solid snow event (12"+) for the season and move on. Enjoy the snow and cold that comes over the next 2-3 weeks, fingers are crossed. Happy New Year everyone! -
If you need any help feel free to reach out via DM's ill post my prediction tomorrow. Happy New Year!
-
2024-2025 La Nina
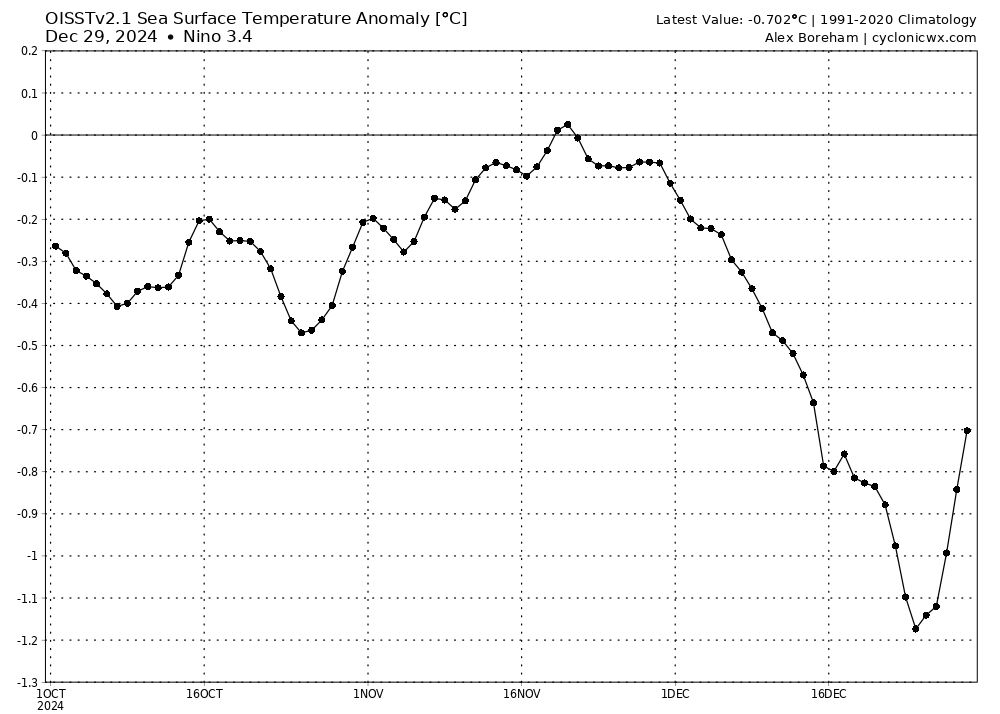
so_whats_happening replied to George001's topic in Weather Forecasting and Discussion
Quick update while im on vacation/ holiday but here is the TAO depiction of subsurface. Pretty strong moves to a La Nina state. As expected 3.4 has stabilized and has since risen a bit via OISST numbers. I do not expect these to rise too much more and stabilize out again around -.6 ish area. There does seem to be some extended period coming up here of weakened trades through about the 20th that will help relax the Nina flex a bit. It does look like we are building a subsurface warm pool in the proper area for potentially a light Nino setup next year, remains to be seen of course..thumb.gif.6c6ea3f948535bab4042b5058ccbdf25.gif)
-
2024-2025 La Nina
so_whats_happening replied to George001's topic in Weather Forecasting and Discussion
Im sorry but the CFS has not been the most accurate for MJO forecasts not as bad as BOMM but not great. The model has consistently shown the MJO wave wayyy to strong in fact it had this period we are going through now above 2 and even to 3 through both 5/6 and into some of 7. Clearly this has not been the case. Whether you like them or not the more accurate has been the Euro and JMA. They are not perfect past 5-7 days but the amplitude has been way off on RMM plots for the CFS.


.gif.b0634d0704f45fd8abf28765d7ee3210.gif)