

so_whats_happening
-
Posts
1,588 -
Joined
-
Last visited
Content Type
Profiles
Blogs
Forums
American Weather
Media Demo
Store
Gallery
Everything posted by so_whats_happening
-
2024-2025 La Nina
so_whats_happening replied to George001's topic in Weather Forecasting and Discussion
Is it possible the reduction of sulfur based fuels are finally coming home to roost? China stopped using heavily sulfur based fuels back in 2017 so it is very possible it will start to play catch up to the extreme levels we have seen in the Atlantic and continually grow with time. Time will tell of course. This will largely create even more disconnect between the tropics and subtropics over time and could very well start to show a lower overall named storm/ hurricane/typhoon count as we go through time as the atmosphere tries to rebalance itself out in this new regime. Just some food for thought while things are still kind of early for the season. -
DCA _ NYC _ BOS __ ORD _ ATL _ IAH __ DEN _ PHX _ SEA +.6 +.7 +.9 +.5 +1 +1.2 +1.5 +1.5 +1 100 98 97 95 99 102 99 117 95
-
2024-2025 La Nina
so_whats_happening replied to George001's topic in Weather Forecasting and Discussion
Just for comparison sake 97-98 compared to 23-24. Winter 500mb seemed pretty spot on as far as placement with key features of course intensities varied spring however does have some similarities thus far but not all the same. Should be interesting to see how we continue into summer. -
2024-2025 La Nina
so_whats_happening replied to George001's topic in Weather Forecasting and Discussion
Here was the 500mb pattern from 2/28-5/28 Here is the preceding 3 month period when we were in full swing Nino territory (11/28-2/28) Changes but notably the ridging has indeed pushed further east into the north Pacific so we may start to see a cooling in time of the WPAC? Especially if we do have a decent typhoon season but yet to be seen as of now. Which I would guess we eek out a typical WPAC season given we are transitioning to La Nina status. -
2024-2025 La Nina
so_whats_happening replied to George001's topic in Weather Forecasting and Discussion
Here is the 90 day SST bonkers amount of warm anomalies showing up just south of the Aleutians. This will change over time since there is a 12mb file limit on posts. -
2024-2025 La Nina
so_whats_happening replied to George001's topic in Weather Forecasting and Discussion
Yea the idea should be that an extremely active typhoon season should start to cool these waters but the waters only cooled for about a 2-3 month period (if that) before rebounding quite substantially. I also do not know what it will take for this to break and even more surprising was the fact we were near super levels for an El Nino typically we should have had an above average if not extremely active season, we had what was more of a typical average season if not even a more below average season for the WPAC. One thing of note was that we did not have a lot of strong recurving typhoons last year most were weak when they did recurve so maybe that played a role? In fact we just had our first system form a couple days ago which is close to the later start timeframes we have seen for the WPAC typhoon season. Surprisingly most after some of the extremely active season of strong/super El Ninos. 1st- 1983 June 8th 2nd- 1984 June 7th 3rd- 1998 May 28th 4th- 2016 May 25th 5th- 2024 May 22nd -
2024-2025 La Nina
so_whats_happening replied to George001's topic in Weather Forecasting and Discussion
Since ACE has been brought up quite a bit figured I would add this as well: (Named/ Hurricanes/ Major) https://tropical.atmos.colostate.edu/Realtime/index.php?arch&loc=northatlantic 1949: 16/7/2 96 ACE 1954: 16/7/3 104 ACE 1964: 13/7/5 153 ACE 1970: 10/5/2 40 ACE 1973: 8/4/1 48 ACE 1983: 4/3/1 17 ACE 1988: 12/5/3 103 ACE 1992: 7/4/1 76 ACE 1995: 19/11/5 227 ACE 1998: 14/10/3 182 ACE 2005: 28/15/7 245 ACE 2007: 15/6/2 74 ACE 2010: 19/12/5 165 ACE 2016: 15/7/4 141 ACE 2020: 30/13/6 179 ACE You can click on each year too to see the tracking map to see what years had solid landfalls. It is interesting to note 1970-71 had a solid cold spill into the US even with low ACE but high solar. 2010-11 had nice cold across the country but large blocking low solar and high ACE. There are definitely odd ball years that arise. -
2024-2025 La Nina
so_whats_happening replied to George001's topic in Weather Forecasting and Discussion
Agree on 1949-50, just had a completely different subsurface going on than any of these other years. 20-21 wasn't too bad of a year think the low solar really helped that year out a lot. If we are strictly going off the idea of a stronger Nino to a mod/strong Nina we take out 1970-71 and 2007-08 as while they did go to mod/strong Nina status they came off relatively weak Nino states just like 20/21 and 1949-50 did. Here is what the overall 500mb pattern looked like placement overall was still relatively similar of course the most notable difference is the Atlantic pattern as we did have a couple low solar years tossed in there (07-08,20-21). I also got a SST reconstruction for each set of years for may conditions leading into those winters. Not making conclusions which will turn out better as they both seem pretty similar just wanted to present the data with them. The one with the warmer equatorial pacific matches with the years coming off strong Ninos to strong Ninas. The cooler pacific was the group of years I had used in the previous post. Here is the current daily SST anomaly. -
2024-2025 La Nina
so_whats_happening replied to George001's topic in Weather Forecasting and Discussion
Again sorry for all the posts but one final one. If we combined all the years mentioned above we get not a bad look to what may be to come. Maybe warm it by about a degree? -
2024-2025 La Nina
so_whats_happening replied to George001's topic in Weather Forecasting and Discussion
Whoops just realized I left out 2007-08 so six years (1949-1950, 1970-1971, 1998-1999, 2010-2011, and 2020-2021) -
2024-2025 La Nina
so_whats_happening replied to George001's topic in Weather Forecasting and Discussion
Of the years posted this is what the Dec- Mar 500mb pattern resulted in. -
2024-2025 La Nina
so_whats_happening replied to George001's topic in Weather Forecasting and Discussion
Going off the idea that 3 or more fit the idea of what maybe coming the best years shown are 1949-1950, 1970-1971, 1998-1999, 2010-2011, and 2020-2021. These five had more things combined that would lead me to believe if we do indeed go into moderate to strong Nina status these may be the years to use. Here are the subsurface looks for each year. Some are just flat out not in-line with where we are but Ill leave that for folks to decide. I do have the other years if folks are interested in specific years. -
2024-2025 La Nina
so_whats_happening replied to George001's topic in Weather Forecasting and Discussion
Sorry for the delay, yesterday ended up being a lot busier than I expected. So here is the chart I created for all years going from El Nino to La Nina. I highlighted the years that best fit the request of Westerly QBO, -PDO, High Solar (just noticed 83-84 and 92-93 should be highlighted yellow as they are still rather active years) , +AMO, and Volcanic activity ( a lot of years had a VEI 5 a year or two before the listed ranges). 49-50 QBO was a bit of a guess following the typical ~18 month span of QBO transition, data only went to 1953 for what I have. Here are the sites used to help create this table. Volcano Data - https://volcano.si.edu/faq/index.cfm?question=eruptionsbyyear ENSO Data - https://origin.cpc.ncep.noaa.gov/products/analysis_monitoring/ensostuff/ONI_v5.php https://www.webberweather.com/ensemble-oceanic-nino-index.html AMO Data - https://psl.noaa.gov/data/correlation/amon.us.long.data PDO Data - https://www.ncei.noaa.gov/access/monitoring/pdo/ Solar Cycle Data - https://www.swpc.noaa.gov/products/solar-cycle-progression QBO Data - https://www.geo.fu-berlin.de/met/ag/strat/produkte/qbo/qbo.dat -
2024-2025 La Nina
so_whats_happening replied to George001's topic in Weather Forecasting and Discussion
Ill take a look into it tonight/tomorrow what subsurface looked like coming off these years 72-73,87-88,94-95, 97-98. 09-10, heck ill even throw in 91-92 and make a gif just to see where we are potentially aligning with going forward. If any others years are wanted just let me know. -
2024-2025 La Nina
so_whats_happening replied to George001's topic in Weather Forecasting and Discussion
This makes sense looking back at data in the early 90s (91/92) we peaked hard on yearly temps around the PA/Philly region and dropped dramatically afterward. We also were coming off an El Nino (strong) to neutral stance and we were also in a solar max situation. huh -
2024-2025 La Nina
so_whats_happening replied to George001's topic in Weather Forecasting and Discussion
We still have some pretty intense westerly winds in the Indian ocean. -
2024-2025 La Nina
so_whats_happening replied to George001's topic in Weather Forecasting and Discussion
Finally starting to take a nice Nina look especially with decent upwelling along the Peruvian coastline. Limited to only 30 day animation due to max file size. Here has been the global 500mb look for the last 3 months. Really decent -NAO pattern to end the season and you can see why waters south of the Aleutians have warmed quite a bit. One interesting note is the cooling along the equator in the Atlantic right now. We largely did not see this during the strong/super Nino and typically you get something that counter balances between the two basins. -
2024-2025 La Nina
so_whats_happening replied to George001's topic in Weather Forecasting and Discussion
I wish we could continue to monitor MEI data but in February they discontinued updating the data. Hopefully we can see that change coming up here with the push for a new data set instead of using JMA data? https://psl.noaa.gov/enso/mei/ If we didn't have the robust 2 year nino of 14-16 we would largely be in an extended -PDO pattern from about 99 onward. Ill look to start adding some updates with real time stuff as we get into June, have had a really busy schedule the last 2 months that has not been conducive for much of anything. Luckily not a whole lot has changed overall.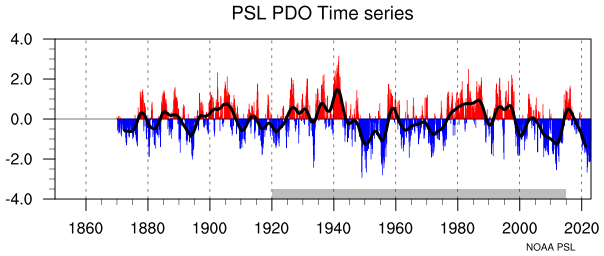
-
May 2024 temperature forecast contest
so_whats_happening replied to Roger Smith's topic in Weather Forecasting and Discussion
DCA _ NYC _ BOS __ ORD _ ATL _ IAH __ DEN _ PHX _ SEA +1.2 +1 +.9 +.8 +1.2 +1.4 +1.5 +.3 -.2 -
April 8, 2024 Eclipse
so_whats_happening replied to Cat Lady's topic in Weather Forecasting and Discussion
Saw it in Waco Tx and had clear skies during the totality. Got to even see the solar flares. Was amazing to see what everything looked like during that window of time. Can't wait for the next one in 20 years. -
April 8, 2024 Eclipse
so_whats_happening replied to Cat Lady's topic in Weather Forecasting and Discussion
Have fun in Lancaster! Yea Im actually getting a little nervous about TX right now. ULL ejecting out of the SW with return flow setting up a day or two before. It would be cool to experience the cumulus towers beforehand and they all but disappear with the eclipse to come back as the sun starts to shine again. Ill be in Austin area during the time and can move around as we get closer to get a better idea of how things will fall out. -
2024-2025 La Nina
so_whats_happening replied to George001's topic in Weather Forecasting and Discussion
I was just about to post this quite the increase in negative anomalies (or decrease, however you choose to look at it) in just 5 days. This also seems farther west then past events have shown which end up around 120-140 W currently this is sitting just east of the dateline. -
DCA _ NYC _ BOS __ ORD _ ATL _ IAH __ DEN _ PHX _ SEA +1.3 +1.6 +2 +2.6 +1 +.8 +.8 0 +.4 Happy Easter Everyone. Wanted to get this done before Vacation starts.
-
2024-2025 La Nina
so_whats_happening replied to George001's topic in Weather Forecasting and Discussion
It will be interesting to see how things go to mid April. Western ridging around the GOA with a -NAO blocking flow sounds like more troughing into the west through early April and severe weather into the plains. -
2024-2025 La Nina
so_whats_happening replied to George001's topic in Weather Forecasting and Discussion
Here is a 90 day coralreef animation to start things off. There does actually seem to be some cooling of the WPAC warmth just under Japan in the recent month. This should as Raindance mentioned help with a weakening of values for the -PDO coming up. Let us see what happens.

