chubbs
Members-
Posts
4,059 -
Joined
-
Last visited
Content Type
Profiles
Blogs
Forums
American Weather
Media Demo
Store
Gallery
Everything posted by chubbs
-
A paragraph from Dr. Daniel Swain's blog (at end after discussion of upcoming weather on W coast): As much as it might surprise some folks, the Hawaiian islands are no stranger to fire. Nearly all ignitions today are caused by human activities (though most are accidental). Wildfire risk is rising, especially on the dry sides of the islands (which, in some cases, receive an annual average precipitation similar to that of Los Angeles), due to a combination of unmanaged invasive grasses building up huge fuel loads on abandoned plantations and climate change–which is likely increasing the duration and severity of droughts on the lee sides of the islands and the intensity of wet-dry cycling of precipitation (which favors extra vegetation growth, and then rapid drying of that extra growth during high risk periods). Here, too, as in so many other places, subdivisions have been built and expanded that increasingly extend into high fire risk zones. In fact, in County of Maui planning documents, nearly all of Lahaina was characterized as being at high to extreme wildfire risk. https://weatherwest.com/archives/29215 One other thought: We often hear "CO2 is plant food", i.e. increased CO2 increases plant growth when conditions allow. This would also increase fire risk in areas like Hawaii with wet/dry season cycling.
-
The 12-month average energy imbalance is roughly twice as large now vs the last big nino in 2015. Not surprising that we are seeing a larger enso response this year. Per my post above the east-based pattern is also favorable for warming. Enso is by far the biggest change this year vs last. One way to think about it. The atmosphere wants to be warmer but the ocean is holding it back. If the ocean cooling relaxes, the atmosphere can warm quite a bit before loosing too much to space.
-
Yes it was the high nightly lows that drove July warmth in the northeast. Nights warming faster than days is a greenhouse gas signal.
-
There are many factors contributing to the warming spike this year. An additional one is the east-based pattern of this nino. Below is a slide from a recent talk by climate scientist Tim Andrews. Warming in the east Pacific produces stronger positive feedbacks than warming in the west Pacific. We've had an unusually large temperature swing this year in the far EPac, even for a nino onset year. Below is the bottom-line from the talk. Some of increased warming anticipated below has already occurred courtesy of the 2015+2023 ninos. https://github.com/timothyandrews/cfmip2023/blob/main/Andrews_CFMIP_Jul2023.pdf
-
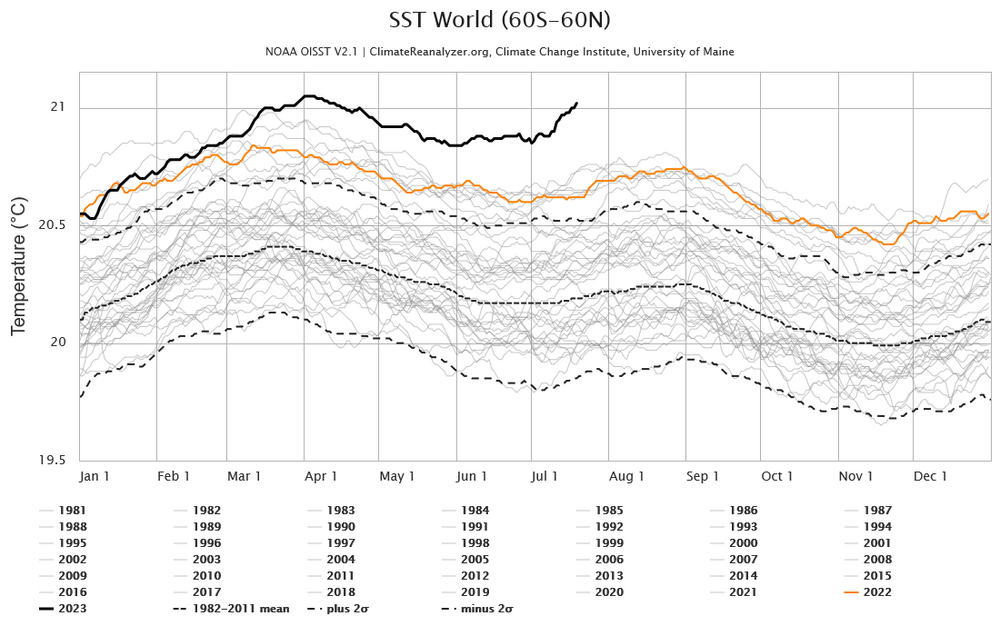
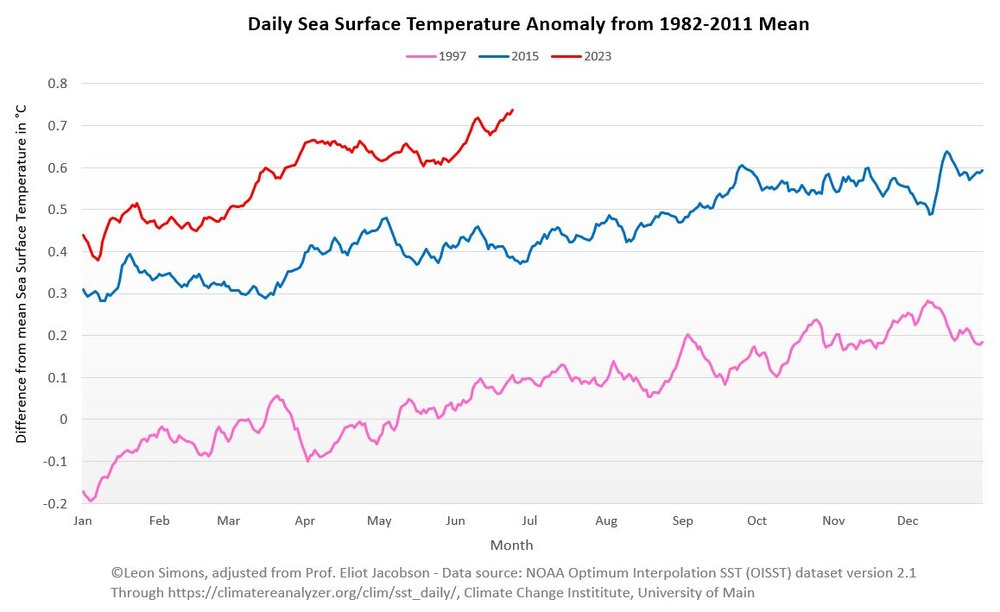
The last point is the July average to date. Continuing to get an unusually large SST rise in this nino.
-
-
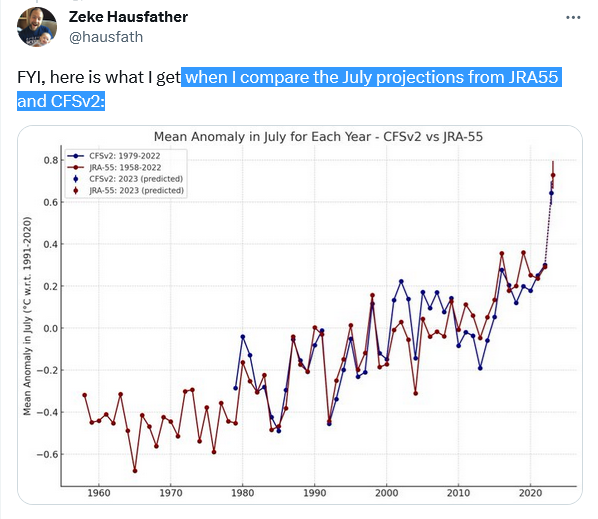
Per this blog, this summer's global temperatures aren't surprising. Would be interesting to see where they stack-up vs cmip5. https://www.theclimatebrink.com/p/are-temperatures-this-summer-hotter
-
-
Cyclical or Natural Predictable Climate Change Forum
chubbs replied to ChescoWx's topic in Climate Change
Barbie says don't blame UHI or thermometers next to AC units -
Thanks for your model predictions. I wouldn't be surprised if temps end up even higher. SST continues to move further into record territory and may separate further from the pack if nino conditions continue to build.
-
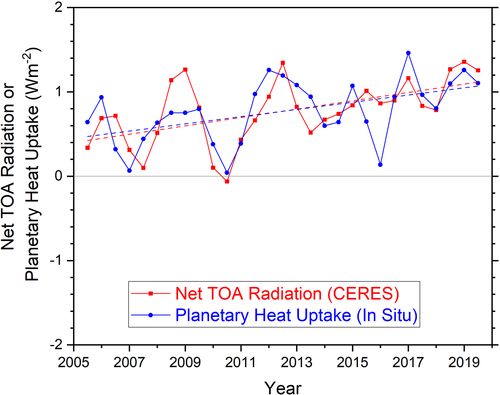
Concerning, seems to be increasing faster than I would have expected based on ocean heat content or net man-made forcing info. Hopefully we will get an update of the paper below which found reasonable agreement between Ceres to ocean heat content (Planetary Heat Uptake) through 2019. In any case we are due for a short-term reversal of recent spike. Will be interesting to see what the summer data says given the run of record temperatures. https://agupubs.onlinelibrary.wiley.com/doi/10.1029/2021GL093047
-
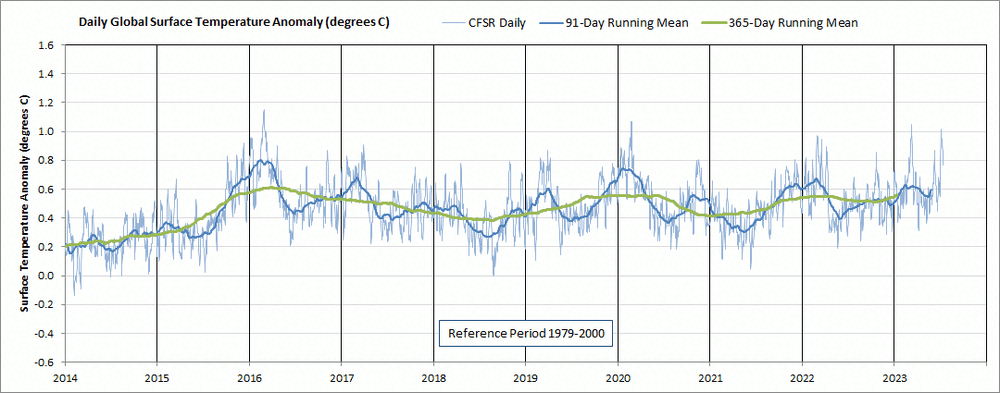
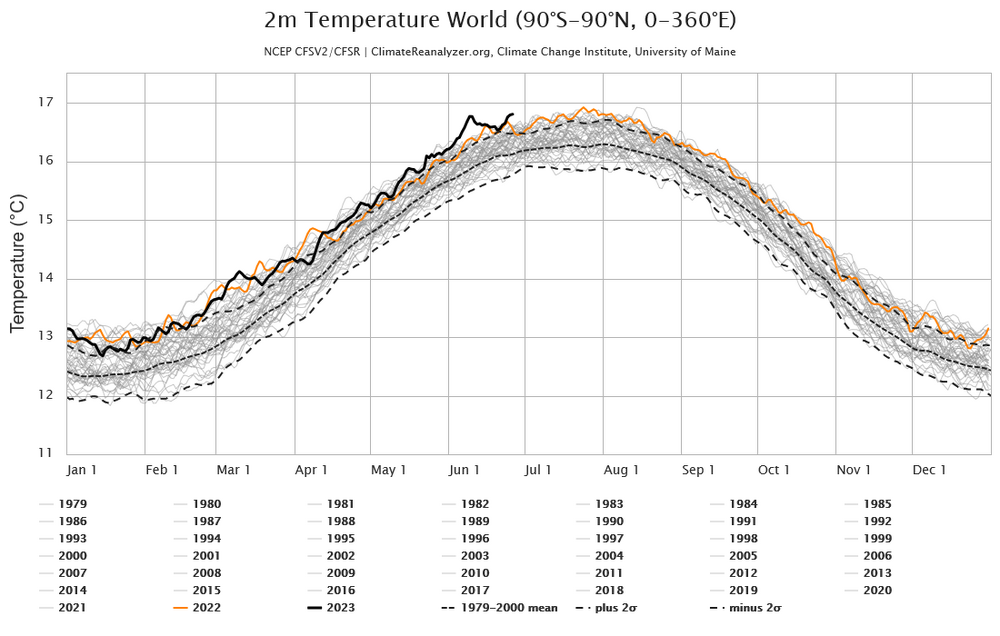
Yes that's the $64 question. Here is a longer view of the daily CFS re-analysis anomalies. There is an annual cycle with smaller anomalies in the summer. This year's summer anomaly spikes are unusual, sending the blue 91-day mean well above previous summers. Like you say, the next few months are key in evaluating where stand. Hopefully the rise this summer has borrowed from the rise typically seen in the fall of developing nino. We'll see.
-
Looks like GISS lowered some of the monthly values in 2016 and 2020, now 1.01 is the record instead of 1.02. Since Kalshi defines a record as 1.03, possible to break the record and not get paid.
-
Unfortunately the x (and y) axes don't align below, so the dates don't match. There is evidence of a see-saw with arctic and antarctic moving in opposite directions. The ocean overturning circulation driven by sea ice formation is a potential see-saw link. Increasing fluctuation is a sign of tipping point behavior. Just speculation of course.
-
June GISS will be 1.11 if it breaks last years record by the same amount as Berkeley Earth.
-
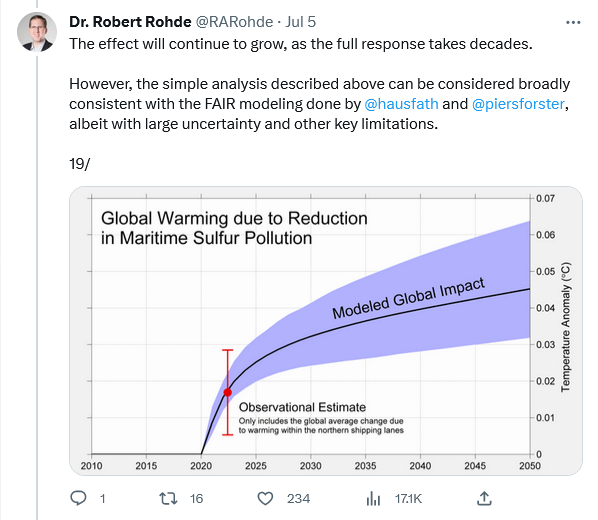
A couple of recent estimates of impact of marine sulfur rules which took effect in 2020. Bottom line - not significant on a global-scale, roughly 1 year at current global warming rate of roughly 0.2C per decade. More significant though on a regional basis. Not the main cause of the recent spate of daily records, https://www.carbonbrief.org/analysis-how-low-sulphur-shipping-rules-are-affecting-global-warming/
-
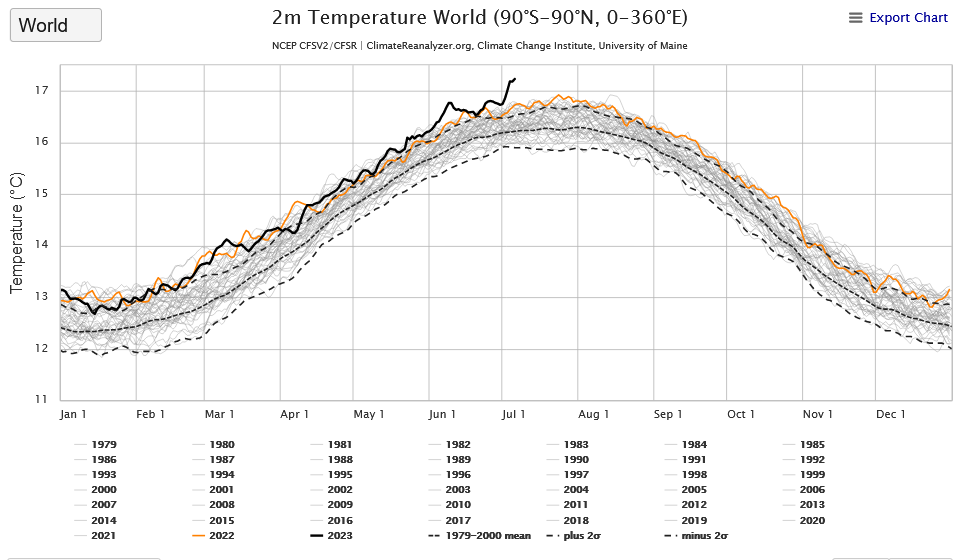
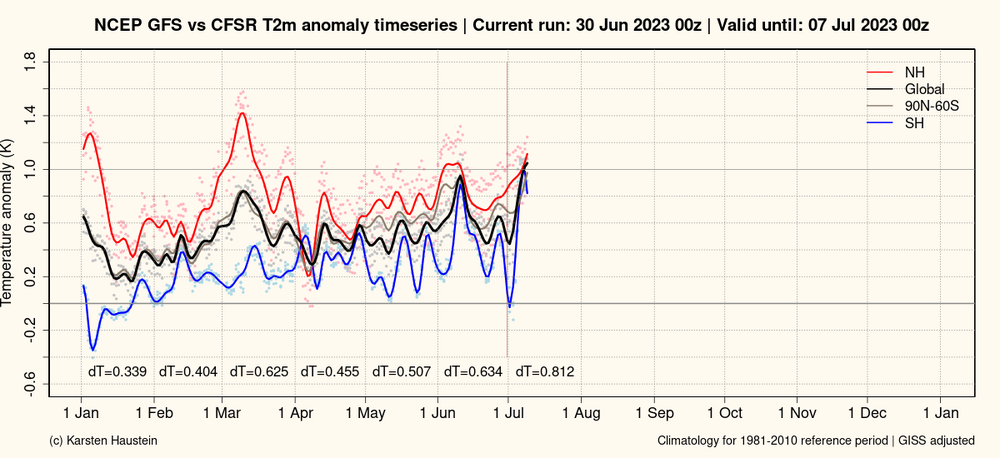
Another "warmest day ever" yesterday on CFS. Could be the peak, per Hausteins site, but the fall doesn't look to severe. More significant than the "warmest day ever" is the prolonged period of daily records since early June and the margin over previous years. A sign that this nino could send global temps well beyond 2016.
-
-
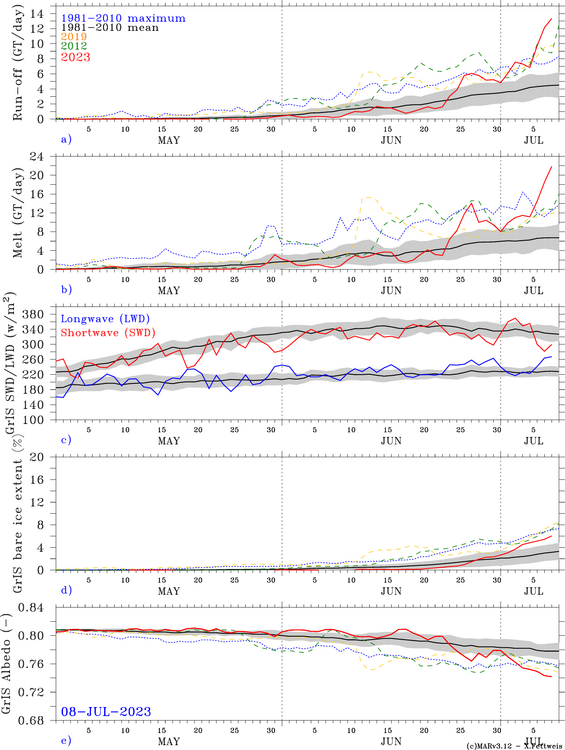
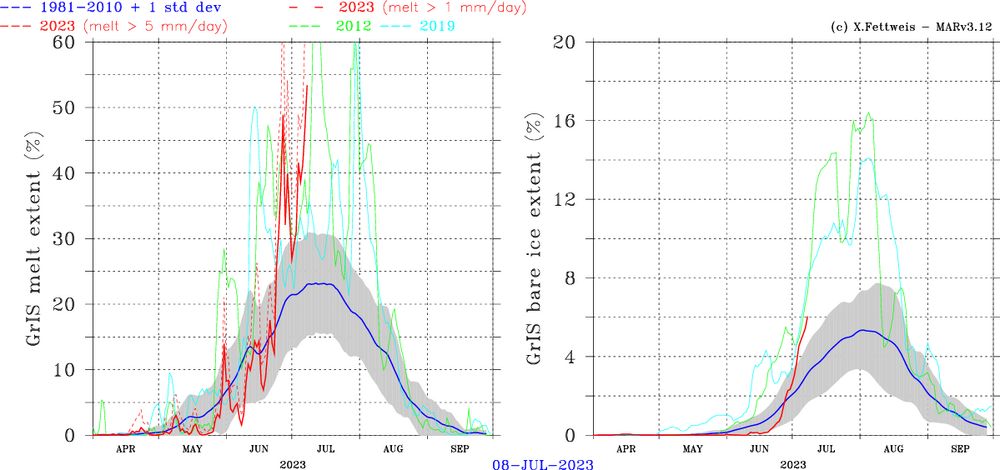
Big melt and runoff event forecast for Greenland the first week of July. The melt season started very slowly this year; but, has ramped in the past week as NAO+--->NAO-. Melt and run-off are forecast to reach record levels by the end of the week. We'll see. https://www.climato.uliege.be/cms/c_5652668/fr/climato-greenland
-
Very warm (and stable recently) forecast by gfs for first week of July. Pushing daily reanalysis temperatures further into record-breaking territory. Could break the 17C barrier on the chart posted above.
-
Not sure what the effect is. It isn't preventing daily re-analysis records. Any cooling effect from the Canadian fires should peak in northern hemi summer and end by late fall.
-
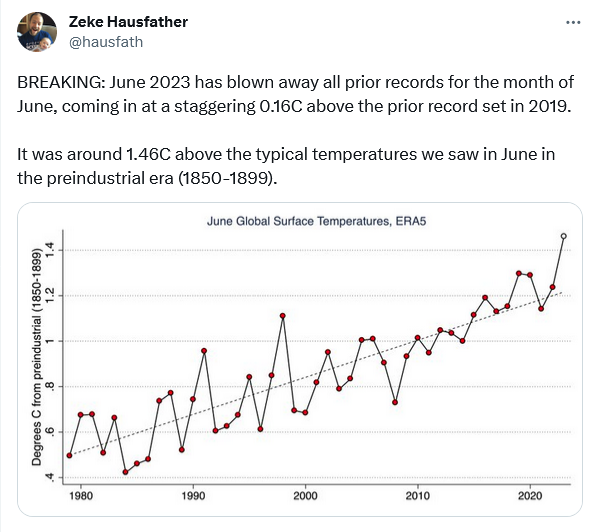
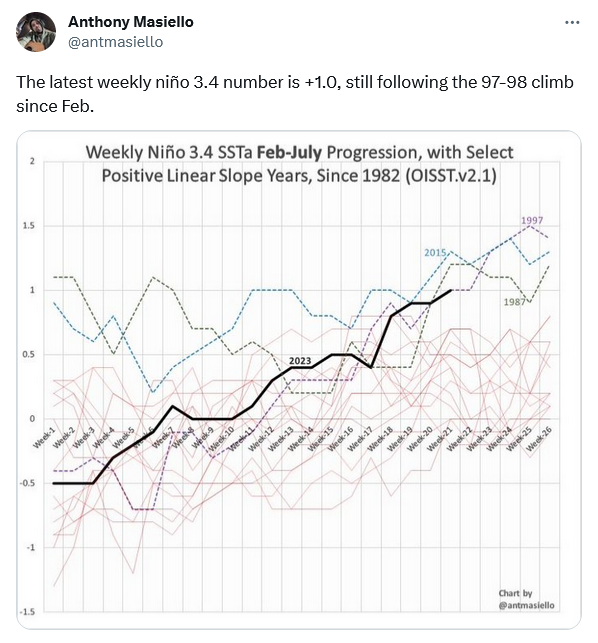
Think the odds will only increase as the year progresses. We started in an enso hole this year after 3 years of nina, but the transition to nino has been rapid. June is on track to be the warmest ever(note - SST below, global re-analysis temps for June also in record territory). Expect most of the remaining months this year to also break records.
-
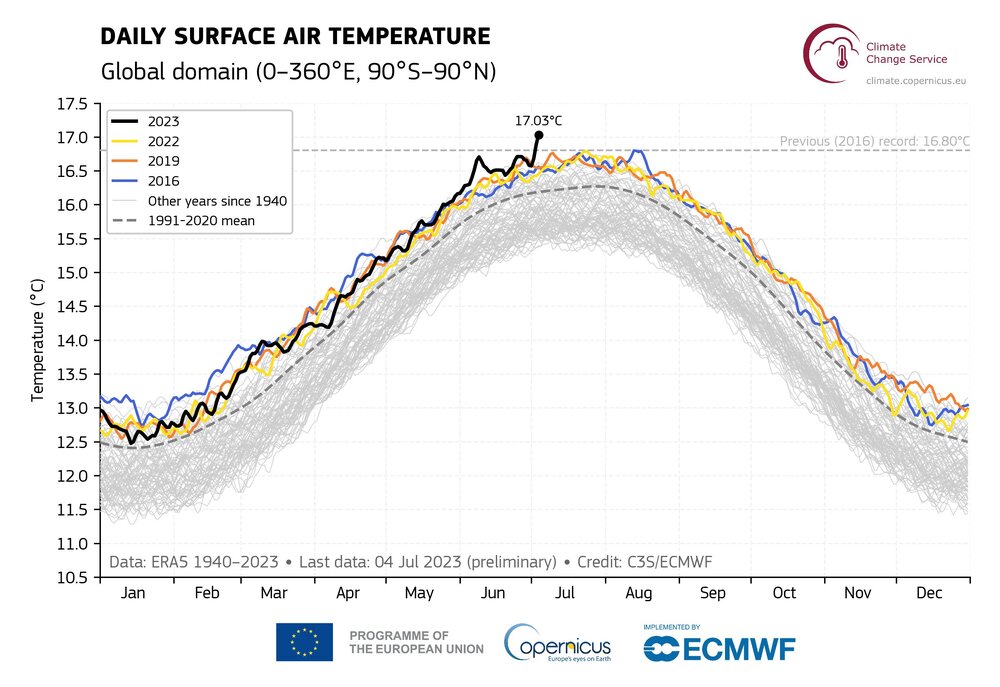
This chart, based on ERA5, provides a clearer day-by-day comparison of 2023 vs the previous record holders. Flip to nino occurred early enough in year to allow a record. We'll see if recent warming is maintained or there is a fall back to temps closer to 2016 and 2020. https://climate.copernicus.eu/tracking-breaches-150c-global-warming-threshold?utm_source=tw&utm_medium=socialmedia&utm_campaign=globalwarminglimit-june23


