Random Chaos
-
Posts
902 -
Joined
-
Last visited
Content Type
Profiles
Blogs
Forums
American Weather
Media Demo
Store
Gallery
Everything posted by Random Chaos
-
The "yes" icon is broken on mobile:


-
Gale watch just popped for the tail end of the storm: URGENT - MARINE WEATHER MESSAGE National Weather Service Baltimore MD/Washington DC 712 PM EST Sun Jan 5 2025 ANZ531-532-060815- /O.EXA.KLWX.GL.A.0002.250107T0300Z-250108T0300Z/ Chesapeake Bay from Pooles Island to Sandy Point MD- Chesapeake Bay from Sandy Point to North Beach MD- 712 PM EST Sun Jan 5 2025 ...GALE WATCH IN EFFECT FROM MONDAY EVENING THROUGH TUESDAY EVENING... * WHAT...Northwest winds 20 to 25 kt with gusts up to 35 kt and waves 2 to 4 ft possible. * WHERE...Chesapeake Bay from Pooles Island MD to North Beach MD. * WHEN...From Monday evening through Tuesday evening. * IMPACTS...Strong winds can cause hazardous waves which could capsize or damage vessels. PRECAUTIONARY/PREPAREDNESS ACTIONS... Mariners should consider altering plans to avoid possible hazardous conditions. Remain in port, seek safe harbor, alter course, and/or secure the vessel for severe wind and waves.
-

January Medium/Long Range: A snowy January ahead?
Random Chaos replied to mappy's topic in Mid Atlantic
I’m honestly hoping that we don’t get 43" in Annapolis. Not sure how well roofs will handle that much. -
January Medium/Long Range: A snowy January ahead?
Random Chaos replied to mappy's topic in Mid Atlantic
That’s a 40.2" number right over me! -
January Medium/Long Range: A snowy January ahead?
Random Chaos replied to mappy's topic in Mid Atlantic
Now that’s a deathband! 18z gfs hr 156, that’s some crazy modeled snow rates over Phili! -
33.9/12.7
-
I’m loving the 7% chance of 18"! (From LWX winter page) Location Low-End Amount Expected Amount High-End Amount Chance of Seeing More Than 0.1" 1" 2" 4" 6" 8" 12" 18" Annapolis, MD 4" 7" 17" 100% 98% 97% 92% 80% 65% 35% 7%
-
My Vantage Pro is about 15 feet above the Chesapeake Bay at the end of 100ft pier. Never close to any inland sensor.
-
32/11 high thin clouds
-
31F / 11F dew point. Let’s bring this storm!
-
It’s fascinating looking at Google Maps with traffic mode zoomed out. You can immediately see where snow’s on interstates based on the yellows.
-
03z SREF Plumes - snow totals - damn, so want those crazy totals to verify! DCA: BWI:
-
Just got my first snow squall of this storm. My weather station is at 37F, but it’s 100’ offshore over the bay. My heat pump is reading 32F. And the snow stuck. So clearly 150’ has a 5 degree jump due to the Chesapeake!
-
This is when I really miss the CRAS model. Made bored hours waiting for the next good model more interesting!
-
Not really associated with surge directly. IKE takes the total wind field to determine the total kinetic energy of the storm. For example Hurricane Sandy had one of the highest IKE values of over 300TJ shortly before landfall. The larger the wind field the lower the relative pressure and the lower the pressure generally the more storm surge (but don’t forget inlets and bays are also impacted by wind-driven surge). Since a huge tropical storm could have an IKE similar to a tiny Cat 5 storm but the wind driven aspect of the surge would be vastly different (even though the pressure based surge would be similar).
-
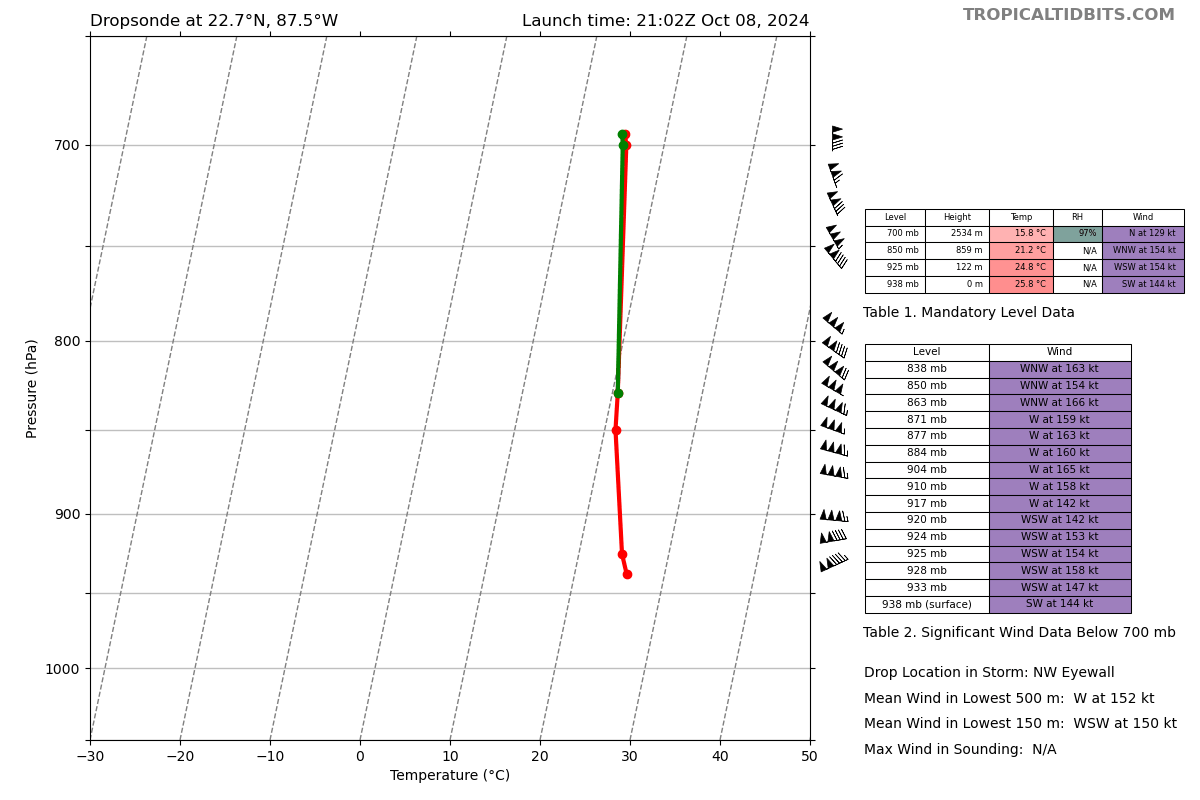
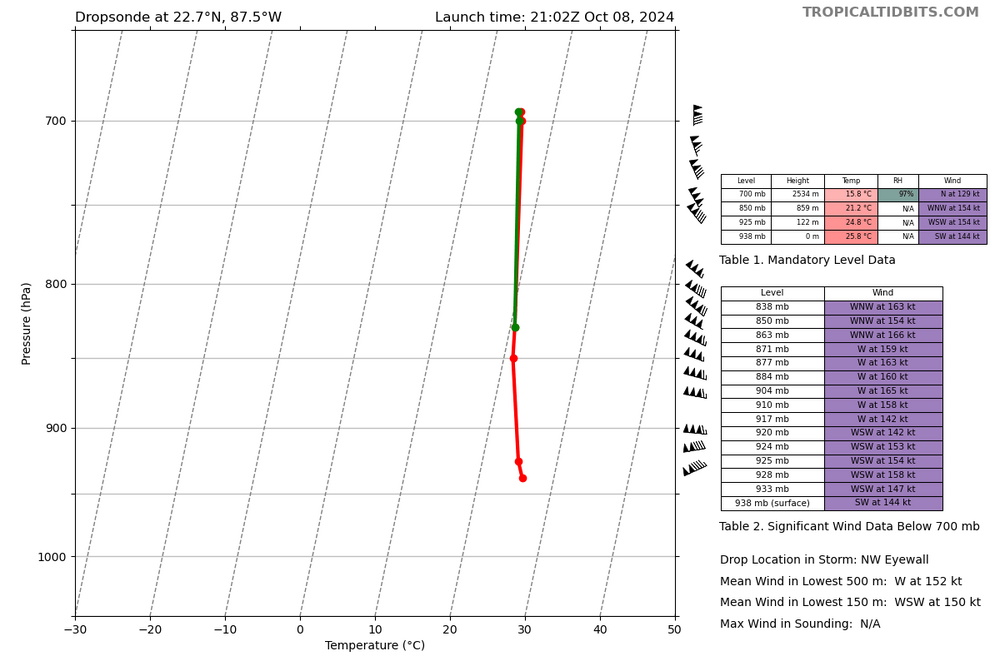
144kt surface wind NW dropsonde. 150kt average over lowest 150m.
-
Updated intensity: Hurricane Milton Tropical Cyclone Update NWS National Hurricane Center Miami FL AL142024 430 PM CDT Tue Oct 08 2024 ...AIRCRAFT MEASURES VERY LOW PRESSURE IN THE EYE OF MILTON... Recent observations from an Air Force Reserve Hurricane Hunter aircraft indicate the central pressure in the eye of Milton has fallen to an estimated 905 mb (26.72 inches). The aircraft observations also indicate that the maximum sustained winds are near 165 mph (270 km/h). SUMMARY OF 430 PM CDT...2130 UTC...INFORMATION ----------------------------------------------- LOCATION...22.7N 87.4W ABOUT 315 MI...510 KM WSW OF THE DRY TORTUGAS ABOUT 475 MI...770 KM SW OF TAMPA FLORIDA MAXIMUM SUSTAINED WINDS...165 MPH...270 KM/H PRESENT MOVEMENT...ENE OR 75 DEGREES AT 9 MPH...15 KM/H MINIMUM CENTRAL PRESSURE...905 MB...26.72 INCHES
-
Looking at the latest recon pass, big drop in the strength of the inner eyewall winds and the outer eyewall seems to be starting to take over. At this rate the ERC might finish fairly quickly and we see re-strengthening by early tomorrow. Max surface winds SFMR down to 123kts, max flight level winds down to 185kts, pressure up to 915mb in latest pass. Outer eyewall still 24 and now open NE.HDOB data shows that the outer eyewall windfield is approaching that of the inner eyewall speeds now (more that the inner eyewall is being starved and weakening).
-
The question is how much of the winds mix to the surface. Winds aloft on some of the Hurricane models definitely support Cat 2, but they aren't mixing the winds to the surface. It's probably good to highlight the risk on the east coast of FL for winds even if they don't materialize, though surge will be substantially less with an exiting system as opposed to a land-falling system. Coastal locations along the east coast need to opportunity to board up and secure flying objects. Accuweather is doing a responsible job of warning of the potential, even if that potential fails to materialize or only materializes over a very small area. The models effectively start transitioning Milton to a asymmetric system as shear rips into it as it crosses Florida, causing it's windfield to substantially expand. Some models bring hurricane force coastal winds to a large swath of eastern FL and up into GA in some cases. This expansion (speed and amount) may play a critical component in how strong the winds are at the coast. FL is known for not disrupting hurricanes much, so the shear becomes the bigger question: how strong and how quickly does it tear Milton apart.
-
4nm eye. Wow. Product: NOAA Vortex Message (URNT12 KWBC)Transmitted: 7th day of the month at 22:41ZAgency: National Oceanic and Atmospheric Administration (NOAA)Aircraft: Lockheed WP-3D Orion (Reg. Num. N42RF)Storm Name: MiltonStorm Number & Year: 14 in 2024 (flight in the North Atlantic basin)Mission Number: 10Observation Number: 03A. Time of Center Fix: 7th day of the month at 22:20:04ZB. Center Fix Coordinates: 21.86N 90.67WB. Center Fix Location: 93 statute miles (149 km) to the NW (312°) from Mérida, Yucatán, Mexico.C. Minimum Height at Standard Level: Not AvailableD. Minimum Sea Level Pressure: 899mb (26.55 inHg)E. Dropsonde Surface Wind at Center: From 220° at 24kts (From the SW at 28mph)F. Eye Character: ClosedG. Eye Shape & Diameter: Circular with a diameter of 4 nautical milesH. Estimated (by SFMR or visually) Maximum Surface Wind Inbound: Not AvailableI. Location & Time of the Estimated Maximum Surface Wind Inbound (Undecoded): NAJ. Maximum Flight Level Wind Inbound: From 160° at 135kts (From the SSE at 155.4mph)K. Location & Time of the Maximum Flight Level Wind Inbound: 4 nautical miles to the ENE (58°) of center fix at 22:18:51ZL. Estimated (by SFMR or visually) Maximum Surface Wind Outbound: Not AvailableM. Location & Time of the Estimated Maximum Surface Wind Outbound (Undecoded): NAN. Maximum Flight Level Wind Outbound: From 322° at 161kts (From the NW at 185.3mph)O. Location & Time of the Maximum Flight Level Wind Outbound: 4 nautical miles to the WSW (237°) of center fix at 22:21:09ZP. Maximum Flight Level Temp & Pressure Altitude Outside Eye: 13°C (55°F) at a pressure alt. of 3,054m (10,020ft)Q. Maximum Flight Level Temp & Pressure Altitude Inside Eye: 27°C (81°F) at a pressure alt. of 3,030m (9,941ft)R. Dewpoint Temp (collected at same location as temp inside eye): 16°C (61°F)R. Sea Surface Temp (collected at same location as temp inside eye): Not AvailableS. Fix Determined By: Penetration, Radar, Wind, Pressure and TemperatureS. Fix Level: 700mbT. Navigational Fix Accuracy / Meteorological Accuracy (Undecoded): 0.01 / NARemarks Section: Maximum Flight Level Wind: 161kts (~ 185.3mph) which was observed 4 nautical miles to the WSW (237°) from the flight level center at 22:21:09Z
-
Everytime I see this storm name I can't stop thinking of Devil's Advocate...
-
It's gone extratropical with a warm asymetric core. I find it fascinating that Europe is getting this storm. It's a rare season that sees anything hit there. Here's the cyclone phase from GFS showing the core structure (source: https://moe.met.fsu.edu/cyclonephase/ )
-
Shrinking eyes != ERC (though they can lead to one). An ERC is indicated by double wind maxima on recon or structural verification on Microwave Imagery typically.
-
Absolutely incredible lightening today in the eye. (73mb file size) https://bayheadwx.net/weather/2024/september/CODNEXLAB-GOES-East-meso-meso2-truecolor-20_32Z-20241007_map-glm_flash_noBar-100-4n-10-150.gif
-
Exactly. But more importantly it doesn't matter the strength at landfall except for a very small area near the coast line. What matters is the total integrated kinetic energy (IKE). A category 4 storm 24 hours before landfall will still have the same (or larger!) hurricane force wind field and surge if it landfalls as category 4 or if it weakens to category 2 - the strength of the hurricane only is measured based on the maximum winds in the eyewall, not the total power of the storm. Helene was a massive storm with winds and rain extending far from its core. Milton is likely to be a smaller storm when it reaches peak strength, but if it weakens (which a lot of models indicate) it's doing so because the core is weakening, and the winds spreading outward. If it stays compact, it would have the worst impact over a fairly small area, but weakening actually broadens the area of impact from hurricane strength winds and thus wind-driven (rather than purely low pressure based) coastal storm surges, which could have an even worse impact on mostly enclosed bodies of water such as Tampa Bay where a storm surge can be driven up the bay by winds. History has many examples of weakening storms that have caused massive damage from storm surge and winds - Katrina, Isabel, etc. Just because a storm is weakening does not mean that it has lost its teeth - that takes time, usually multiple days of shear to rip a storm completely apart.