

stadiumwave
-
Posts
1,168 -
Joined
-
Last visited
Content Type
Profiles
Blogs
Forums
American Weather
Media Demo
Store
Gallery
Posts posted by stadiumwave
-
-
5 minutes ago, 40/70 Benchmark said:
Snowman, kudos for recognizing it and changing that emoji. I respect that.

-
1 hour ago, snowman19 said:
I didn’t doubt it. However, if the MJO behaves as expansive this cooling will be short lived
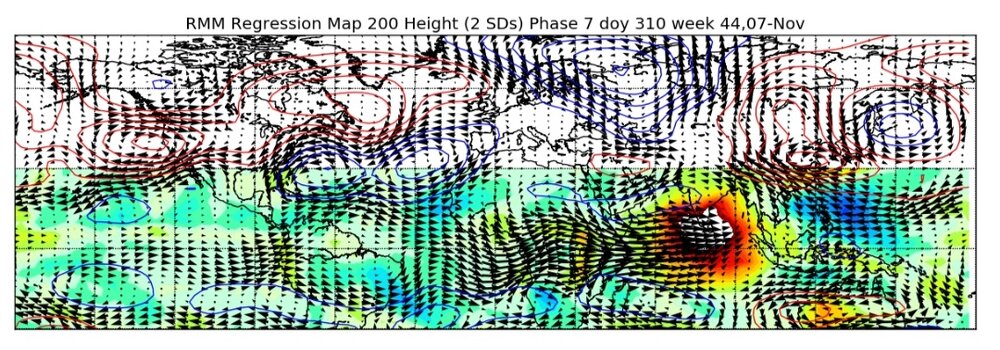
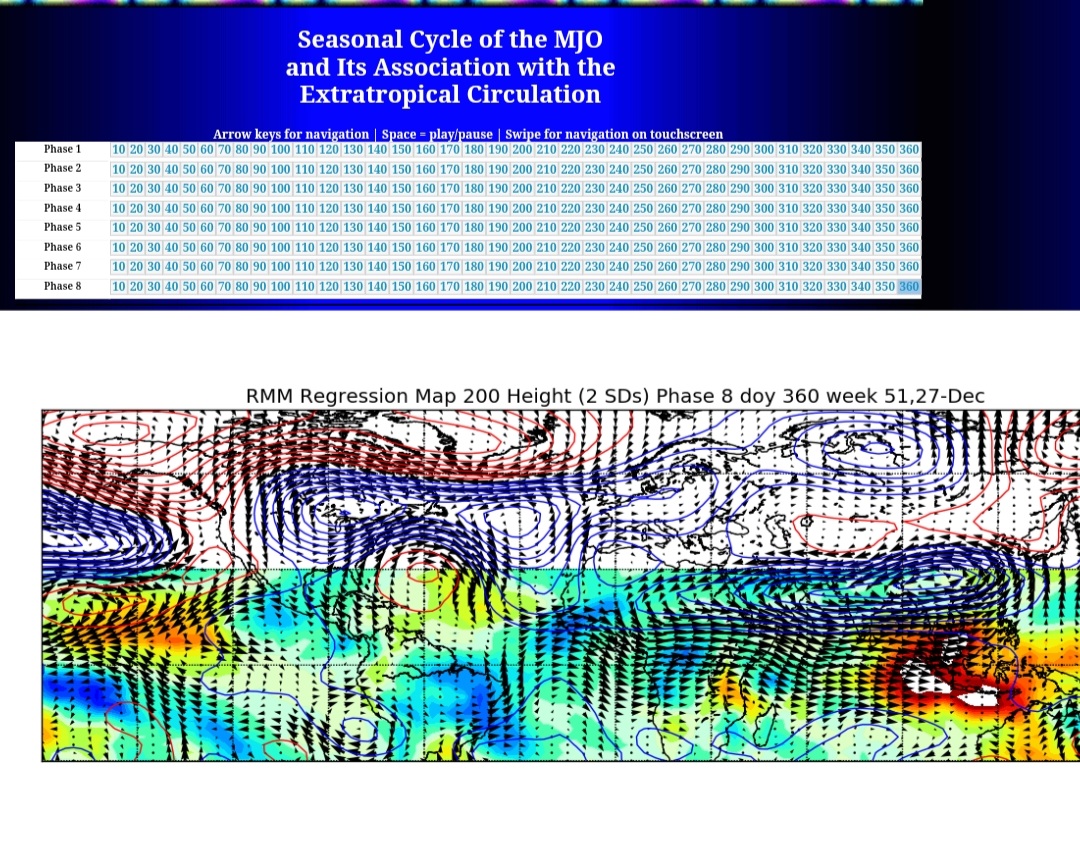
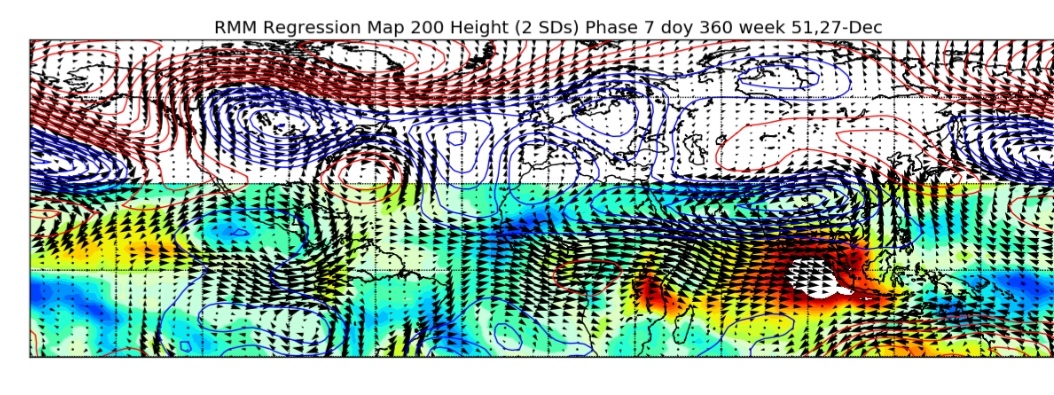
Best MJO tool available compliments of Paul Roundy. It has 360 days, click on phase & time of year & it'll give you the average composite.

https://www.atmos.albany.edu/facstaff/roundy/waves/rmmcyc/index200reg.html
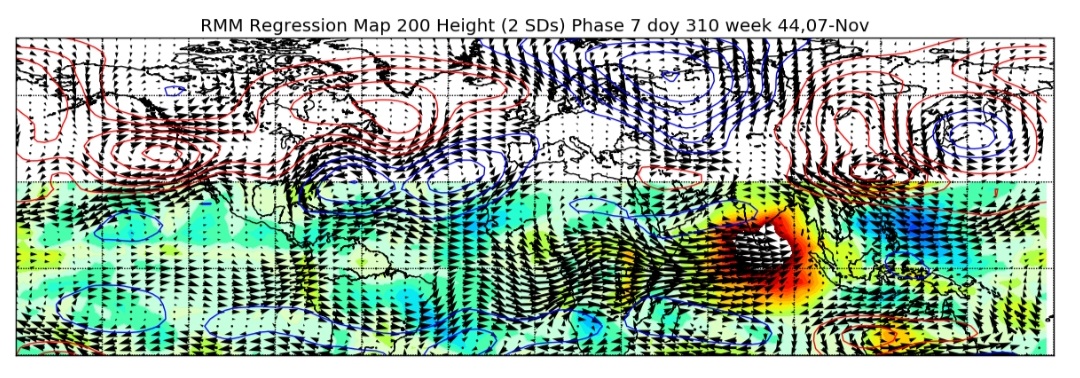
Here's early NOV phase 7 vs late DEC phase 7:
NOV 7, Phase 7
DEC 27, Phase 7

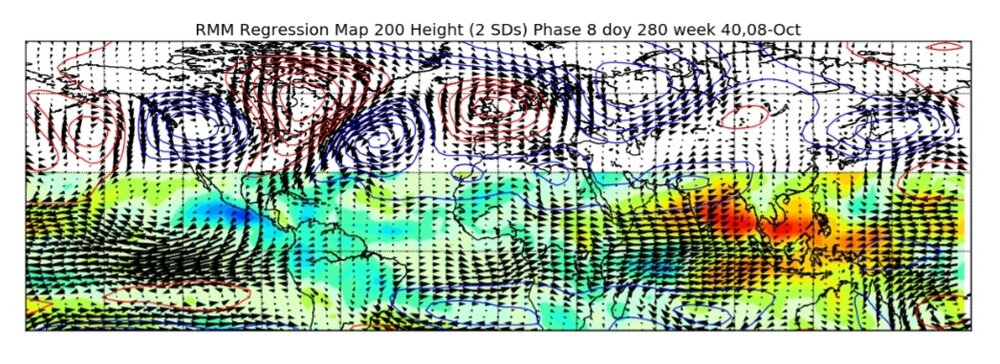
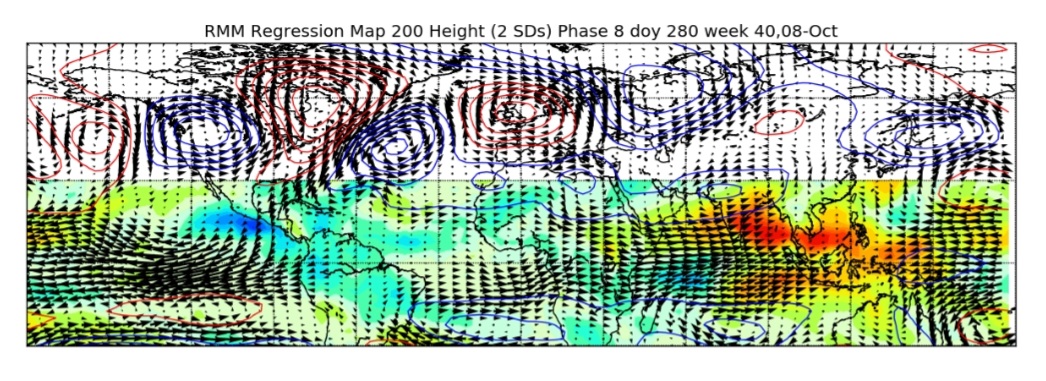
OCT 8, Phase 8
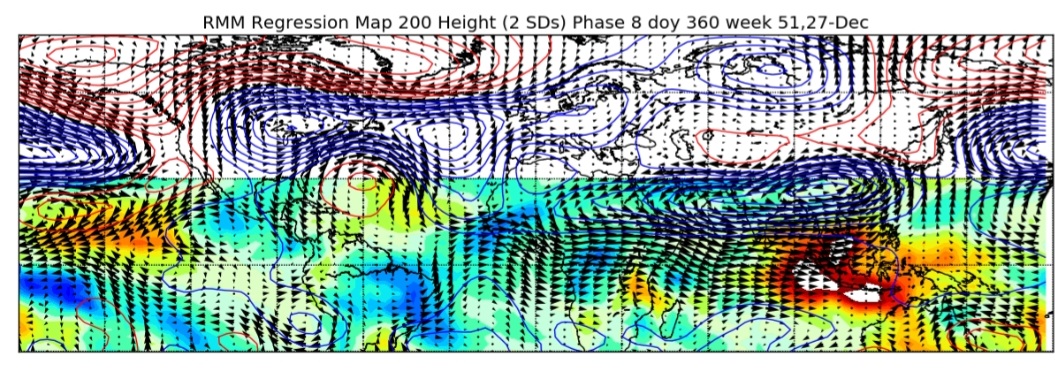
DEC 27, Phase 8

It's the best MJO tool I've used for time of year phase expectations. There are other factors I know & it's not perfect but no MJO tool is. This is based on extensive research & Paul is a true MJO expert.
-
 3
3
-
 1
1
-
-
7 hours ago, frd said:
MJO phase significance changes based on the three month period you are in.
Best MJO tool available compliments of Paul Roundy. It has 360 days, click on phase & time of year & it'll give you the average composite.
https://www.atmos.albany.edu/facstaff/roundy/waves/rmmcyc/index200reg.html
Here's early NOV phase 7 vs late DEC phase 7:
NOV 7, Phase 7
DEC 27, Phase 7
OCT 8, Phase 8
DEC 27, Phase 8
It's the best MJO tool I've used for time of year phase expectations. There are other factors I know & it's not perfect but no MJO tool is. This is based on extensive research & Paul is a true MJO expert.
-
1
-
2
-
-
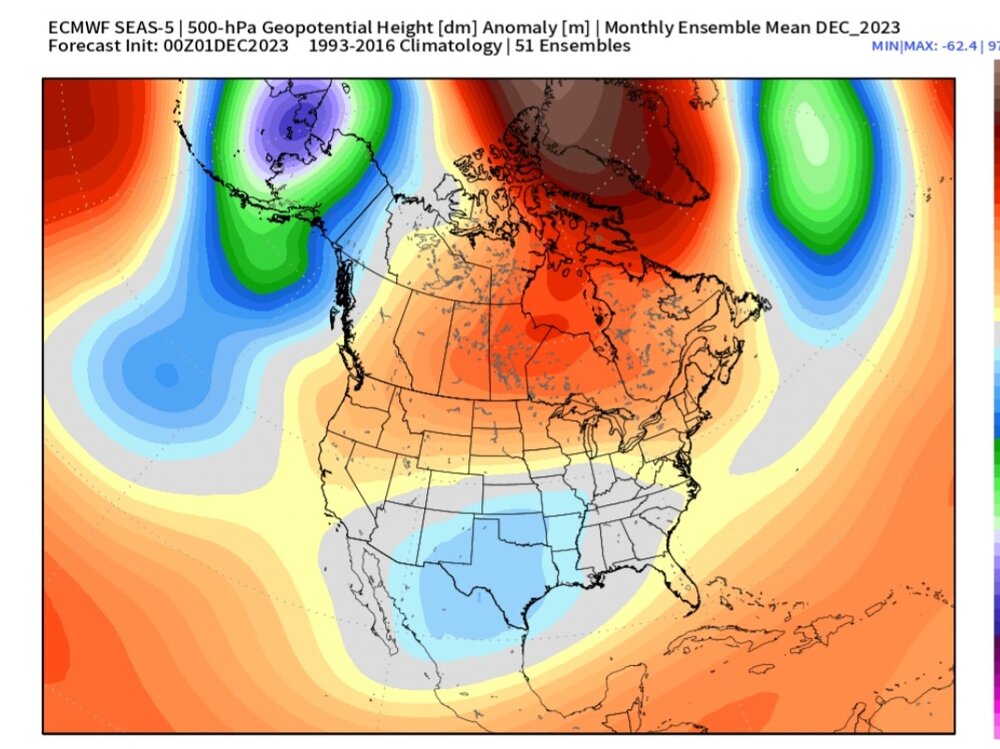
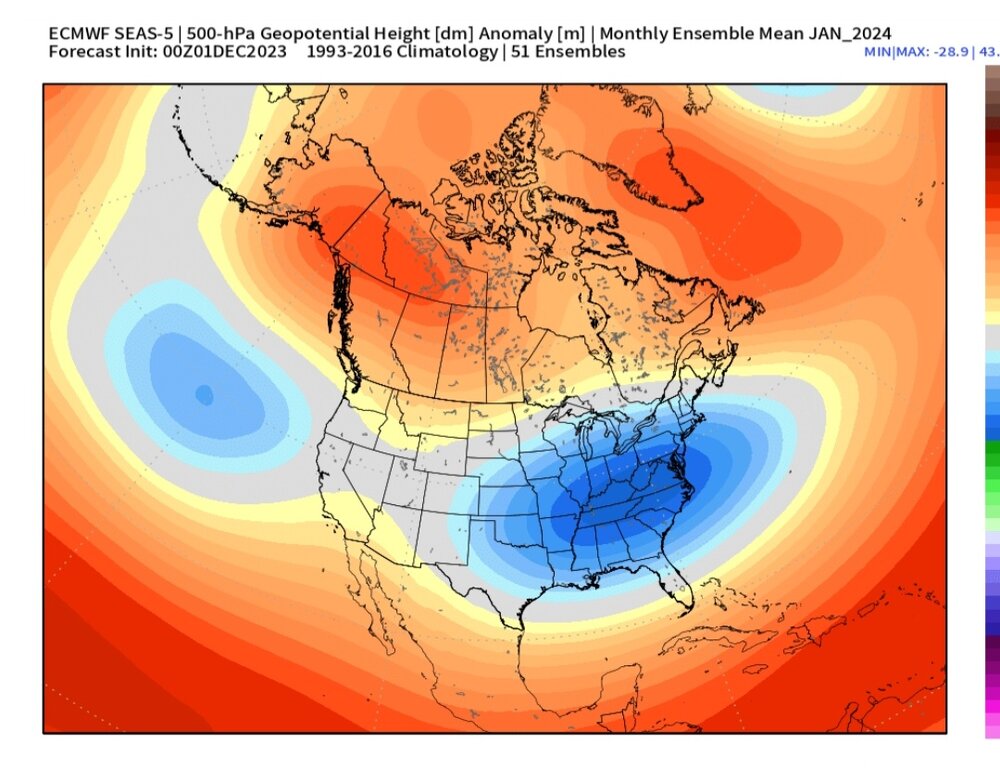
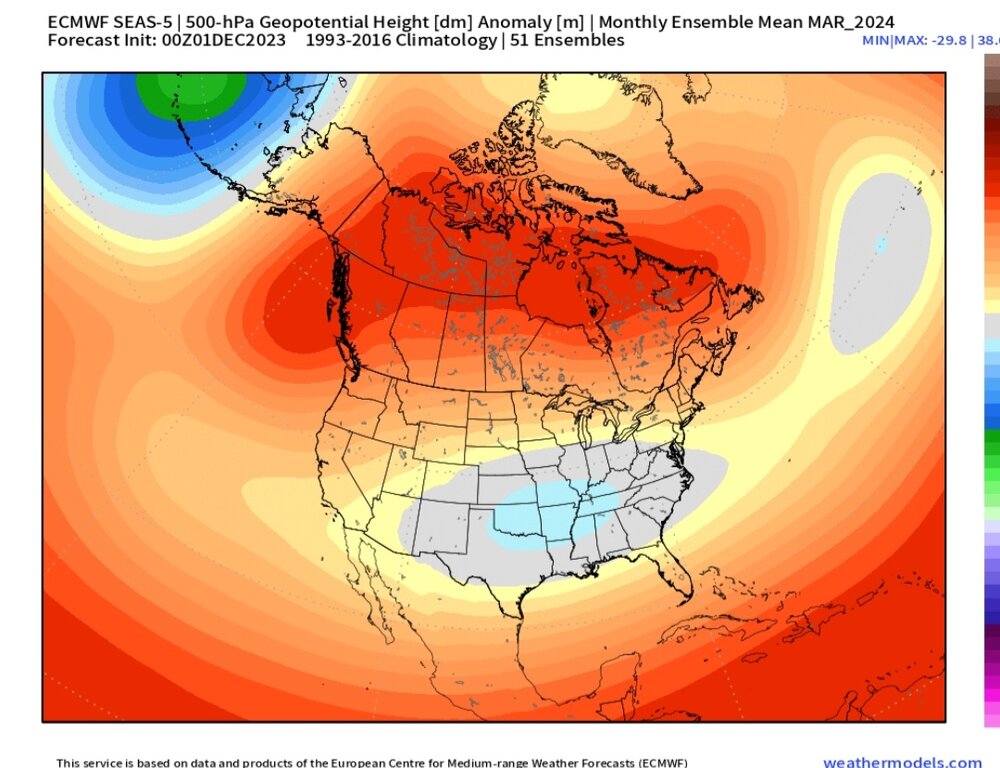
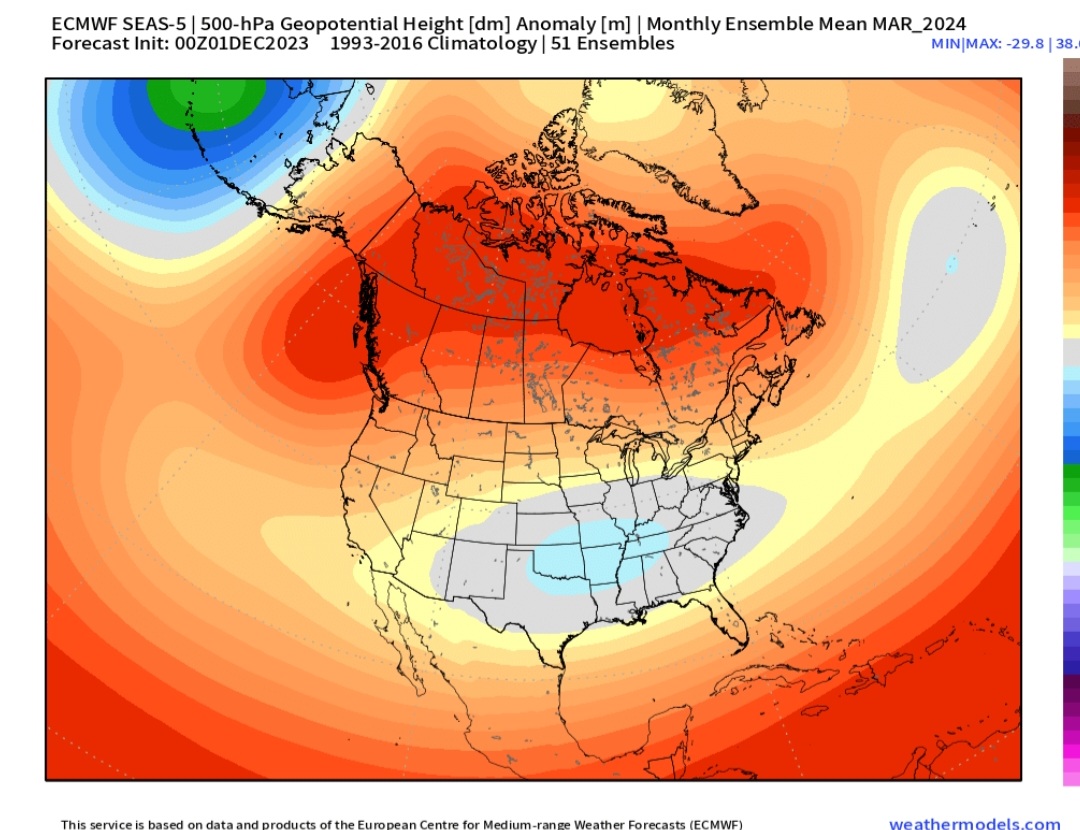
Euro Seasonal Update
DEC
JAN
FEB
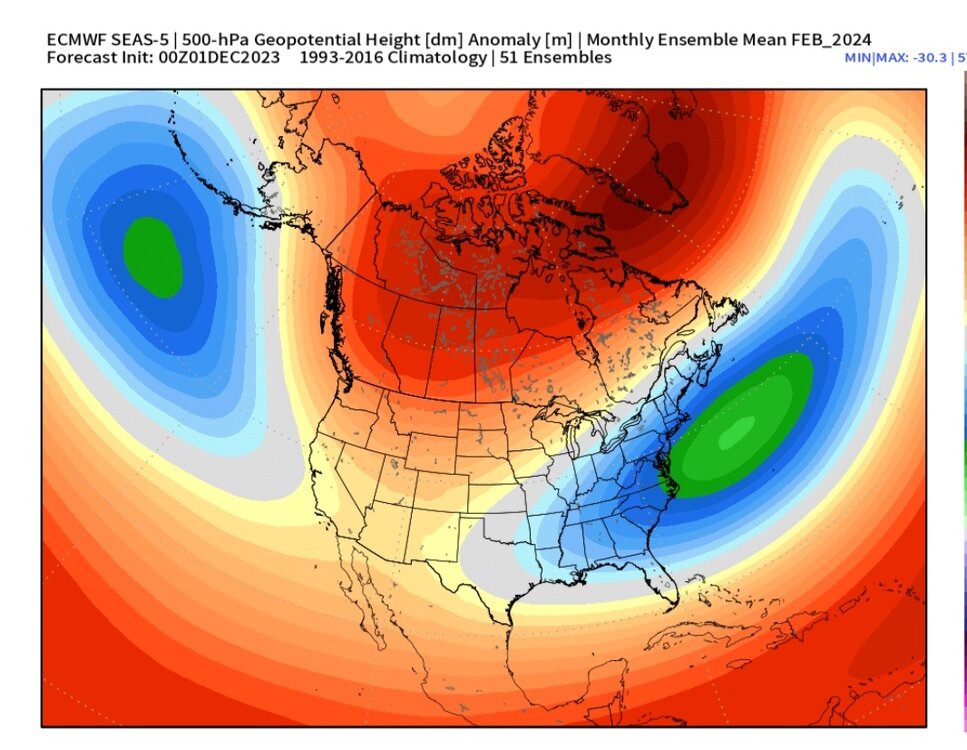
MAR
-
5
-
4
-
-
Euro Seasonal Update
DEC
JAN
FEB
MAR
-
8
-
-
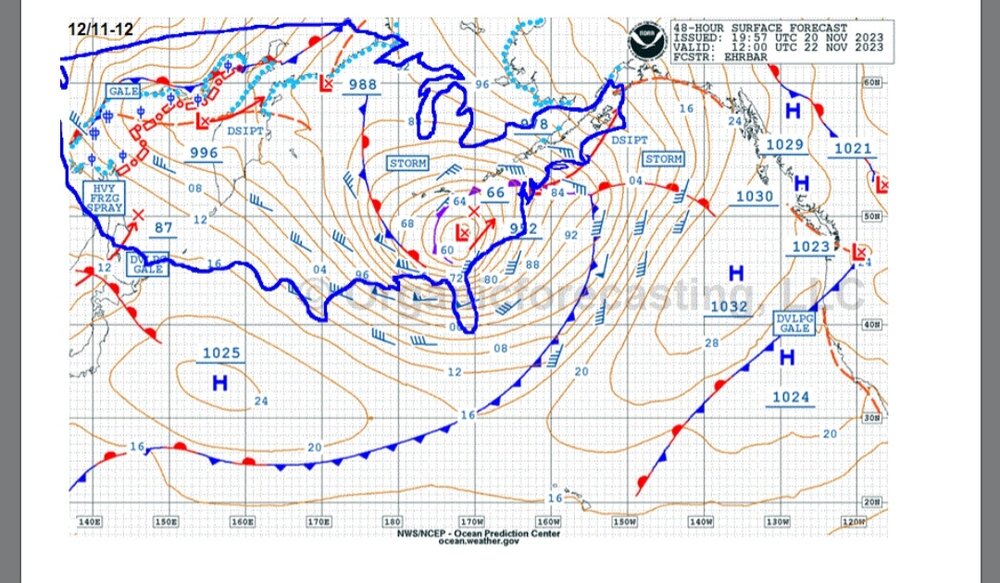
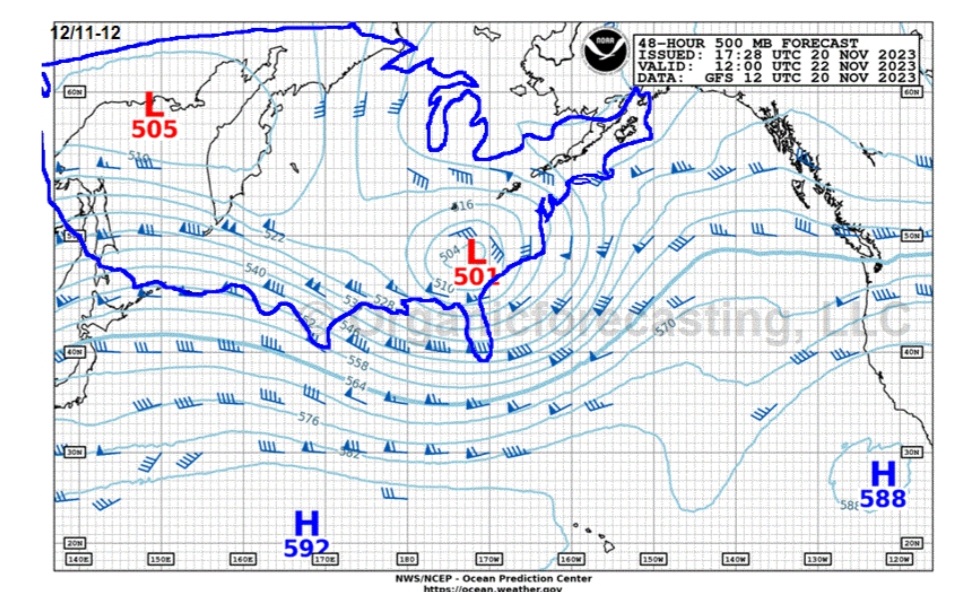
On 12/1/2023 at 4:11 PM, griteater said:
Good to see you in these threads Don. Yeah, I saw that about the NOAA PV Blog. I thought Judah Cohen's PV blog was a good one this week (https://www.aer.com/science-research/climate-weather/arctic-oscillation/). He mentioned that Canadian Warmings are often followed by PV stretching and cold outbreaks (even though at the time, the models weren't showing the PV stretching)...but sure enough, the models have come around to that a bit in the strat, just not showing much AK ridging in the trop...but that could change in time (I think it will).
This is an Op run (GFS), but it shows the potential strat progression which could aid a cold outbreak
Interestingly, something similar occurred at the end of October. I'd look it up but ESRL is down at the moment.
Obviously the implications are greater now than then...just thought it was interesting that it's a repeat.
-
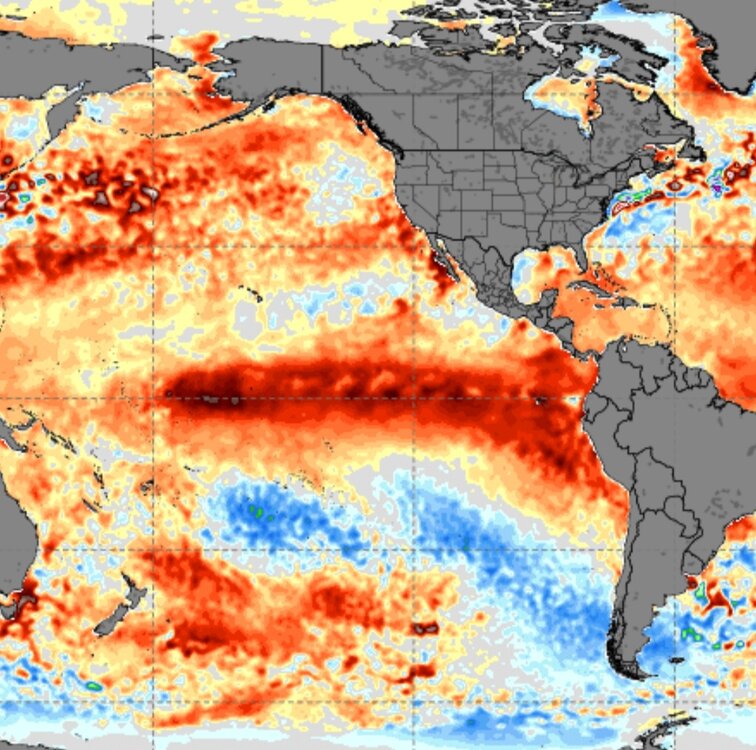
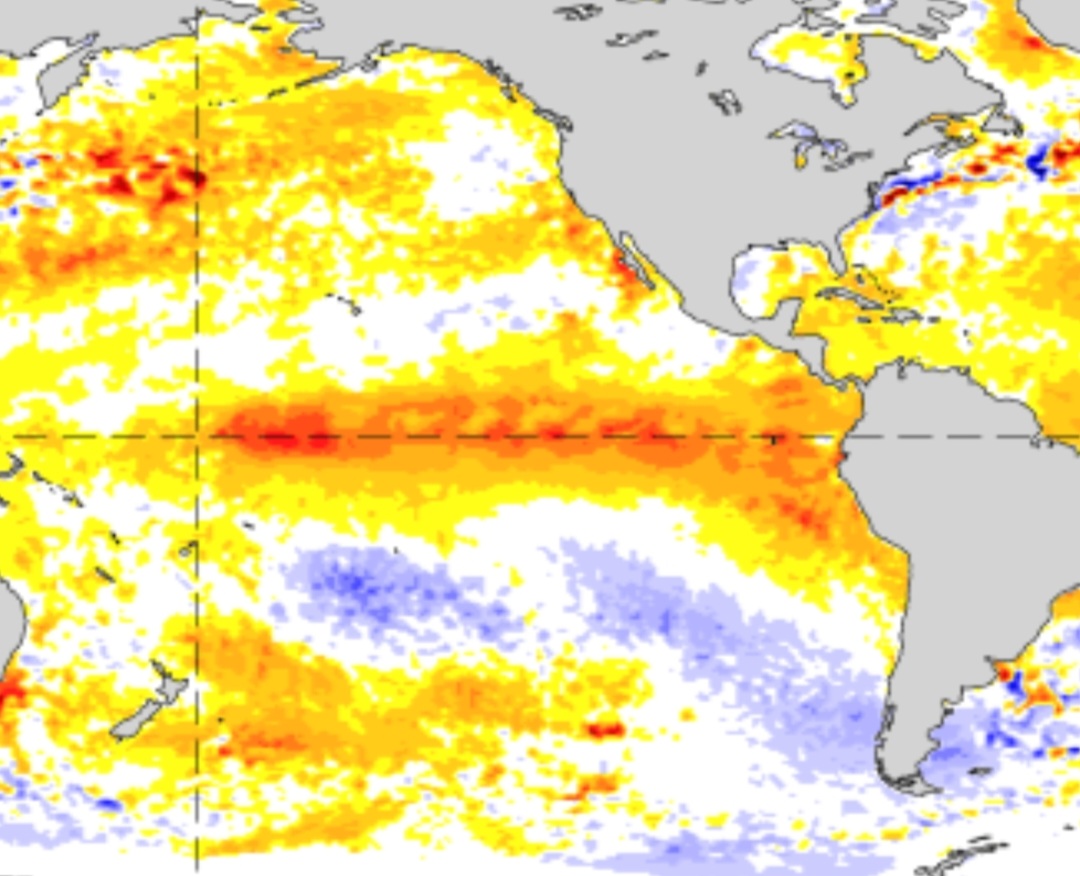
Both daily SST's of today:

-
2
-
-
3 hours ago, snowman19 said:
How can I give my opinion on a hypothetical cooling you are hoping for that hasn’t even happened yet? Why are you so confident there is going to be this massive drop in SSTs? So you are predicting a very huge trade wind burst then I guess? I mean in fairness, you have been minimizing this event for months. I understand why you didn’t want to see this get as strong as it is nowEven Roundy says there will be some brief cooling.
-
1
-
-
19 hours ago, 40/70 Benchmark said:
I feel like he has done a better job of being a bit more objective.
He just trolls winter lovers every now & then but he's usually actually targeting JB.
-
4 hours ago, 40/70 Benchmark said:
That thread is golden!! Really a great educated explanation of where things are more than likely moving!
I scratch my head as to why @snowman19only posts certain tweets of Eric's.
@snowman19I'm just messing with you! Ha!
-
2
-
 2
2
-
 1
1
-
-
JMA new December Forecast

Most of big cold in Europe & Asia, but that's certainly not a blowtorch CONUS.
JMA old DEC forecast

Also is a reminder not to put much stock in Seasonal model updates coming up for JAN/FEB.
-
2
-
-
2 hours ago, snowman19 said:
FWIW…In light of recent blocking it makes one wonder why the models are failing so bad on predicting it.
-
-
3 minutes ago, snowman19 said:13 minutes ago, NEPASnow said:Is there any truth to this, I've never heard of this before.
is this related to sun spots?
No, wrong. Quite the opposite, high geomag corresponds to +NAO/+AO actually. Tony Pann is a weenie met just like Bastardi, Margavage, Mugusity Steve D and more recently Cosgrove
Basically the list is any dissenting thought from the cult, lol.
But you are correct on the geomag. Anthony Masiello has a good handle on that. Where did that dude go?
-
1
-
-
19 minutes ago, bluewave said:
A large number of individual years did work out as you posted a few posts back. My analysis covered a large portion of the CONUS. So cherry picking a few locations on the map that didn’t work out is missing the point. 20 years isn’t that small of a sample size. And if you were so concerned about the science, you wouldn’t have taken the name of a discredited stadium wave paper which proclaimed that global warming was going to level off after 2010 or pause until the late 2020s when the opposite has occurred.
That's not why I chose the name. But I do like Judith Curry.
You picked 3 years, which IS a small sample size. We're talking El Nino.
And I didn't cherry pick anything.
-
1
-
-
46 minutes ago, bluewave said:
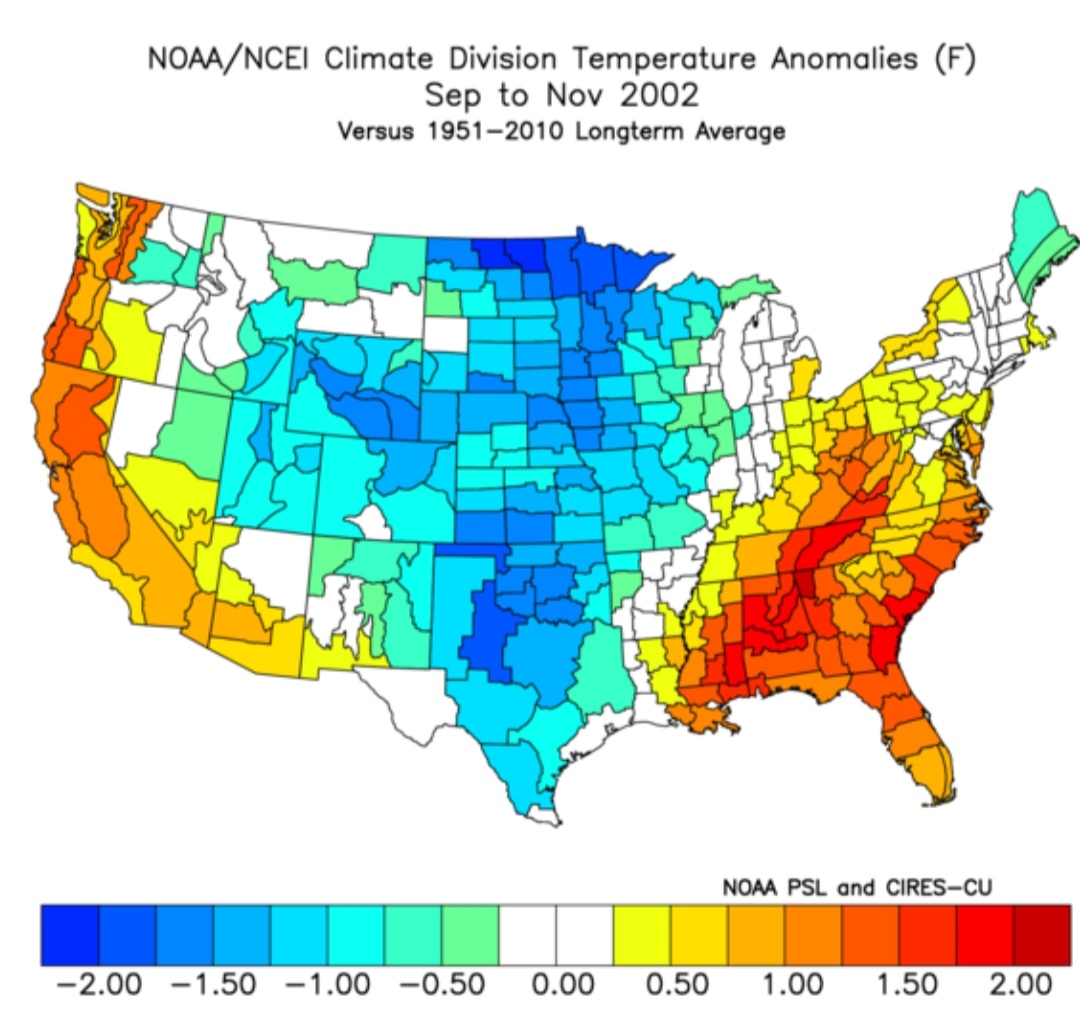
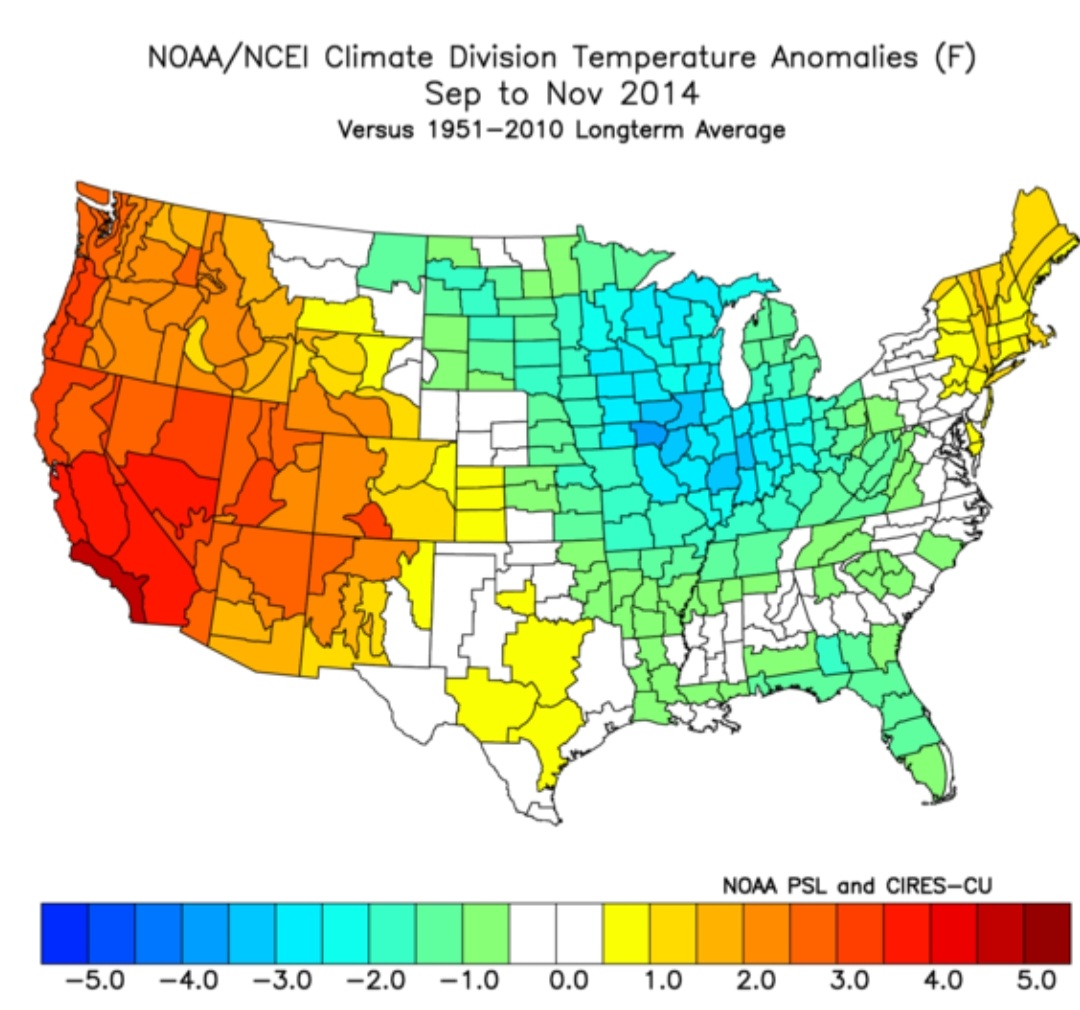
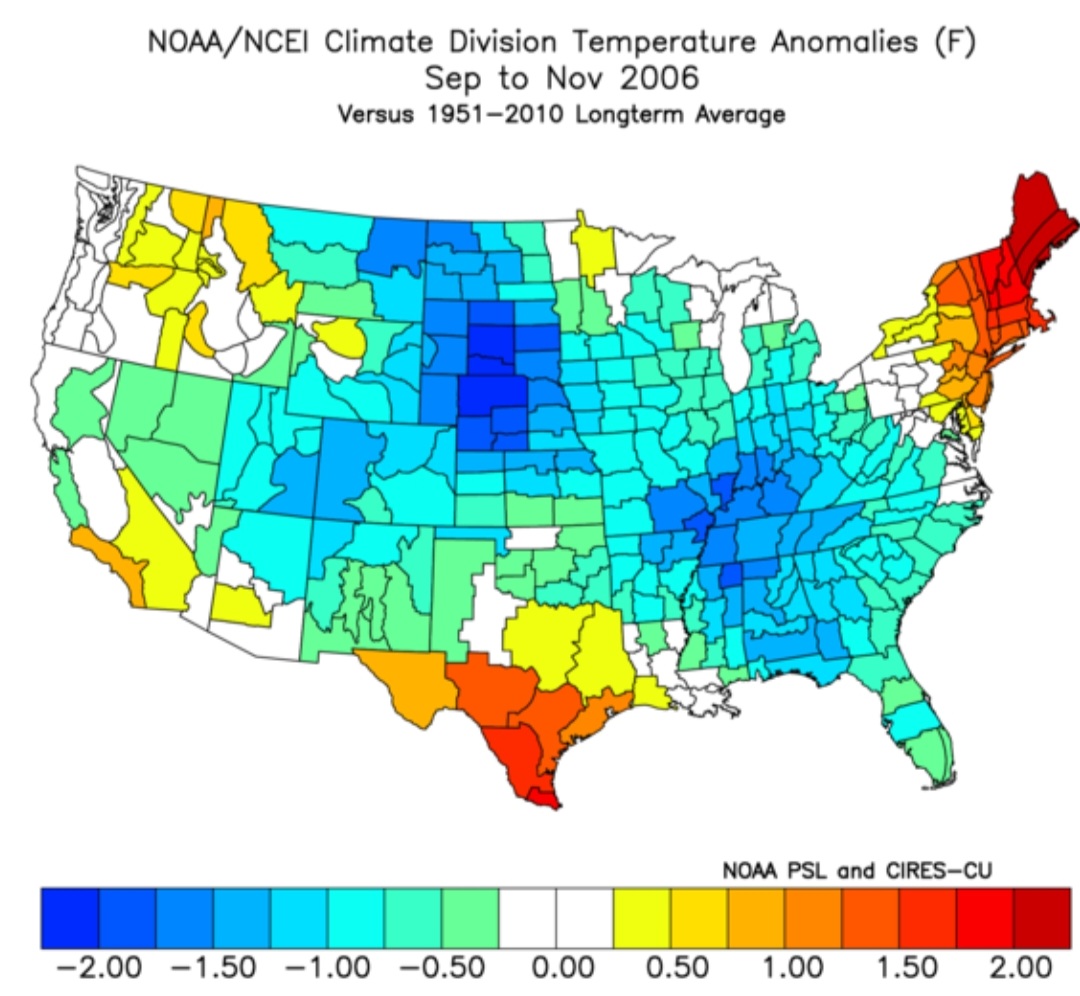
The correlation has worked out for every El Niño since 02-03. But for some reason, it didn’t really exist before that. The 3 coldest El Niño falls into the Plains and Great Lakes in 02, 09, and 14 expanded a few degrees eastward for the winter. Then the colder in Plains and warmer in the East El Niño falls of 06 and 18 repeated for the winter. I chalk this up to our new era of stuck and stagnant weather patterns. So a fall pattern can linger in some fashion into the winter.


Oh brother more CC.
If you would just look at the individual years it doesn't appear that way as it did when you use a blend to smooth it over.
And it's just not good science to use a small sample size of 3 winters, which individually don't correlate as well as you're indicating, and then draw robust conclusions.

-
4
-
-
2 hours ago, bluewave said:
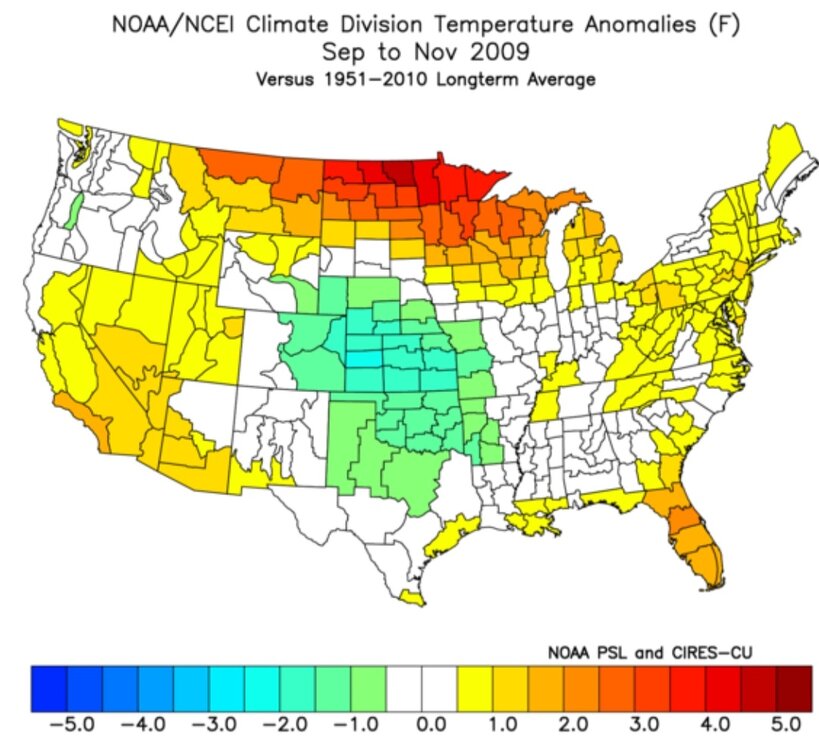
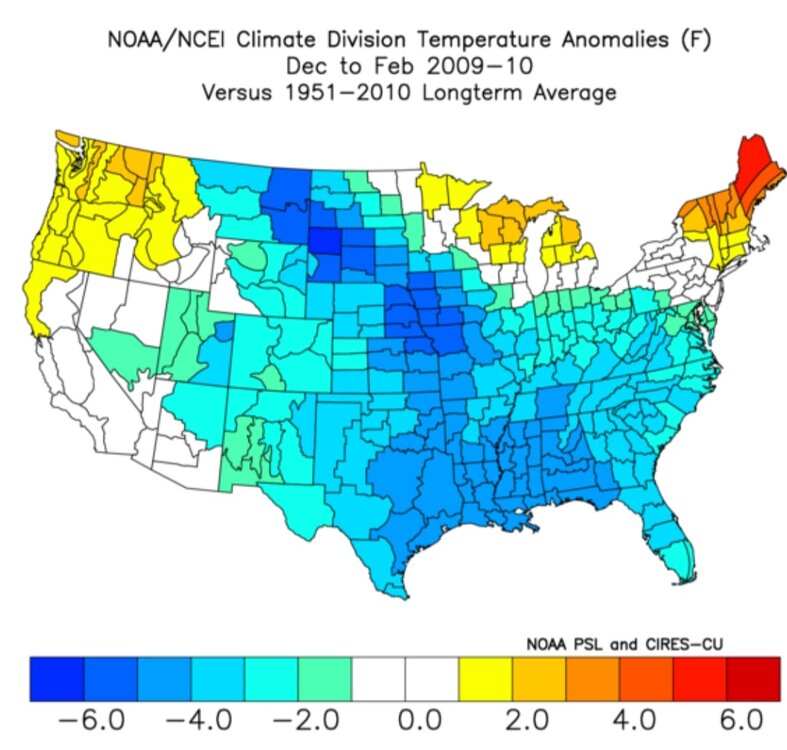
I did find a relationship between fall (SON) temperature departures and winter CONUS departures. While this pattern just emerged in 2002, it has worked out each El Niño year since then.Very similar temperature departure patterns in the fall to winter. They fell into 3 groups. The first is the colder falls which preceded the colder winters. Next was the colder falls to the West and warmer along East Coast which repeated during the winter. The final group was the warmer falls across the the entire CONUS and the warmer winters across the Northern tier to Northeast. This fall has matched the warmer years of 2004 and 2015. But luckily, we didn’t reach the magnitude of the fall 2015 warmth. That would be a tough act to follow anyway. So somewhere in between 04-05 and 15-16 for fall departures. This would mean above average temperatures this winter near upper Midwest and Great Lakes to Northeast.


So 8 El Ninos. Only 3 were on the colder side in the period you mentioned...since 2002.
2002-03, 2009-10, 2014-15
#1 The sample size is too small. And periods before that it certainly was not true. Some cold El Nino winters had mostly warmer than average falls. With that being the case, only 3 cold El Nino winters in the period you mention is not enough to draw a predictive correlation.
#2 The correlation does not workout the way you said.
On the cold years:
2002-2003

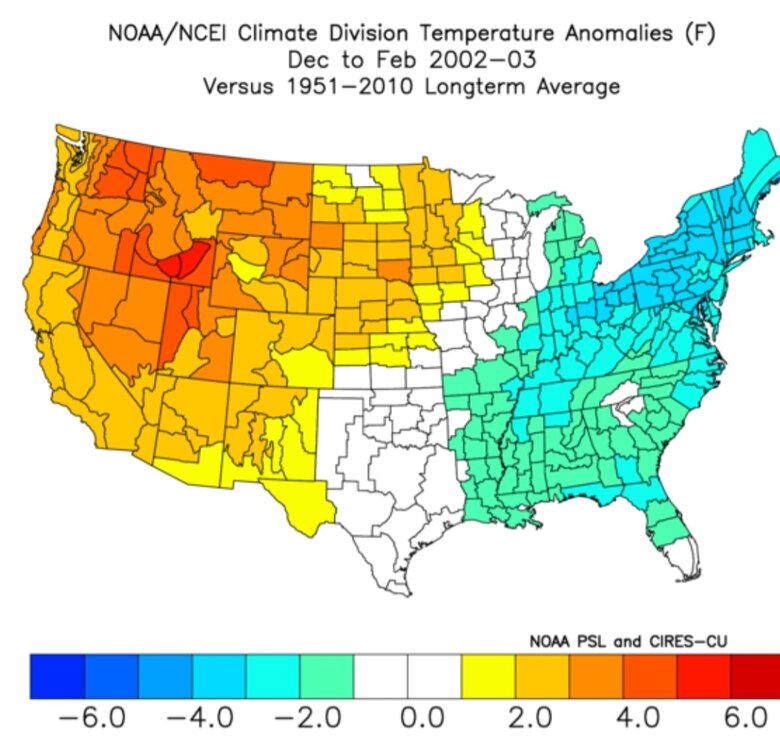
2009-10
2014-15

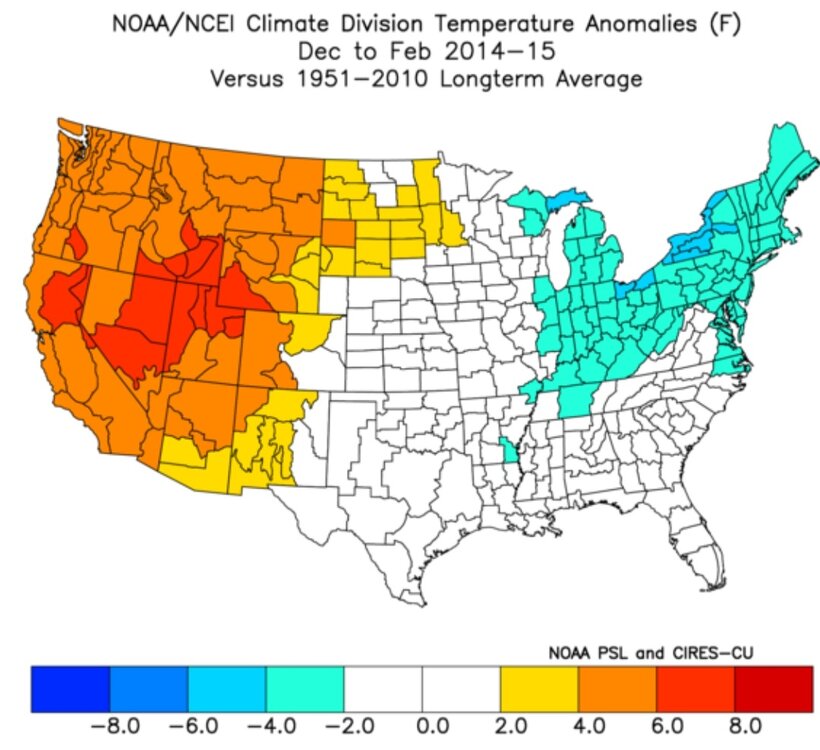
That does not work out in such a way, that one can look at that & predict. 2014-15 was the closest.
Also, one of the years had a cold fall for most of CONUS & a mostly warm winter:
2006-07
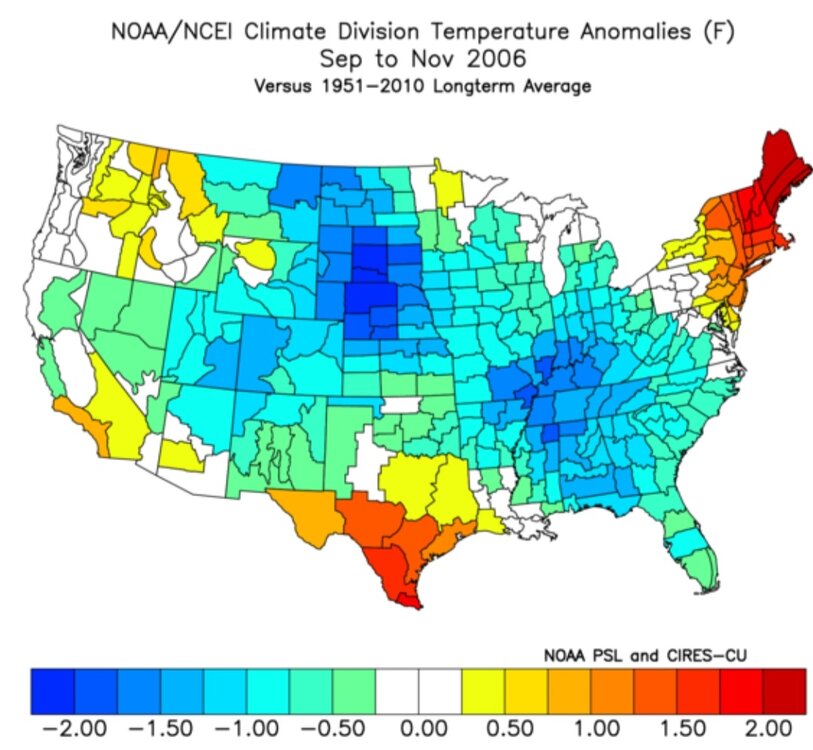
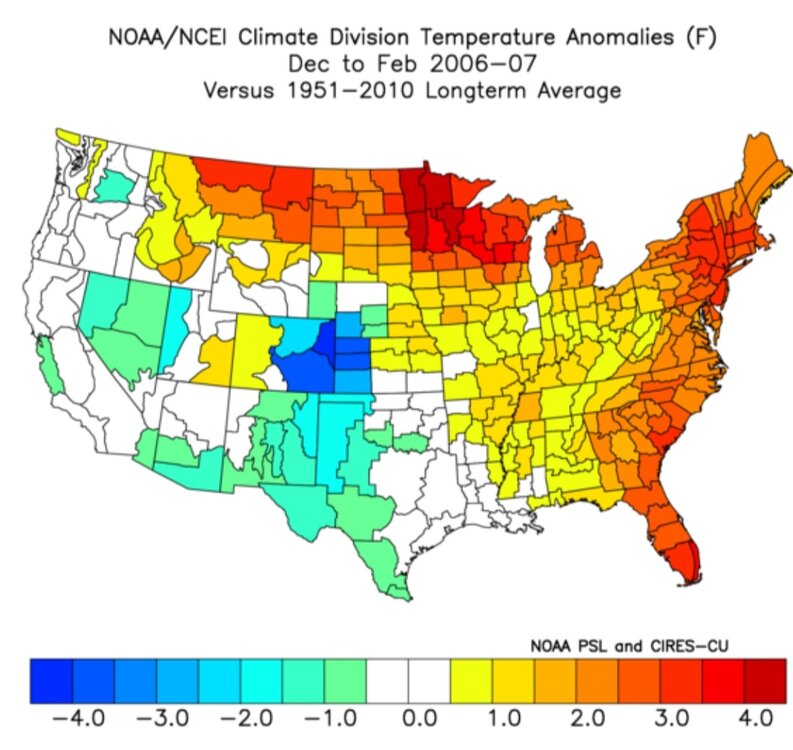
So, the coldest fall nationwide of the 4 had the warmest winter of the 4.
#3 The correlation is certainly not true when considering different parts of our large CONUS.
BOTTOM LINE:
We have to be careful that our subjective bias' to prove a point, does not lead us to see what we want to see. I'm not 100% accusing you of that because you're a great poster, but we certainly all have to be careful.
When I look trough all the El Nino years we have good data on, the biggest take away is that on average most El Nino falls are cooler regardless of winter. And some warm falls have had really cold winters. Recent history is a mix.
-
7
-
1
-
-
51 minutes ago, bluewave said:
I did find a relationship between fall (SON) temperature departures and winter CONUS departures. While this pattern just emerged in 2002, it has worked out each El Niño year since then.Very similar temperature departure patterns in the fall to winter. They fell into 3 groups. The first is the colder falls which preceded the colder winters. Next was the colder falls to the West and warmer along East Coast which repeated during the winter. The final group was the warmer falls across the the entire CONUS and the warmer winters across the Northern tier to Northeast. This fall has matched the warmer years of 2004 and 2015. But luckily, we didn’t reach the magnitude of the fall 2015 warmth. That would be a tough act to follow anyway. So somewhere in between 04-05 and 15-16 for fall departures. This would mean above average temperatures this winter near upper Midwest and Great Lakes to Northeast.
I have to look into that myself. If that were the case & it were that simple, winter forecasting be a breeze. As bad as winter forecasting is every year by great MERS, I highly doubt this correlation stands.
-
2 hours ago, jbenedet said:
Still not following the logic here. Seeing a weak El Niño atmospheric response to date has allowed El Niño conditions to intensify, and also (obviously) means it just shows up at a later winter date.
Unless we capitalized on a snowier than normal November (did not) and December (remains to be seen)—this is a better argument for those calling for warmer/less snowy winter in the CONUS.
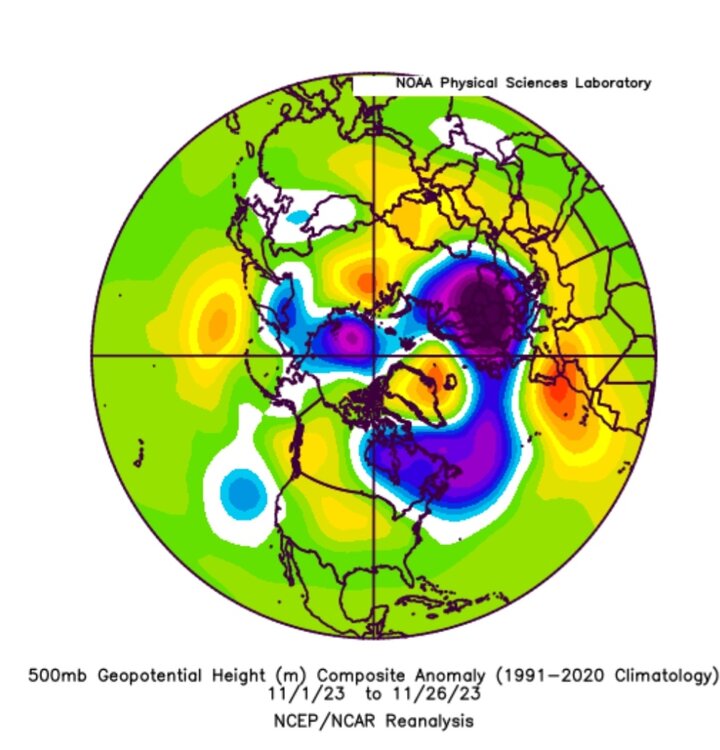
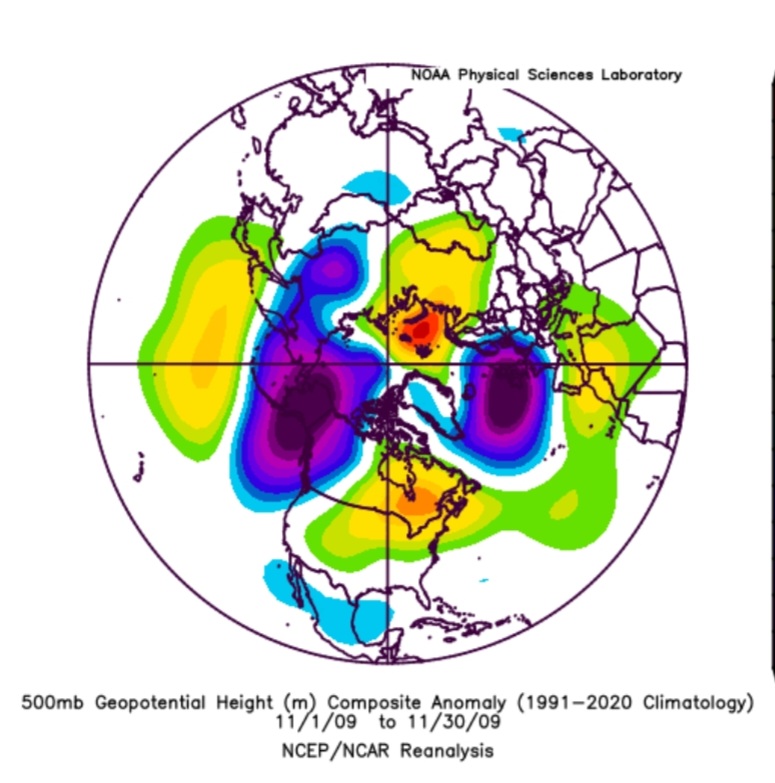
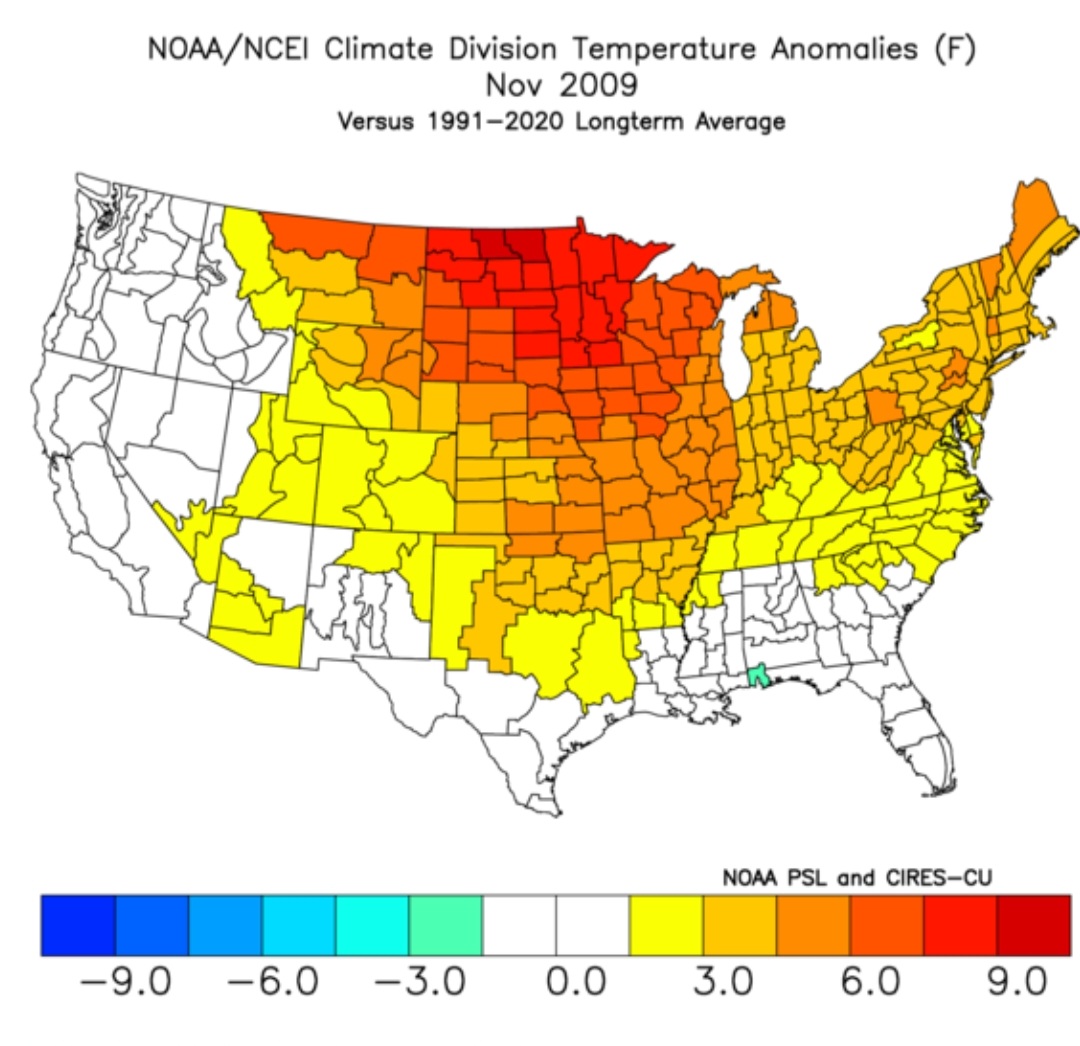
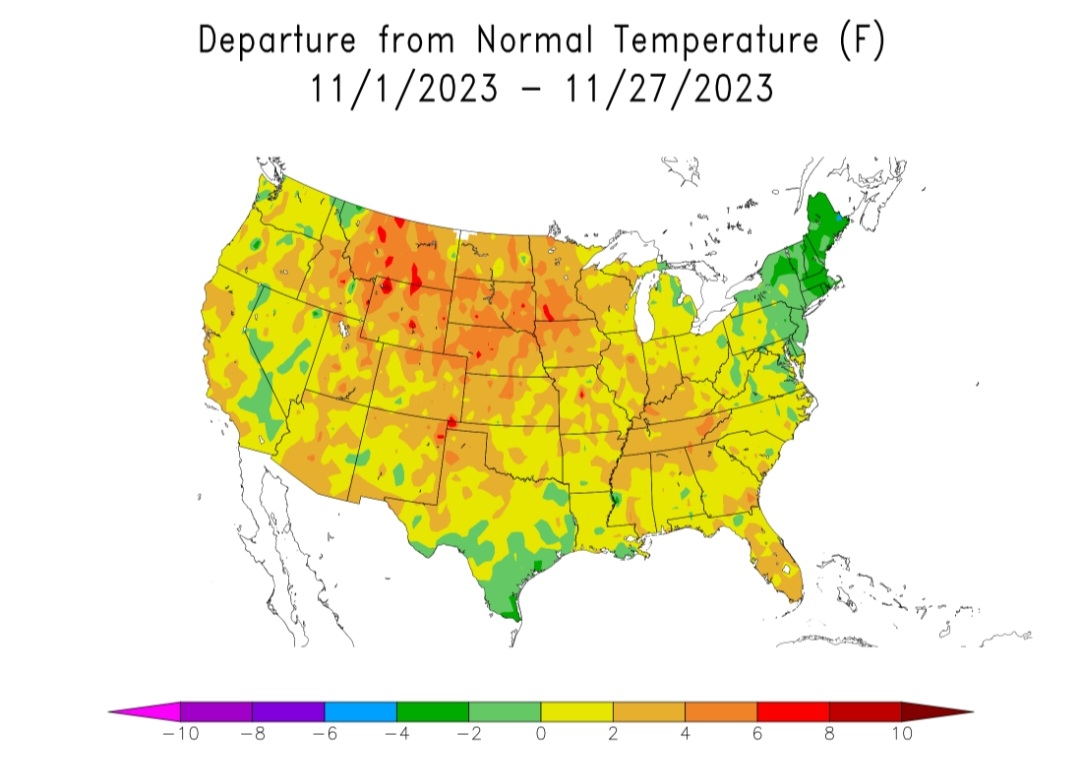
I'm having trouble following your argument as well. A warm El Nino NOV does not indicate a warm winter.
Here's NOV 2009
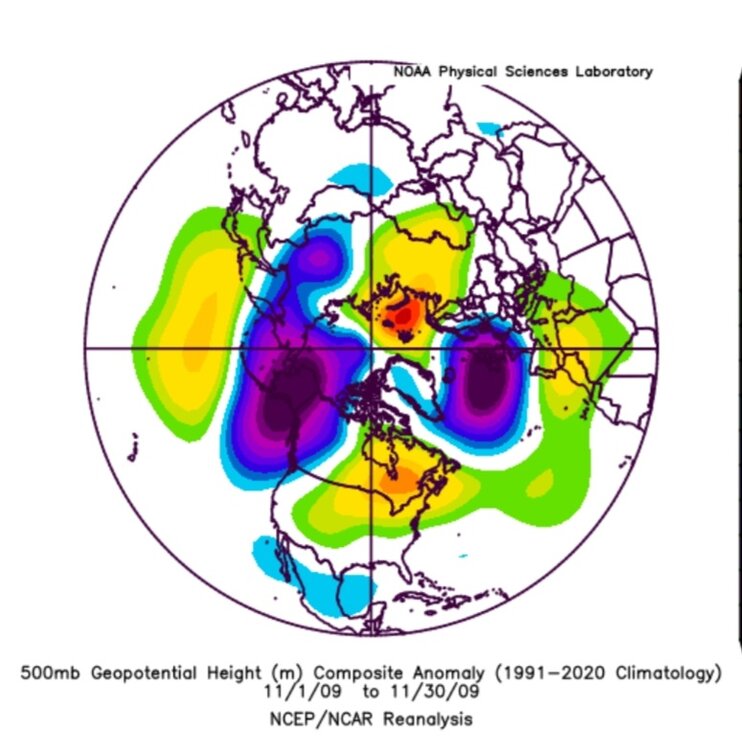

2023

-
1
-
-
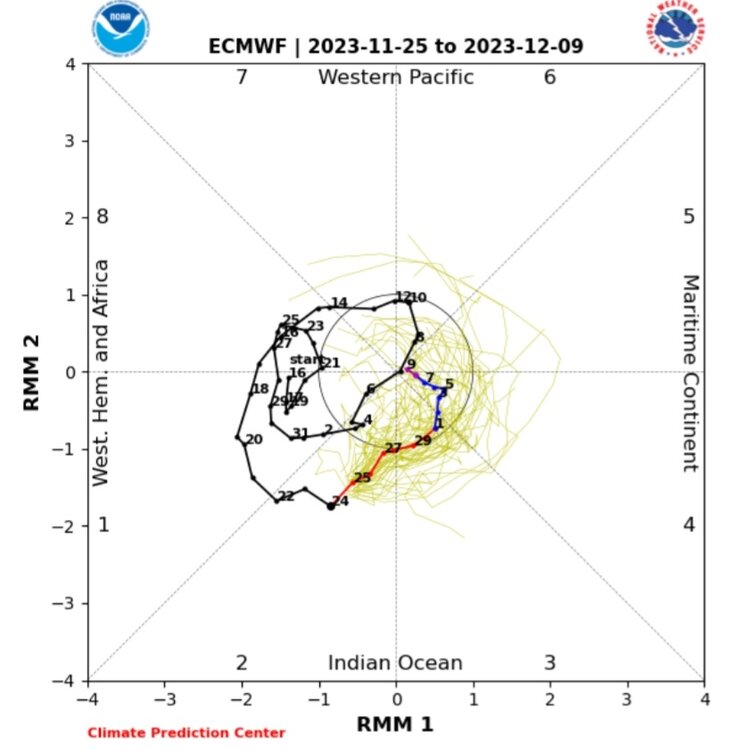
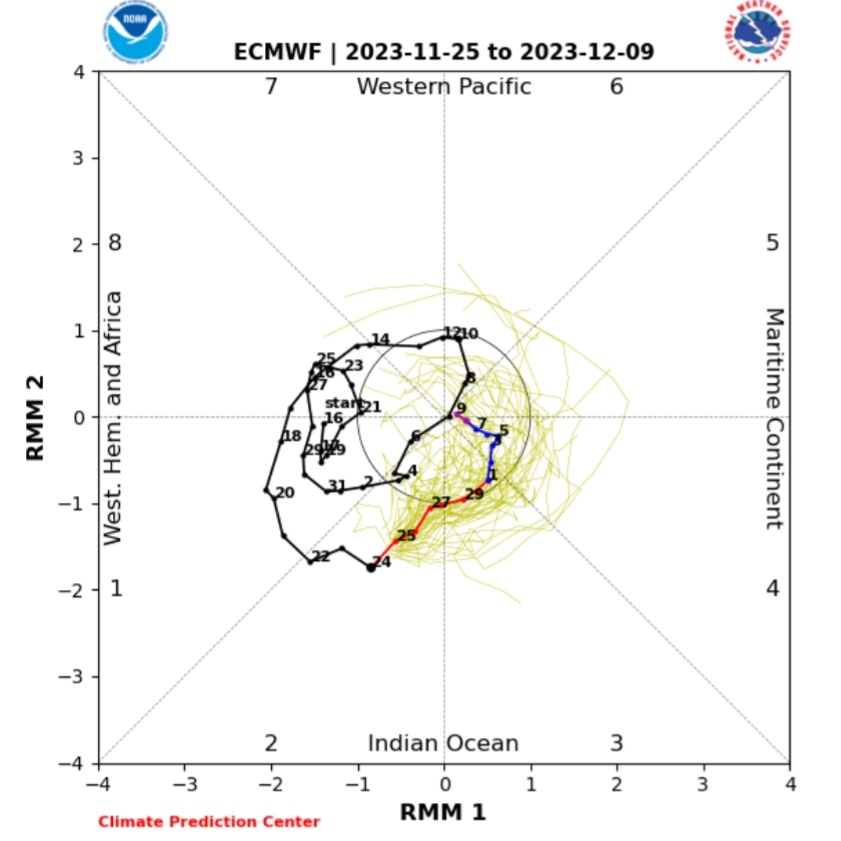
33 minutes ago, Terpeast said:
Looks like a lot of spread, but based on my research some of the best winter events start as a shortwave entering the conus when the mjo is in 7.
So it looks like our best chances will come after Dec 11, and if this RMM forecast holds, through christmas/new years.
-
1
-
-
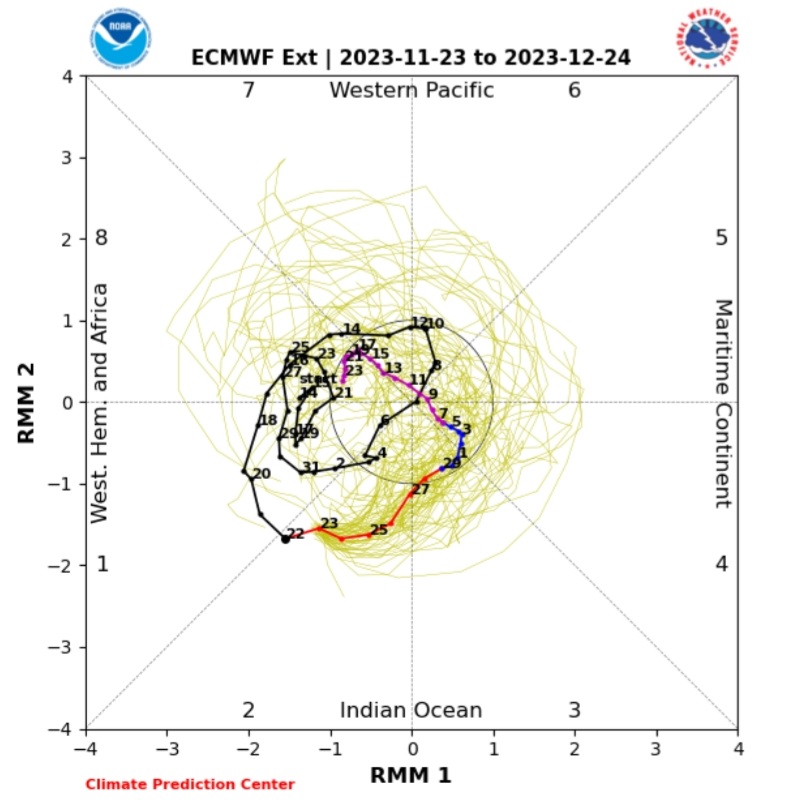
1 hour ago, Stormchaserchuck1 said:
Looks like some unfavorable phases coming up
https://www.cpc.ncep.noaa.gov/products/precip/CWlink/MJO/CLIVAR/clivar_wh.shtml
Euro never makes it to Phase 3.

-
5
-
1
-
-
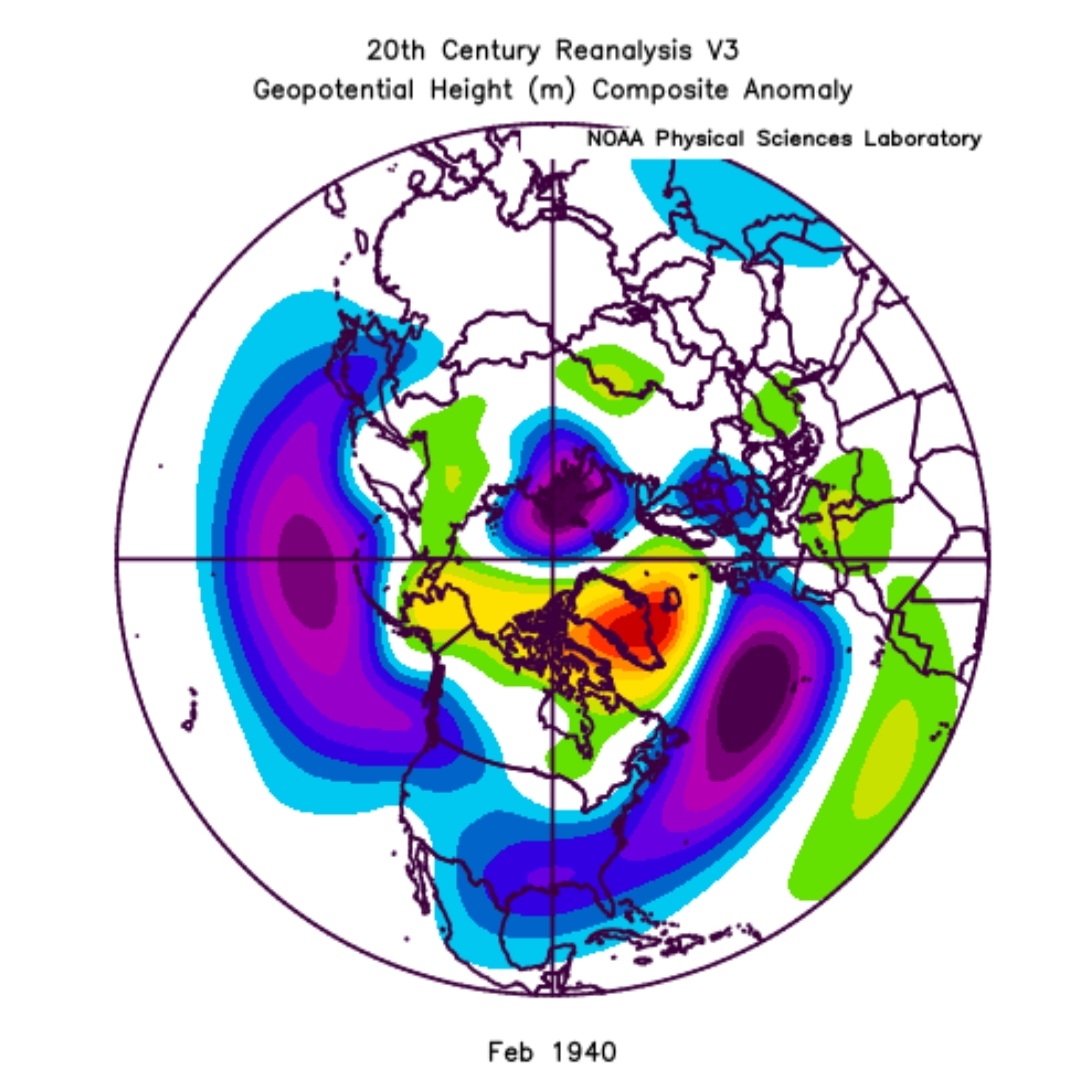
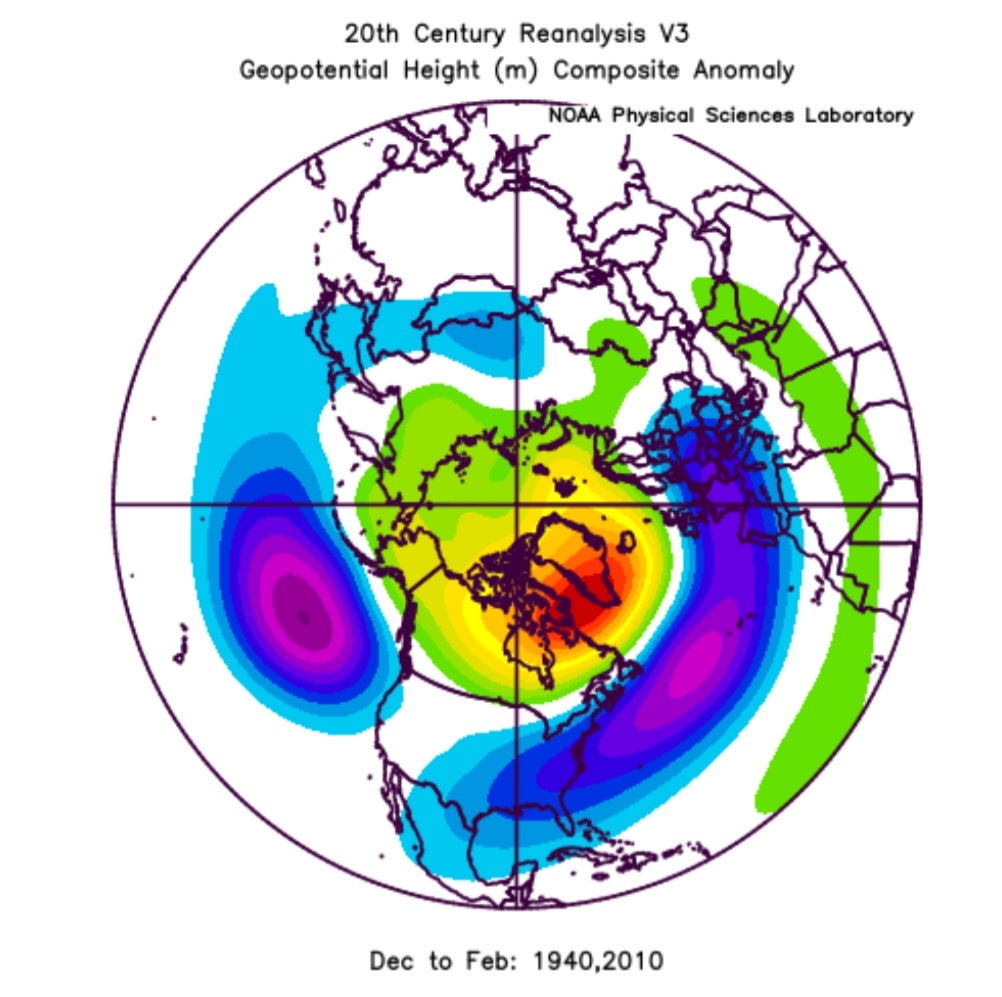
15 minutes ago, stadiumwave said:
#1 -2009-10...I know you're all familar with.
#2 1939-40...I'll post DJF & then a blend with 2009-10
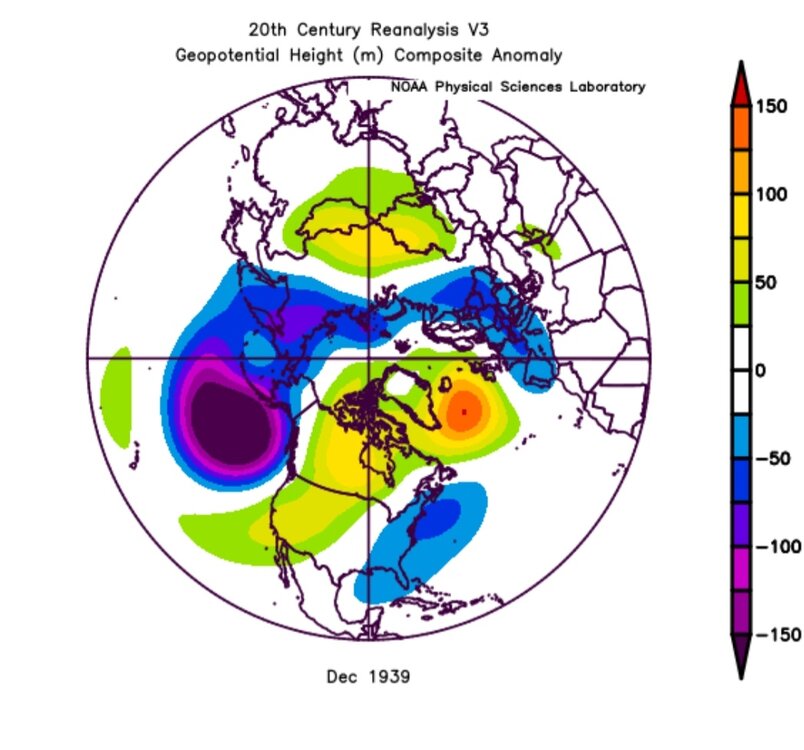
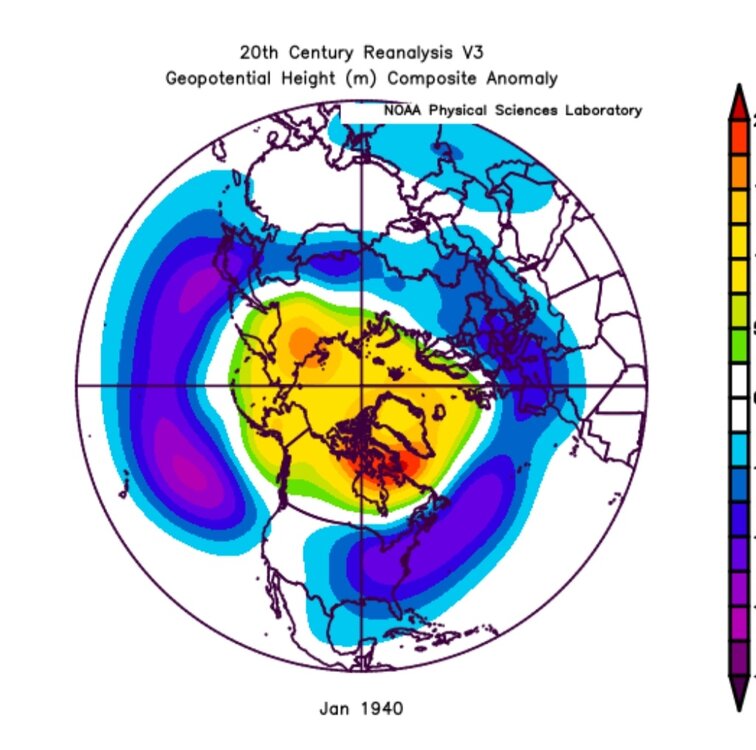

DJF Blend

-
1
-
3
-
-
-
12 hours ago, griteater said:
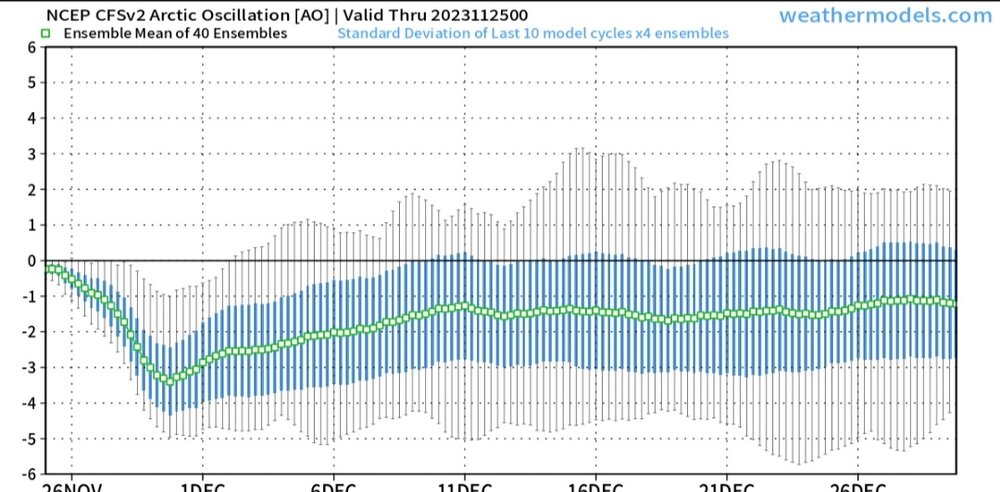
I called for AO and NAO to be positive in Dec as well (forecast from 11/8), and negative averaged for Jan-Mar
CFS forecasts -AO for entire month of DEC now
-
7
-


El Nino 2023-2024
in Weather Forecasting and Discussion
Posted
Euro, Day 10
10mb
50mb