

stadiumwave
-
Posts
1,168 -
Joined
-
Last visited
Content Type
Profiles
Blogs
Forums
American Weather
Media Demo
Store
Gallery
Posts posted by stadiumwave
-
-
DMI has begun updating their PolarPortal website to show 2015 surface conditions. Here is the daily and accumulated Surface Mass Balance (SMB) plots:

I found it interesting that over the winter Greenland had a lot more surface accumulation than 2012 did, but currently 2015 is starting the melt season from about the same point as 2012.
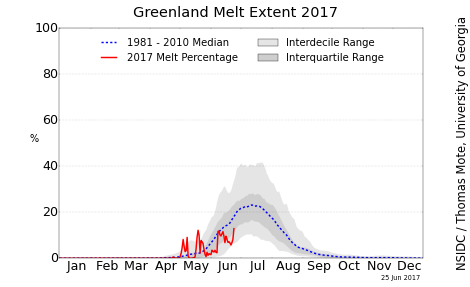
NSIDC is also showing the GIS as having a slow start to the melt season:
It's not all that surprising that 2015 is starting off slower. We've had a +NAP signature for nearly the entire winter which keeps below anomalies over Greenland. PV camped over or near Greenland. Spring has been the same for the most part with the exception if a short-lived -NAO.
Forecast over the next 8-14 days more of the same with below anomalies over Greenland.
Greenland Melt Discussion
in Climate Change
Posted
Forecast over the next 8-14 days more of the same with below anomalies over Greenland.