eduggs Posted December 29, 2025 Share Posted December 29, 2025 11 hours ago, bluewave said: I can see both of your points. Don is coming more from a letter of the law perspective and you from the spirit of the law. "Letter of the law" how so? All the data I've pored over supports the idea that the NAM performed best with QPF and ptype from about 3 days out until Friday afternoon. The ECM was probably second best with a late adjustment northeastward. The NAM was consistently 0.2 - 0.5" liquid across the NYC metro with a frozen ptype over its last few runs before the event. Despite "generous" final tallies for EWR and NYC, that's how it played out. It was best in the LHV, ENY, CT, and SNE. The ECM was too far southwest across the board. I'm not even sure how this is contentious. I feel like Don is/was biased against the NAM leading to a non-scientific and distorted assessment. Link to comment Share on other sites More sharing options...
eduggs Posted December 29, 2025 Share Posted December 29, 2025 On 12/27/2025 at 8:21 AM, donsutherland1 said: 18z NAM vs. 18z HRRR: Here's how I fared against the two models: Final Accumulations: Bridgeport: 7.1" Islip: 6.6" New York City-Central Park: 4.3" New York City-JFK Airport: 4.1" New York City-LaGuardia Airport: 4.1" Newark: 4.2" The low end of the 4"-8" idea worked out. The loss of precipitation from the weak lift that developed in the spacing between the surface and mid-level low likely deprived the region of several inches of snow. It also allowed for some intrusion of sleet into the greater New York City area for a time until the lift improved. Don, where did you get your numbers for the 18z HRRR and NAM output? They don't match pivotal, so I assume you derived them somehow. But using what method? I don't think you responded to this question from earlier. To my knowledge, bufkit does not output snow/ice accumulations. Your tables also reinforce the false belief that weather models generate forecasted snowfall as output. Link to comment Share on other sites More sharing options...
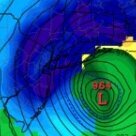
eduggs Posted December 29, 2025 Share Posted December 29, 2025 18z NAM (10:1) vs. interpolated and smoothed NWS reports (PHI, OKX, ALB, and BOS) Link to comment Share on other sites More sharing options...
eduggs Posted December 29, 2025 Share Posted December 29, 2025 Not only did the NAM capture the gradient across our area better than all other models, it also correctly shifted north of the consensus days before the event. The ECM, for example, incorrectly still had snow in southern NJ overnight Thurs. As Don said, the NAM was an outlier during this time. BUT IT WAS CORRECT, which makes it even more impressive. Link to comment Share on other sites More sharing options...
donsutherland1 Posted December 29, 2025 Share Posted December 29, 2025 7 hours ago, eduggs said: Don, where did you get your numbers for the 18z HRRR and NAM output? They don't match pivotal, so I assume you derived them somehow. But using what method? I don't think you responded to this question from earlier. To my knowledge, bufkit does not output snow/ice accumulations. Your tables also reinforce the false belief that weather models generate forecasted snowfall as output. I posted the maps for both models. The numbers are from the maps. Nothing is derived. Bufkit computes snow using 4 algorithms and uses 1:1 for sleet. Link to comment Share on other sites More sharing options...
bluewave Posted December 29, 2025 Share Posted December 29, 2025 8 hours ago, eduggs said: "Letter of the law" how so? All the data I've pored over supports the idea that the NAM performed best with QPF and ptype from about 3 days out until Friday afternoon. The ECM was probably second best with a late adjustment northeastward. The NAM was consistently 0.2 - 0.5" liquid across the NYC metro with a frozen ptype over its last few runs before the event. Despite "generous" final tallies for EWR and NYC, that's how it played out. It was best in the LHV, ENY, CT, and SNE. The ECM was too far southwest across the board. I'm not even sure how this is contentious. I feel like Don is/was biased against the NAM leading to a non-scientific and distorted assessment. The raw NAM point forecasts from just west of Newark out across NYC and the 5 boroughs were too low for snowfall. Multiple runs only had around 1-2 inches of snow where around 4” verified. So the NAM was overdone on the warm nose. But globals like the GFS and Euro were underdone on this feature and dry slot. So these models were incorrect to forecast warning level snows at times for NYC and points west. No one model is going to be correct about everything. So we have to blend the models to get something closer to reality. This blending is why I went 3-5” for NYC. But areas further east across Long Island where I went 5-8” were more accurately portrayed by other models. Although some NAM runs maintained all snow in these areas. We need a new NAM since the model hasn’t been updated since March 2017. One of its biggest issues is how jumpy it is from run to run. This leads to some not taking anything the model says seriously. Even when the theme that NYC and points west would nit get warning level snows which turned out to be correct. 1 Link to comment Share on other sites More sharing options...
eduggs Posted December 29, 2025 Share Posted December 29, 2025 5 hours ago, donsutherland1 said: I posted the maps for both models. The numbers are from the maps. Nothing is derived. Bufkit computes snow using 4 algorithms and uses 1:1 for sleet. Your numbers are slightly off since you didn't include the final 18z NAM total. "Newark" was 0.8, NYC was 2.6, Bridgeport was 5.8, and Islip was 5.0". Just a few additional tenths, but it matters. I suspect the annotated value for EWR is wrong. Since Newark is north of Staten Island, that should definitely be above 1" and likely close to the value for MMU. Is it even known where Pivotal pulls these values from? The 18z HRRR was obviously way off across our area. It's way too snowy in NJ and PA and it lacks the gradient that was observed across the LHV and Long Island. Any analysis showing that it performed better than the 18z NAM across this area is seriously flawed. Link to comment Share on other sites More sharing options...
eduggs Posted December 29, 2025 Share Posted December 29, 2025 4 hours ago, bluewave said: The raw NAM point forecasts from just west of Newark out across NYC and the 5 boroughs were too low for snowfall. Multiple runs only had around 1-2 inches of snow where around 4” verified. So the NAM was overdone on the warm nose. Go back and check this. Look carefully at the maps I posted. The 18z NAM run right before the event was one of its least snowy runs. And it still showed 1-3" of (10:1) snow across Union (south) and Essex (north) Counties (EWR is right in between). Actual reports came in mostly in the 2-4" range including uncounted sleet, so about 1" off. Newark Airport at 4.3" was one of the highest reports for either county even though it's in the southern tip of Essex. The NAM was one of the few models to show sleet in Putnam County where I personally observed it. It also showed primarily sleet into Morris County before 9pm, which was also correct. It was the first and best model with the warm nose. The inv trof, which it also correctly showed lingering into Sat, was what delivered snow in NJ. I honestly think you guys arguing that the NAM did poorly are out of your minds. Link to comment Share on other sites More sharing options...
donsutherland1 Posted December 29, 2025 Share Posted December 29, 2025 51 minutes ago, eduggs said: Your numbers are slightly off since you didn't include the final 18z NAM total. "Newark" was 0.8, NYC was 2.6, Bridgeport was 5.8, and Islip was 5.0". Just a few additional tenths, but it matters. I suspect the annotated value for EWR is wrong. Since Newark is north of Staten Island, that should definitely be above 1" and likely close to the value for MMU. Is it even known where Pivotal pulls these values from? The 18z HRRR was obviously way off across our area. It's way too snowy in NJ and PA and it lacks the gradient that was observed across the LHV and Long Island. Any analysis showing that it performed better than the 18z NAM across this area is seriously flawed. I had used the initial map posted by MJO812 for the benchmark. Even with the adjustment for the the additional snowfall, the outcome changes very little. The NAM has had successes. This wasn't one around the New York City area, which was the focus of the discussion/model comparison, when it came to snowfall amounts leading up to the storm. The HRRR overdid some of the totals for New York City and Newark. It seems to have a cold bias. In the end, over several days of guidance, it was clear that this was going to be a 3"-6"/4"-8" storm for the New York City area. There was no real drama for this area. The RRFS A's attempts at suppression, NAM's swings/amounts for NYC-EWR, and GFS's elevated amounts were noise. IMO, this was probably among the more straightforward forecasting situations in recent snowstorms for the City and its nearby suburbs. That outcome shows up well in NWS-New York's (OKX's) final PNS report where almost 75% of all snowfall reports fell in the 4"-8" range and nearly two-thirds were in the 3"-6" range. This will be my last comment on the NAM for the December 26-27 storm. The numbers speak for themselves. Link to comment Share on other sites More sharing options...
eduggs Posted December 29, 2025 Share Posted December 29, 2025 This event was 1" - 5" across the NYC metro - NOT 4" - 8".. See the circled area in the map of interpolated NWS snowfall reports below. The NWS OKX forecast area, which encompasses a large region NORTH and EAST of NYC, does not equate to the NYC metro. Don, your tables and stats are not representative or convincing, which disappoints me. A visual representation is helpful here. Even if you limit your analysis to a single 18z NAM run, it was the only model to correctly capture the sharp gradient through NYC. Link to comment Share on other sites More sharing options...
BxEngine Posted December 29, 2025 Share Posted December 29, 2025 Well we have certainly beaten this to death… 1 Link to comment Share on other sites More sharing options...

Recommended Posts
Create an account or sign in to comment
You need to be a member in order to leave a comment
Create an account
Sign up for a new account in our community. It's easy!
Register a new accountSign in
Already have an account? Sign in here.
Sign In Now