bristolri_wx
-
Posts
2,125 -
Joined
-
Last visited
Content Type
Profiles
Blogs
Forums
American Weather
Media Demo
Store
Gallery
Everything posted by bristolri_wx
-
"Don’t do it" 2026 Blizzard obs, updates and pictures.
bristolri_wx replied to Ginx snewx's topic in New England
I've been converting the radar loops from GIF to MP4 files using Handbrake. It's free. You set the GIF file as the "Source" and then I use the preset "Social 25 MB 5 Minutes 360p60". Seems to take the largest GIF's and get them below my rather low attachment limit size. You can play around with the presets to see which one works best for what you want to post. GIF's are very inefficient for showing motion graphics, they just happen to be an open standard that's been around forever, so if you don't have a file size to worry about they work, especially since it's easy to take one still image and make it a frame in a GIF. -
It's nice to not be in the snow hole for some of these bigger storms.
-
"Don’t do it" 2026 Blizzard obs, updates and pictures.
bristolri_wx replied to Ginx snewx's topic in New England
Haven’t left my street yet. No downed trees in my immediate neighborhood. -
31" Bristol, RI
-
"Don’t do it" 2026 Blizzard obs, updates and pictures.
bristolri_wx replied to Ginx snewx's topic in New England
Updated Public Information Statement with Snowfall Totals and Wind Gusts is up: https://forecast.weather.gov/product.php?site=box&issuedby=BOX&product=pns Heh - gusted to 65 MPH here as well in the AM. Looks like my 30 burger holds up to the spotters in my area. Amazing. -
"Don’t do it" 2026 Blizzard obs, updates and pictures.
bristolri_wx replied to Ginx snewx's topic in New England
To paraphrase Jim Morrison - just broke on through to the other side. Going with 31”. Hard to gauge but measured a few spots and subtracted some pack.
-
"Don’t do it" 2026 Blizzard obs, updates and pictures.
bristolri_wx replied to Ginx snewx's topic in New England
-
"Don’t do it" 2026 Blizzard obs, updates and pictures.
bristolri_wx replied to Ginx snewx's topic in New England
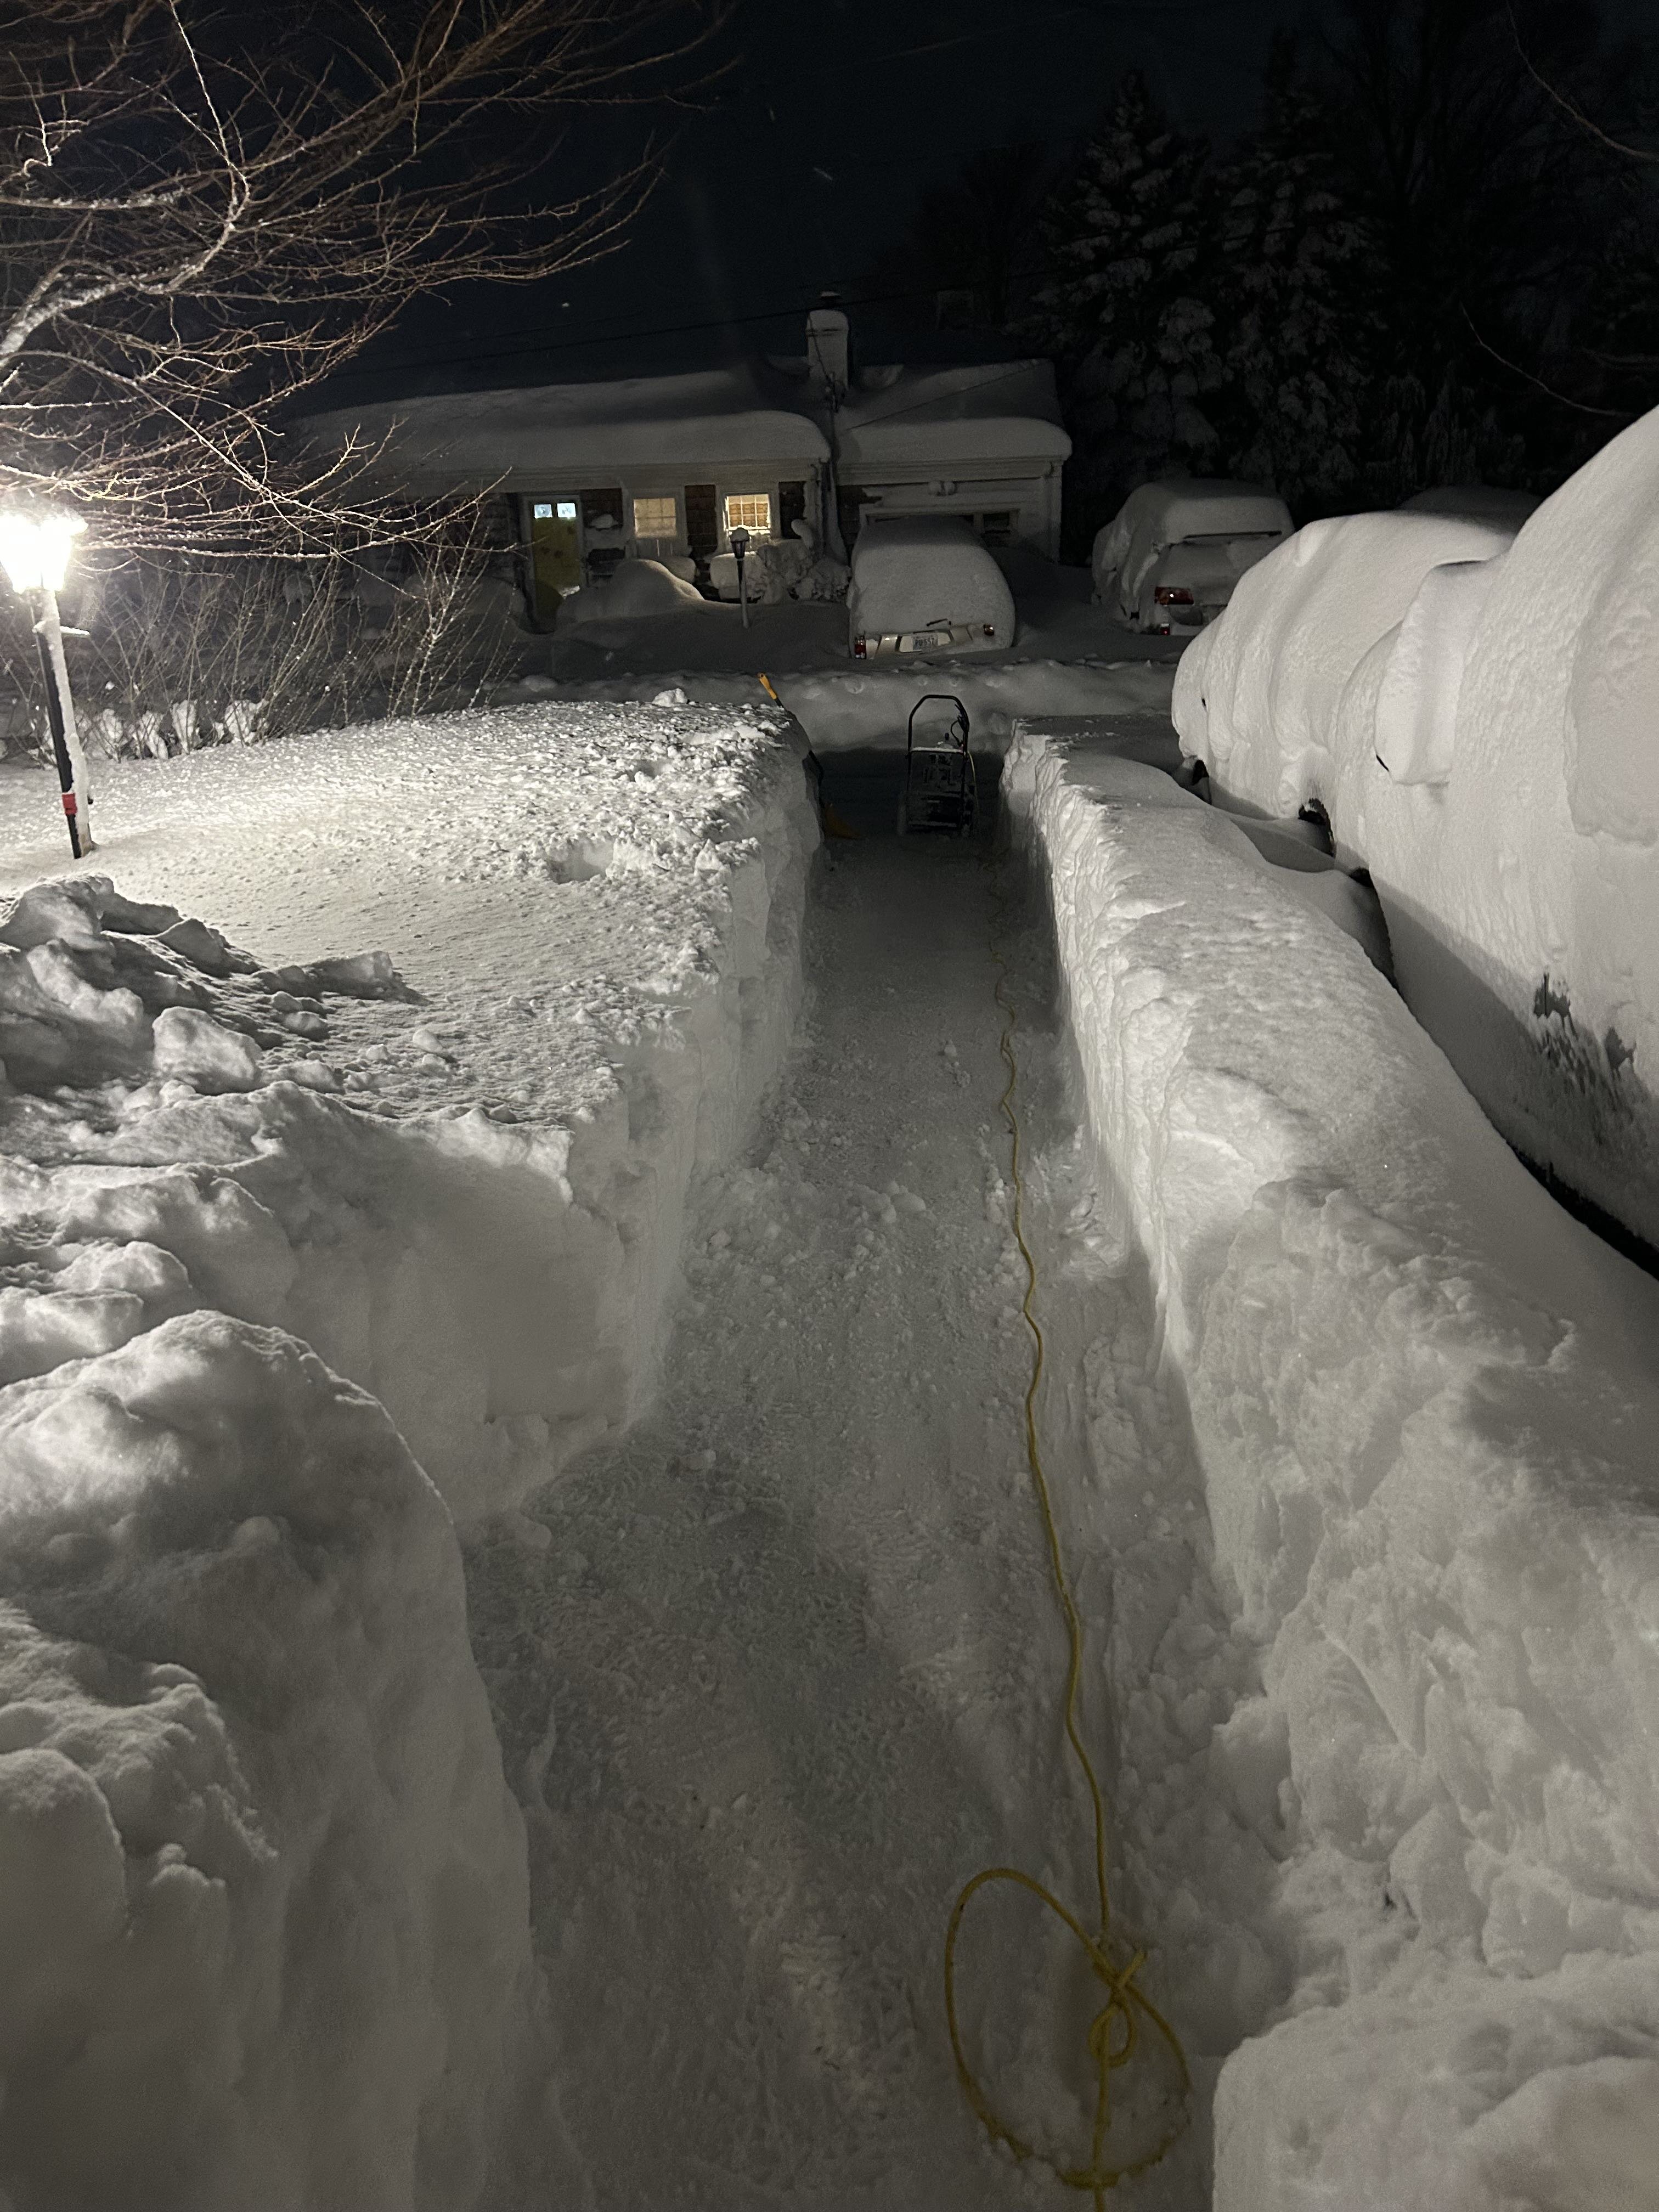
Cleanup commencing. Above my waste.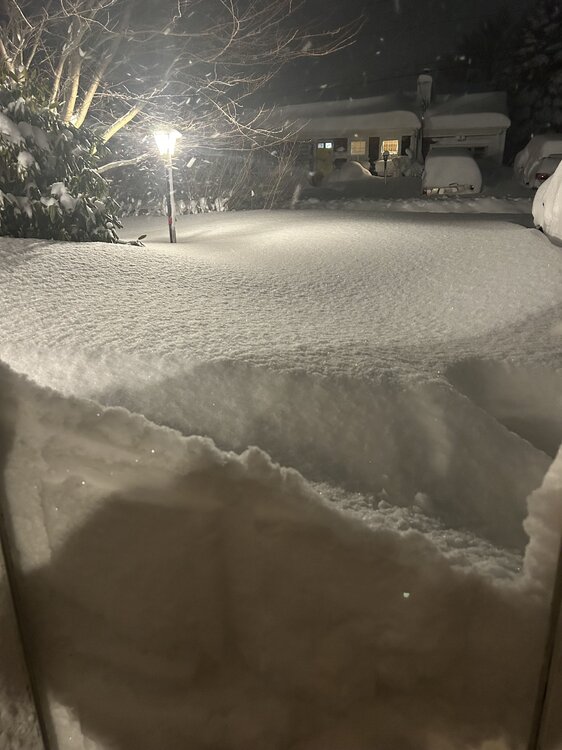
-
"Don’t do it" 2026 Blizzard obs, updates and pictures.
bristolri_wx replied to Ginx snewx's topic in New England
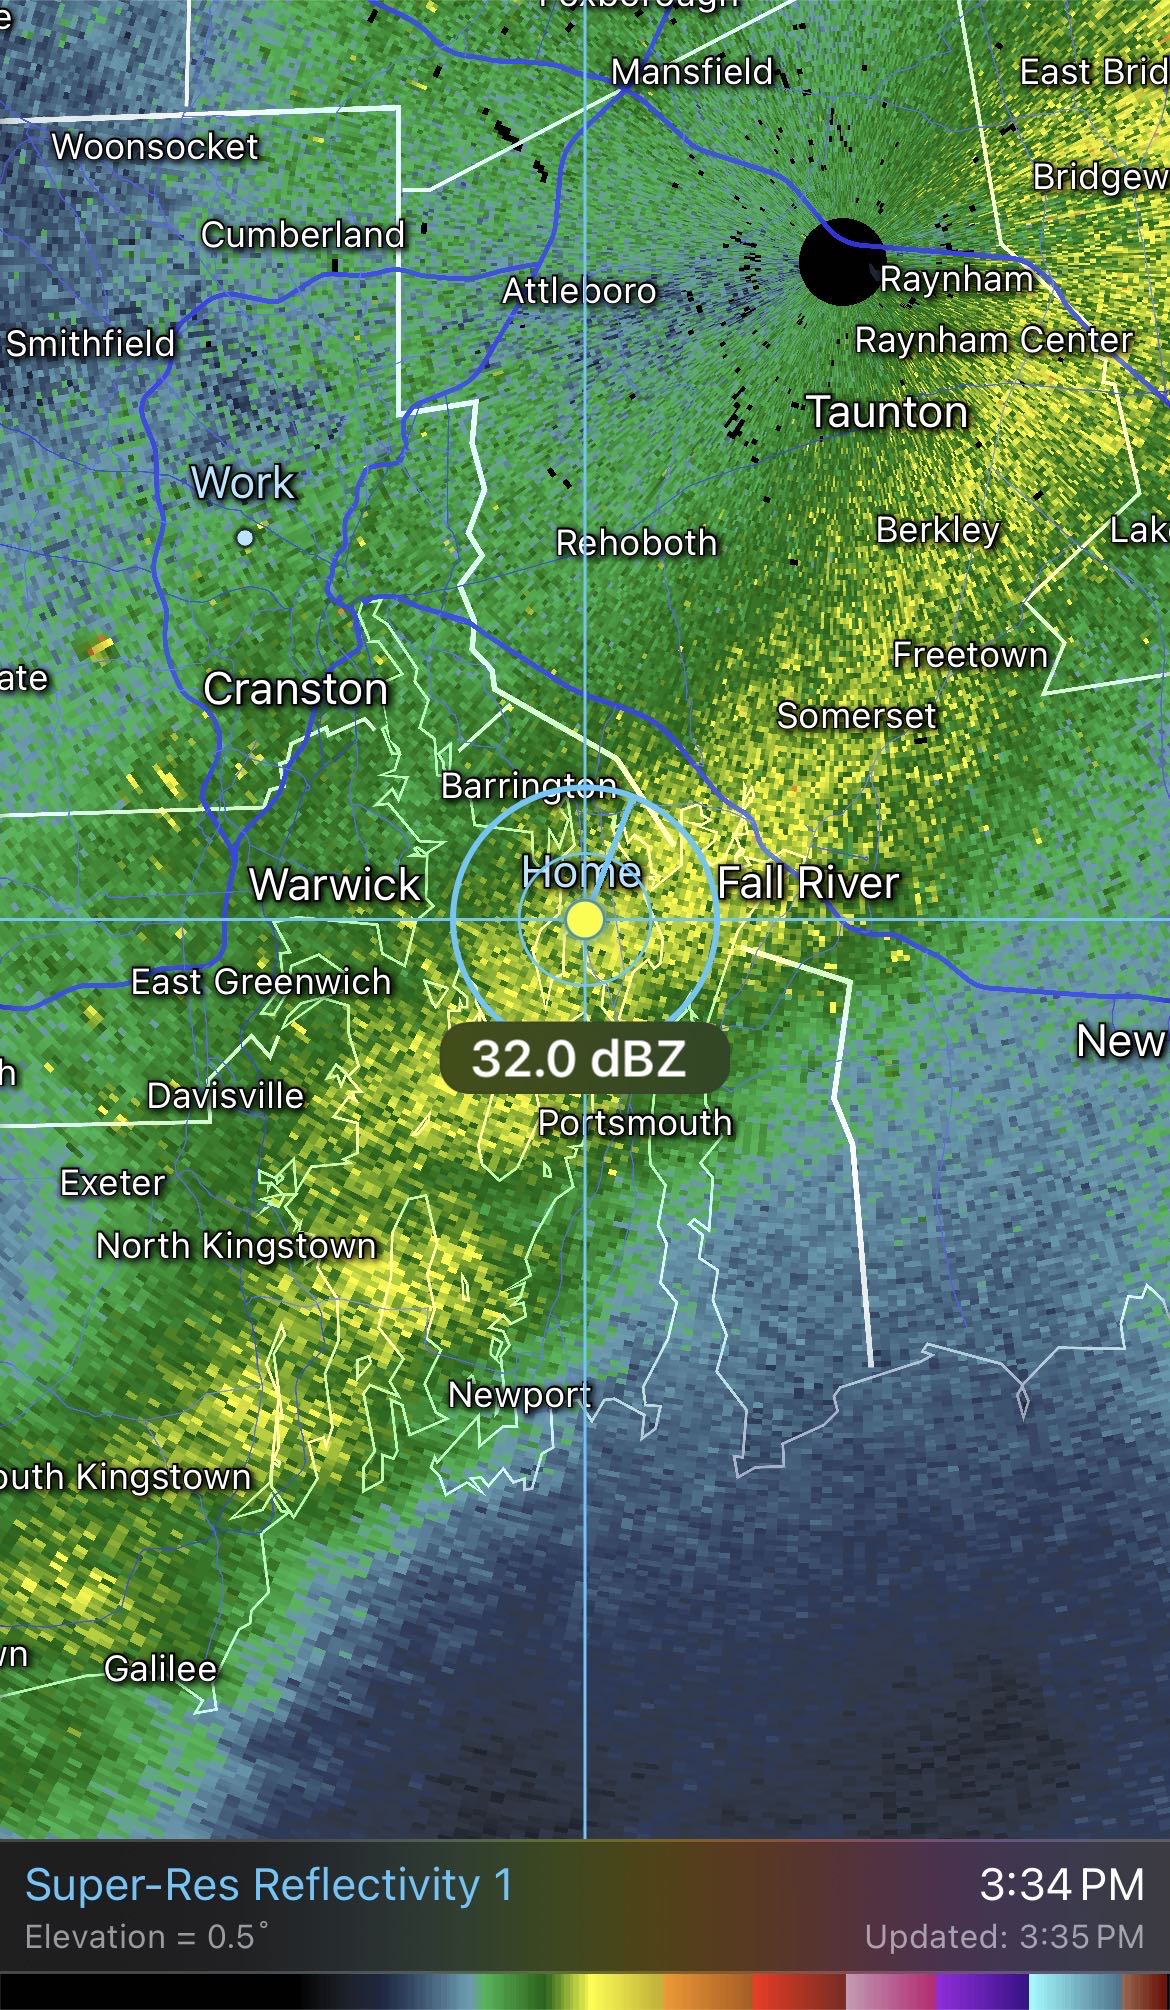
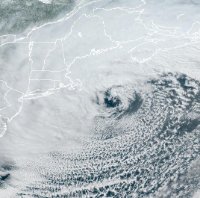
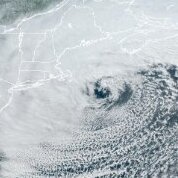
Another 30-35 dbz band incoming here... insanity... -
"Don’t do it" 2026 Blizzard obs, updates and pictures.
bristolri_wx replied to Ginx snewx's topic in New England
I'll be honest, I'm only judging based on whats close to the house. Sometimes that's denser because it melts a little from the heat leaking out and making it settle. I'm actually hopeful it's more powdery so I can try and cut through it with my very undersized snow thrower if I chop it down appropriately. -
"Don’t do it" 2026 Blizzard obs, updates and pictures.
bristolri_wx replied to Ginx snewx's topic in New England
RI State of Emergency extended for another 24 hours (at least). -
"Don’t do it" 2026 Blizzard obs, updates and pictures.
bristolri_wx replied to Ginx snewx's topic in New England
Could build an addition out of this stuff, eskimo style. -
"Don’t do it" 2026 Blizzard obs, updates and pictures.
bristolri_wx replied to Ginx snewx's topic in New England
Yes pretty sure my shitty "Snow Joe" electric snow thrower is not going to handle this well, lol. -
"Don’t do it" 2026 Blizzard obs, updates and pictures.
bristolri_wx replied to Ginx snewx's topic in New England
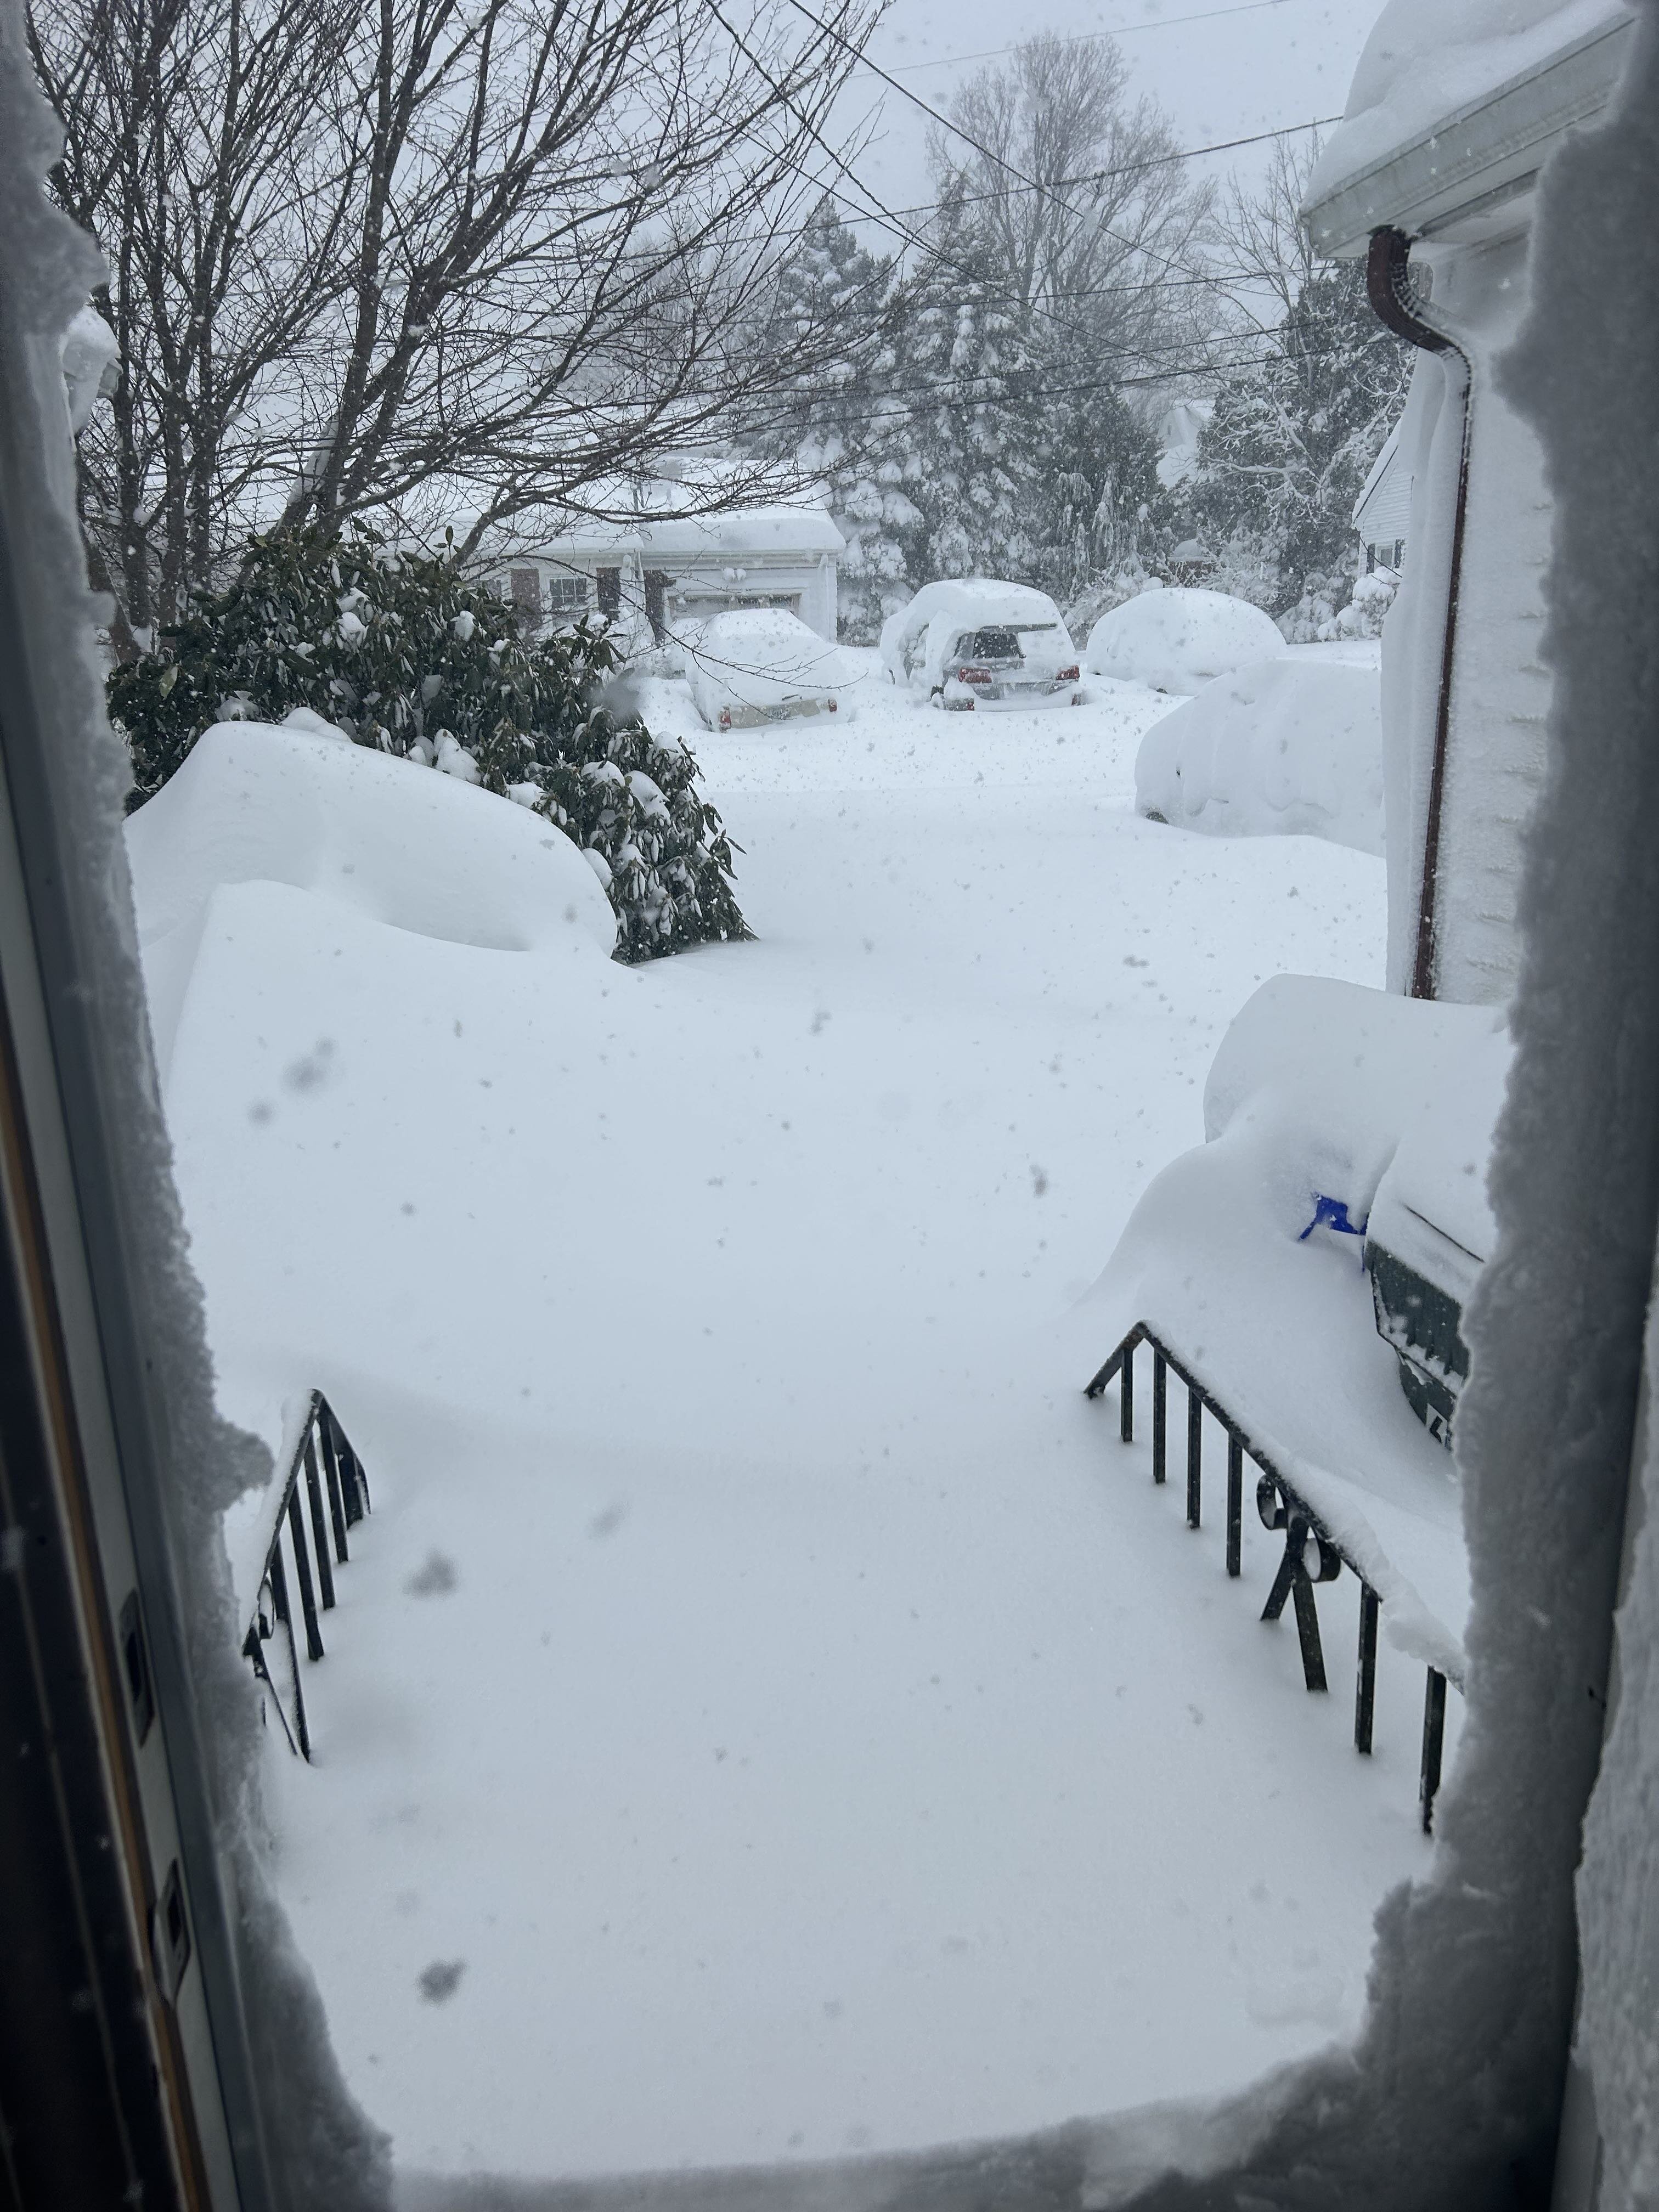
Just does not want to end here… jeez…
-
"Don’t do it" 2026 Blizzard obs, updates and pictures.
bristolri_wx replied to Ginx snewx's topic in New England
It’s dense and sticky. Not sure what I’m going to do to tackle this. That’s snow stuck to the frame of the door when I opened it. -
"Don’t do it" 2026 Blizzard obs, updates and pictures.
bristolri_wx replied to Ginx snewx's topic in New England
Yes and it made it that much more of a big deal to end up with so much. Some locations started with light rain or drizzle, if I remember the lore correctly. -
"Don’t do it" 2026 Blizzard obs, updates and pictures.
bristolri_wx replied to Ginx snewx's topic in New England
That sucks. -
"Don’t do it" 2026 Blizzard obs, updates and pictures.
bristolri_wx replied to Ginx snewx's topic in New England
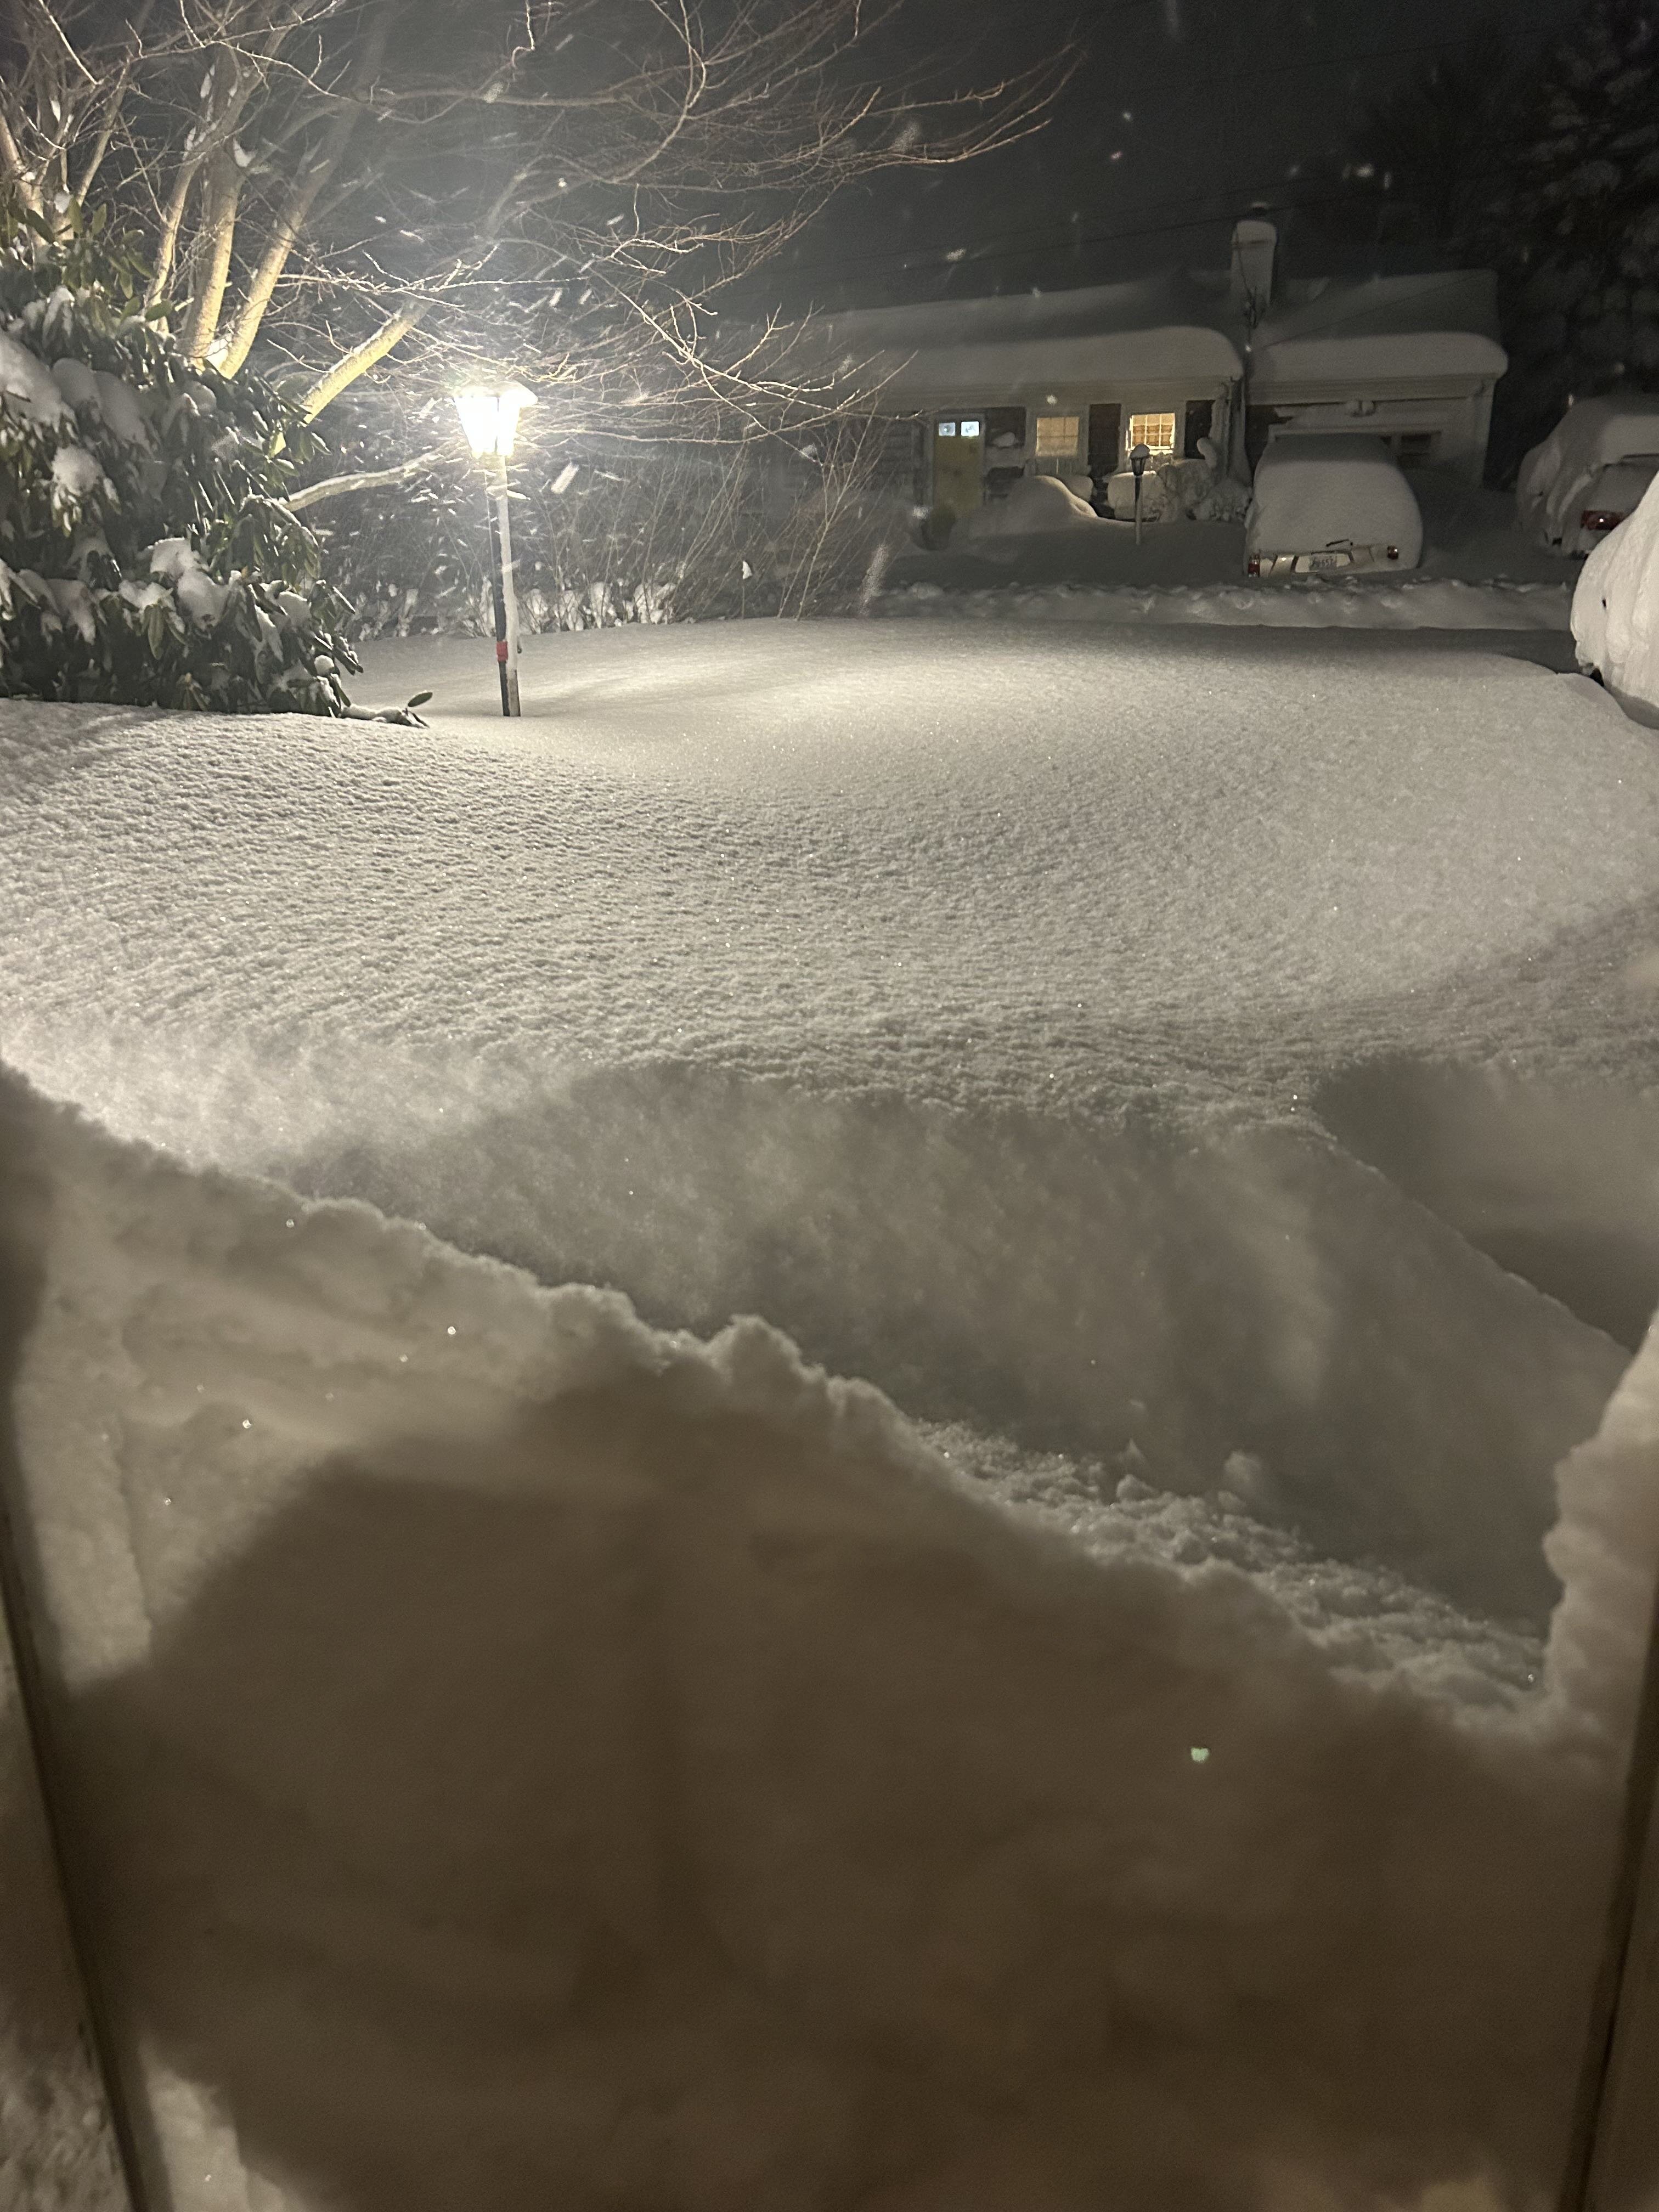
Just opened the door to peak for the first time…
-
"Don’t do it" 2026 Blizzard obs, updates and pictures.
bristolri_wx replied to Ginx snewx's topic in New England
We may not see another blizzard of 78 in our lifetime. It's like the hurricane of 1938 of winter storms. The way that low tucked in and then closed off and stalled - yet all the other pieces fell into place in 1978 seems to have not come close to have been replicated since then. Today if we see a low that close to us on the models, we're thinking where is the mixing line going to setup! -
"Don’t do it" 2026 Blizzard obs, updates and pictures.
bristolri_wx replied to Ginx snewx's topic in New England
Not at all. That didn't even enter my mind. I'm thinking government waste and corruption, bridges falling down in disrepair, high taxes and cost of living. But if that's what entered your mind first, that's something for you to address, not me. -
"Don’t do it" 2026 Blizzard obs, updates and pictures.
bristolri_wx replied to Ginx snewx's topic in New England
It's okay to be disappointed, and put it down in words here. It's the tone that matters. I feel bad that the storm was not as prolific for others as it could have been. That being said, there's always winners and losers in these big storms. It's rare that everyone wins because what produces the snow on the north west side of these storms is banding, and it's almost impossible to have bands that cover our entire region to make everyone a winner. It truly is like going to the casino - only a few are going to jackpot. Usually for my area to win, somewhere else has just cashed in their last snow chip without a good return. At the end of the day, it's just weather, and we aren't in control of it. It's nice we see all four seasons in New England. I can't imagine, even when I get a 20" winter, living somewhere where you don't get the variety of weather you get here. -
"Don’t do it" 2026 Blizzard obs, updates and pictures.
bristolri_wx replied to Ginx snewx's topic in New England
Clearly you have angered the snow gods with your accordion playing debauchery and they have blown your snow to the far ends of Manville and Albion. You must sacrifice a virgin Victoria and repent to please the gods and fill in your snow hole. -
"Don’t do it" 2026 Blizzard obs, updates and pictures.
bristolri_wx replied to Ginx snewx's topic in New England
This may make it number 1 all time. I believe 1978 was around 27. -
"Don’t do it" 2026 Blizzard obs, updates and pictures.
bristolri_wx replied to Ginx snewx's topic in New England
If you don't end up at around 24" then it's only because you don't have a good spot to measure. Your location wasn't in the middle of the death band but you have several consecutive hours of 30 dbz stuff on radar, and some parts of the heavy band made it your way. I've got two personal reports of around 2 feet in Cumberland area from friends. Plus we have the reports from Attelboro, and I have a friend in Smithfield reporting two feet to the west of you. There was no prolific snow hole over your house. Even if we knock a few inches off due to drifting, there's a good chance that this number verifies. It's seriously time to relax now and enjoy what you got. We already have enough things giving RI a bad name, and your whining on this thread is insufferable. You don't know how many times I've had friends in the northern and western parts of the state with significantly more snow than my own backyard. There's 50,000 people with no power in the state, that may not get it back for a couple of days, and you're complaining you didn't get 40" on top of your fake fucking mountain. Seriously, get a hold of yourself, and at least melt with some world championship worthy dignity. -
"Don’t do it" 2026 Blizzard obs, updates and pictures.
bristolri_wx replied to Ginx snewx's topic in New England
This guy has a message for you....jpeg.c76f8c837a48dc7028723c2643bcabde.jpeg)