Typhoon Tip
-
Posts
44,568 -
Joined
-
Last visited
Content Type
Profiles
Blogs
Forums
American Weather
Media Demo
Store
Gallery
Everything posted by Typhoon Tip
-
2026-2027 Super El Nino
Typhoon Tip replied to Stormchaserchuck1's topic in Weather Forecasting and Discussion
Mmm I'm not sure those can be parsed out like that... "Actually the cold blob AGW based is just south of Greenland, which is a +NAO tendency. I'm pointing out a cold pool south of New Foundland. Here is the correlation composite " I would still proceed with interpretive caution. Look at it this way ... if the cold blob,due to AMOC flux variance is making that NF region "prone" to a colder expression, then a comparative failure in the index correlation is happening...because the former would mean that less forcing is causing the expression to take place. In short ... misleading a circulation mode that isn't so. That kind of shit is making the CC attribution seriously f with these mass field aspect. man As far as the cold blob itself ... -NAO and +NAO are taking place more independent because the atmospheric indexes are being driven by a set of forcing, vs the AMOC --> cold blob emerging because of changes in the AMOC. Again...use with caution. -
Inclined to agree with skepticism there. We have been dealing with this since last October... a basal trough that at times we see ridging, but we return to this footprint since prior to the ENSO switch onset. Most importantly, warm(cool) ENSO onset in summer isn't triggering much in the hemisphere. The hemispheric/seasonal cooling from N latitudes establishes improving gradient in autumn -that is when that forcing commences. To early.
-
2026-2027 Super El Nino
Typhoon Tip replied to Stormchaserchuck1's topic in Weather Forecasting and Discussion
I'm suspecting that we're heading for a troughy/humid end game myself. If so ... that would lower the "big heat" transport circumstances, blocked by ongoing synoptic balancing. Doesn't mean it can't happen... talking 'tendency' here ( sorry, not you per se but the common reader tends to formulate extremes in their interpretation .. failing idiosyncratic nuance and/or 'lean' ) We'll see... but there's a leitmotif in the major ensemble sources to pin a trough here regardless of the Pacific. Ex, over the next 7 days the eastern Pac passes through an impressive -PNA for mid summer... but we don't see heights rising much E of Chicago. Proooobably this is owing to the shortened wave lengths of summer in general - how that gets away with that. But here's the rub... that positive anomaly over the N-NE Pac decays, and the pattern moves ends up with trough anyway. So we're fucked either way, is what the modeling argues. Okay - Altho some folks have a more toxic relationship with heat expectations so for them, this is probably the opposite of fucked intimation haha -
2026-2027 Super El Nino
Typhoon Tip replied to Stormchaserchuck1's topic in Weather Forecasting and Discussion
It's placement geographically is beside the point. The mechanism for it's persistence/necessity in the science of CC attribution et al, or for whatever reason, gets in the way of the NAO/tripole assumption. That is the point. Thus, relying on it as a predictor for atmospheric behavior tendencies/correlations therein, are riskier - because those are driven by disparate total physical processes. The NAO/tripole physics are different than the AMOC for it being a ( possible ) geologic permanent change. I'm not saying the AMOC is collapsing, per se. Maybe it is. Maybe it isn't. However, just advising that it is being scienced as occurring for that reason. So We'll see... But, if so ...the cold blob reflects the AMOC changes... not an NAO forcing (necessarily). Put even simpler... cold blog exists, NAO is biased positive. Tough cookies. The other aspect, the longer term correlation between the Pacific and NAO is transmitted through the N/A via the PNA. It's positive. Which means, when the PNA is positive, the NAO tends to be positive, and vice versa. So ...I'm not sure how a positive ENSO/+PNA correlation favors that -NAO ... it doesn't based on that. But that may not be the whole story - there may be something specific to El Nino that gets that anti-correlation to realize more frequently, during the El Nino winter? These kinds of exceptions exist in principle... worth looking for that. I kind of doubt it though. In the meantime, it makes intuitive sense that a +PNA jives with a +NAO and vice versa, because of winter planetary wave lengths and the speed of the basal flow. It would be hard to maintain a western N/A highly curvaceous flow and then expect the flow to bend back around into block over the D. Straight region, when flow is necessarily screwing along at ludicrous speeds due to the hemispheric gradient during DJF. Fast flow does not like curved surfaces... that's just physics. Curving the flow increases centrifugal -acceleration; and so as the flow speeds up that force is trying to cancel the curvature and flatten out. Ex, in April the flow tends to close off vortices; there is deceleration in the as the geopotential gradient is collapsing. The flow folds in on itself with the loss of basal velocity. That's probably why a latter March thru early May -NAO boat ride isn't that uncommon. Because the flow collapses and the excessive wave transport gets stranded and loads that region. -
Low LCL ropers
-
https://phys.org/news/2026-07-arctic-winter-sea-ice-significant.html
-
can you loop that ..? if you ever want an analysis/proof of authenticity, that would be more useful than a still frame
-
Yeah, 10" of rain 30 minute run-off time to Long Island shore ... pretty bad
-
2026-2027 Super El Nino
Typhoon Tip replied to Stormchaserchuck1's topic in Weather Forecasting and Discussion
I'd be careful with the bold ... The straight up linear correlation, sure - that's ...sort of similar to the tripole SST state, which is highly correlated to -NAOs..etc..etc..but, the causality of why that colder region is notable there is circumstantially - quite possibly - evolved for different reason.. Mimicry, in other words. There's is ongoing research about a recent decadal persistent "Atlantic cold blob" that is being geophysically connected to a longer term changes/flux of the AMOC ... Of course, CC and attribution science is all over that. Some bigger media, definitely social media doomers, are pumping out warnings how that portends the end of the G-string circulation eddy et al ... reaming on people's chode hair that the new paradigm will mean a black and white noir this that and the other Michael Bay plot line surreality ... yadda yadda. Who knows, but the point is, if there are kernels of truth to that whole science and/or science-narrative, on-going, then it's being caused for other reasons. -
nah... sat and rad trends expose a massive cosmic dildo pounding the bum of convective hopefuls
-
Bad Gateway -related delay/ping failure has returned. Check for another wave of foreign shitheads Also, probably could have been a part of the enhanced severe stuff today if it were not this piece of shit useless timed nocturnal garbage waste ... just exquisitely timed to make sure nothing happens but light mosquito rain
-
It’ll likely get switched back at some point after the balance of power flips aisles. Unless there is a coup de etat and the last of the constitution is finally cindered … otherwise most historically reliable social dynamic metrics are heavily leaning toward a pendulum swing. It’s not a big intuitive leap that when that happens, there will be sweeping referendums on a lot of the decisions that have been made in recency.
-
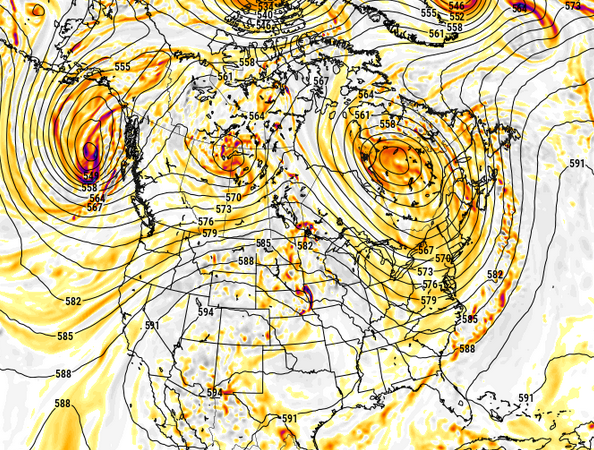
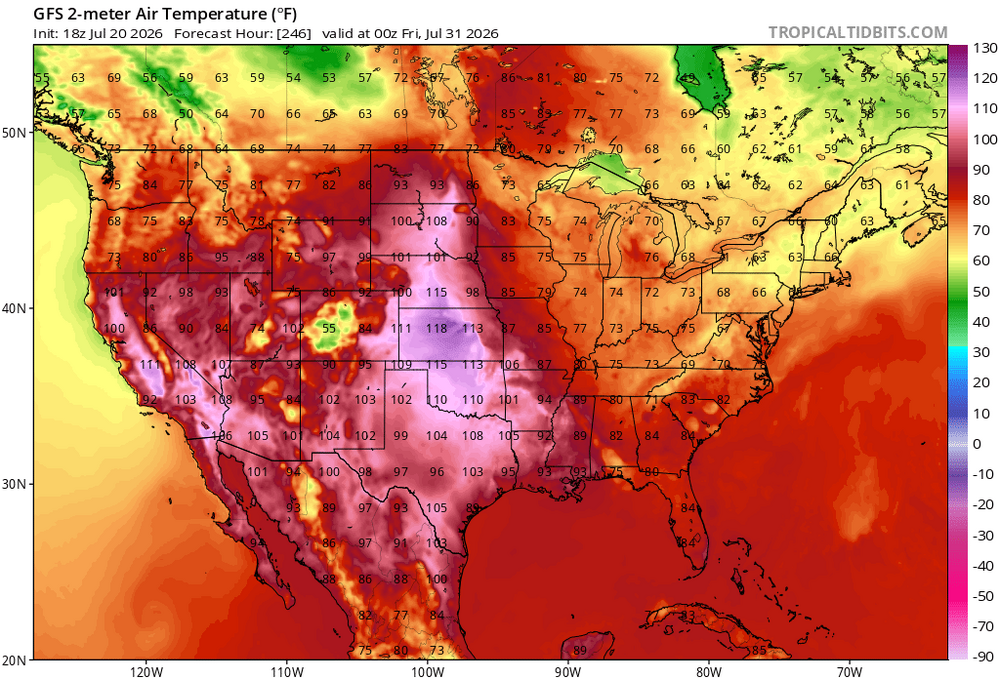
This is kind of interesting A heat wave in the Plains is obviously not that unusual at this time of year… this thing being repeatedly modeled by the GFS operational run is pernicious tho. I think this is the max day and an unrealistic high approaching 120° near Kansas. It’s also packed back west quite a bit throughout the great basin in California in the Sonoran Desert region. We’ll have to watch that cause the PNA is forecast to take a dip near the 25th… an Iindex state which I have not seen the operational models really take any steps towards acknowledging yet? That could turn out to be one hell of a release event if/when the mass fields were to seesaw into a -PNAP. There could be a little bit of non-linear forcing in here that the operation runs are doing a good job at suppressing perhaps at their own peril
-
So what does ACATT mean to this social media depot ?
-
Today could rival some of the bigger diurnal recoveries since winter ended. Which is rare by the time we get to even June, let alone latter July... But it was 48 to 52 at a lot of these in-between lower el NWS sites on their interactive page, yet many of these sites are already up 25 F over those lows. No cloud/not enough to appreciably offset heating and still solar max lasing by a relentless sun... should be able to put up some 35+ deltas.
-
Heh... that's probably PR. Being where it is, i.e. not being able to escape that region without hitting land, they can't afford to take chance. Sometimes these things'll fester for 4 days, while models keep prematurely spinning them up. Attention wanes... yeah yeah. Then, all at once on that 5th day, people 'had no idea' it was happening or was going to happen, but the inhibition that was poorly assessed all along, suddenly goes away, and it then m'fugger goes nuts. The PR in a situation like that is strategic. Keep 'em apprised with the headline (watch). What they can't do is be responsible for any statement that will invariably be interpreted by the Idiocracy as 'okay we don't have to worry' charter boats and tourism and no worries. For one, the Idiocracy wants to interpret that way ... To mention also, we live in a litigation-happy society that seems to excuse if not reward people for being Idiots. But I'm digressing Meanwhile, if nothing comes of it... Watch is no harm no foul.
-
It almost looks like a TUTT with a sputtering TD underneath. TUTTs are not providing an anticyclonic geometric outflow when they are over top - opposite in fact. What's interesting about that is that TUTT's are often a part of TC evolution. But, they are near-by ... not directly overhead. The near-by model: The mechanism/relationship there is that their circulation proximity pulls an outflow channel which improves the mass-restoring inflow potential and the TCs gets a boost. It's like a pulsar and star and the pulsar siphoning material off the star, and it flows into an accretion disk. But in this case the TUTT is over top. No channel. I'm not sure that's what is happening here but the general CB exhaust motion doesn't inspire anticyclonic U/A has been established very well, and in fact, the deeper object motion is slowly cyclonic about a broader defined axis with that small surface feature ESE of LA. Also some NEly shear too
-
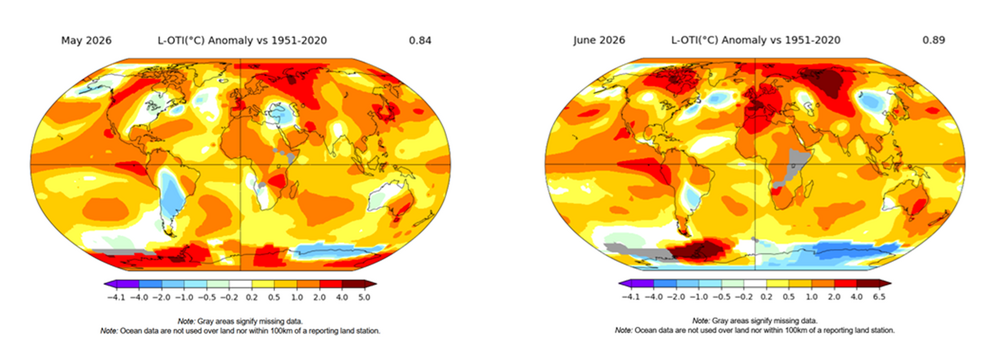
Nice condensed way to put that ... ...I've also been impressing upon this phenomenon myself since last October... 7 or so of the last 9 months have have been cooler relative to the planetary seemingly fixed hot spots, yet still warmer than normal relative to our own climate means. Relativity is baking people's perception, perhaps. We base our impressions on a combination of sensible experiences over the time... mixed up with "group theory"- haha. But, here's an example of May and June per NASA's GIS tool - granularity and so forth, notwithstanding. Clearly there is a preferential/bias to result cooler over eastern mid latitude N America, than it has ( again ... relative to climate) N-S-E-W and abroad. But combining sensible experience with headlines that rarely include our region when it comes to warmth ... it's a bit obfuscating/false impression making - maybe. Anyway, we're above normal, just not as much. There are a few other cooler nodes as one can clearly see ... I haven't been paying as close attention to those in all honesty - preoccupied by how warm enthusiasts are being tormented locally ( haha). I wouldn't be shocked however if these are "geological resonant feedback" regions. In other words, wholesale planetary factorization 'sort of' fixing those cool vs warm regions. Some of that's got to be true. I mean, the perennial N/A pattern ( PNAP ) has a flat ridge west, nadir-ing flow east, as the westerlies impinge on the western N/A cordillera ... forced up and over, and then Coriolis bends the flow into NVA... etc.. But, that does probably contribute to why our "heat domes" are too transient to be part of the cool kids. Something like that could be normal elsewhere.
-
yeah it's looked like that for awhile. The numerical teleconnectors suggest -PNA/+EPO with eastern limb -NAO from 24th + ... if folks want to get into the 2nd of the 3 typical heat periods summers ever give us around here, that looks to be a good time for #2 - albeit late. 3rd'll have to be later August but by then ...we're past solar max so we get cheated in New England as usual. LOL but anything to continue being colder relative to everywhere else while still registering warmer than normal, a leitmotif that's had one or two exceptions by has been predominating our monthly results since last summer really when I began keeping track of the sneaking butt boning
-
Saturday, July 18, 2026 Thunderstorm/Severe Weather Potential
Typhoon Tip replied to weatherwiz's topic in New England
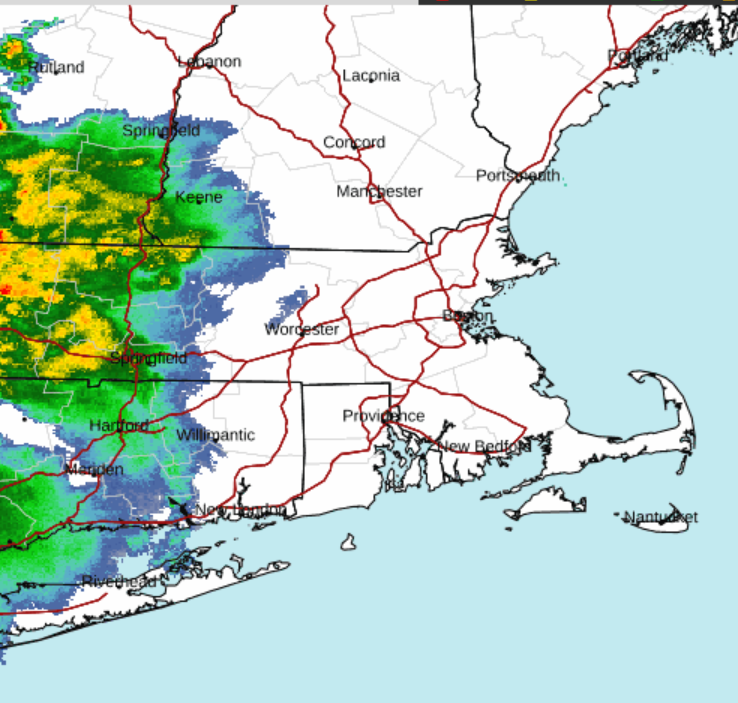
700 mil bar winds being west Northwest, north of the warm front is the problem It kept it pinned down there in southern PA, despite having southwest wind at the surface on either side of the boundary. It gets sawed off aloft. All we get is residual elevated convective blips amid strata rains. Cool and humid. that phenomenon of the winds bending back southeast north of the warm front preventing it from coming in as something I’ve seen in this part of the country quite frequently actually over the decades I’ve lived here. Meanwhile, warm front looks in the pgf like it’s in a laminar flow/no resistance, but they just don’t move because of it. -
84/47 ... lot of mid 40s dps. Our source tomorrow is behind a warm boundary smearing through circa 10am to 2 ... after which we sector wedge 88/72's like lower Michigan - maybe. Getting from here to there seems like a warm over instability op tonight.
-
Pretty clearly a circulation formulating west of Sarasota
-
Heh... looks pretty clear via the higher res vis images I looped that the convection down there fired off in the region below the axis of denser smoke. In fact, probably the training ran along the temperature gradient between N NJ where it was denser, vs where more sun/sfc heating was realized.
-
you're dreamin' That's an autumn shut-it-downer pattern big time
-
If the pattern keeps doing this ... ? fire up the May/2027 thread