GaWx
-
Posts
19,031 -
Joined
Content Type
Profiles
Blogs
Forums
American Weather
Media Demo
Store
Gallery
Everything posted by GaWx
-
1. AAM is now dropping back from neutral and is forecasted to be in a solid -AAM (solid Ninaish) through the next 30 days per this CFS ens run: 2. WCS daily PDO has risen steeply the last 6 days and is up to -0.83, the highest daily since May:
-
This shows that the Euro is now leaning toward that later period for the actual reversal (~11/28 instead of 11/25). Add in a several week lag and a potential of a phase 8 MJO followed hopefully by 1-2 and we’d have a realistic chance for a several week long period of cold domination in the E US starting as early as near mid-Dec. Prior to this potential, there’d also likely be a mild dominated next 30 days, which shouldn’t be ignored.
-
Followup: here’s the average temp. anomaly of all Decs, Jans, and Febs for -ENSO winters since 1983-4 with a -PNA in Dec: Dec (all had -PNA with avg. -0.99): slightly warmer than normal E US (most pronounced SE) and very cold N Plains/Rockies: Jan (all had +PNA with avg. +0.76): slightly colder than Dec Chicago S and E but N Plains/Rockies not as cold: Feb (all 11 PNAs dropped back down with Feb avg. PNA of -0.19): other than GA-TX, this is easily the warmest of 3 months averaged out in the E 2/3 of US with warmest SC to NE:
-
Today’s 2 week GEFS and EPS showed slight improvement vs yesterday regarding progression when comparing the same days into phase 7: 1. GEFS: Yesterday’s GEFS: Today’s GEFS: 2. EPS: Yesterday’s EPS: Today’s EPS:
-
I just looked up -ENSO winters with a -PNA in Dec to see how often it went to a +PNA in Jan. In what winters did this occur? -1954-5: -0.52 to +0.40 -1962-3: -0.08 to +0.58 -1983-4: -0.31 to +0.97 -1984-5: -1.60 to +1.63 -1996-7: -1.23 to +0.63 -1998-9: -0.09 to +0.16 -2008-9: -1.41 to +0.61 -2010-11: -1.78 to +1.29 -2012-3: -1.01 to +0.55 -2013-4: -0.86 to +0.97 -2016-7: -0.35 to +0.28 -2021-2: -2.56 to +1.01 -2022-3: -0.66 to +0.22 So, although it wasn’t common from 1954-5 through 1971-2, when only 2 of 9 (22%) switched, here’s something that just blew my mind: -ALL 11 -ENSO -PNA Decs since 1983-4 switched to +PNA Jans (listed above)! -These 11 averaged +0.76 in January! -Now, check out the -ENSO Jan PNAs since 1983-4 that had a +PNA in Dec: 1) 1985-6 went from +1.39 to +0.97 2) 1988-9 went from +0.63 to -0.72 3) 1995-6 went from +0.92 to -0.02 4) 1999-00 went from +0.21 to -0.82 5) 2000-01 went from +1.23 to +1.51 6) 2001-2 went from +0.56 to -0.04 7) 2005-6 went from +1.38 to -0.43 8) 2007-8 went from +0.14 to -0.32 9) 2011-2 went from +0.36 to +0.60 10) 2017-8 went from +0.89 to +0.40 11) 2020-1 went from +1.58 to +0.19 12) 2024-5 went from +1.70 to +1.05 -So, for these 12 -ENSO Decs since 1983-4 with a +PNA, only 50% also had a +PNA in Jan. -So, since 1983-4, whereas only 50% of the 12 -ENSO Decs with a +PNA also had a Jan +PNA, 100% of the 11 -ENSO Decs with a -PNA in Dec went to a +PNA in Jan! Thus, having a -PNA in Dec during -ENSO since 1983-4 has, if anything, meant a big increase in the chance for a +PNA in Jan whether random or not! I didn’t know this til just now. Link to monthly PNAs back to 1950: https://www.cpc.ncep.noaa.gov/products/precip/CWlink/pna/norm.pna.monthly.b5001.current.ascii.table @donsutherland1
-
I just looked up -ENSO winters with a -PNA in Dec to see how often it went to a +PNA in Jan. In what winters did this occur? -1954-5: -0.52 to +0.40 -1962-3: -0.08 to +0.58 -1983-4: -0.31 to +0.97 -1984-5: -1.60 to +1.63 -1996-7: -1.23 to +0.63 -1998-9: -0.09 to +0.16 -2008-9: -1.41 to +0.61 -2010-11: -1.78 to +1.29 -2012-3: -1.01 to +0.55 -2013-4: -0.86 to +0.97 -2016-7: -0.35 to +0.28 -2021-2: -2.56 to +1.01 -2022-3: -0.66 to +0.22 So, although it wasn’t common from 1954-5 through 1971-2, when only 2 of 9 (22%) switched, here’s something that just blew my mind: -ALL 11 -ENSO -PNA Decs since 1983-4 switched to +PNA Jans (listed above)! -These 11 averaged +0.76 in January! -Now, check out the -ENSO Jan PNAs since 1983-4 that had a +PNA in Dec: 1) 1985-6 went from +1.39 to +0.97 2) 1988-9 went from +0.63 to -0.72 3) 1995-6 went from +0.92 to -0.02 4) 1999-00 went from +0.21 to -0.82 5) 2000-01 went from +1.23 to +1.51 6) 2001-2 went from +0.56 to -0.04 7) 2005-6 went from +1.38 to -0.43 8) 2007-8 went from +0.14 to -0.32 9) 2011-2 went from +0.36 to +0.60 10) 2017-8 went from +0.89 to +0.40 11) 2020-1 went from +1.58 to +0.19 12) 2024-5 went from +1.70 to +1.05 -So, for these 12 -ENSO Decs since 1983-4 with a +PNA, only 50% also had a +PNA in Jan. -So, since 1983-4, whereas only 50% of the 12 -ENSO Decs with a +PNA also had a Jan +PNA, 100% of the 11 -ENSO Decs with a -PNA in Dec went to a +PNA in Jan! Thus, having a -PNA in Dec during -ENSO since 1983-4 has, if anything, meant a big increase in the chance for a +PNA in Jan whether random or not! I didn’t know this til just now. Link to monthly PNAs back to 1950: https://www.cpc.ncep.noaa.gov/products/precip/CWlink/pna/norm.pna.monthly.b5001.current.ascii.table
-
The cold E US Dec phase 7 periods were mainly during weak to low end moderate amplitude phase 7s (including inside the circle, which your map includes). Instead, the extended GEFS and Euro are forecasting a strong phase 7, which rarely was cold. Using Baltimore as a midpoint for the E US, these were the coldest in phase 7: 1. -11: 12/16-20/2010 ph 7 near to just inside COD 2. -11: 12/17-19/2009 ph 7 just outside COD: 3. -7: 12/26-31/2001 ph 7 moderate: 4. -7: 12/9-19/1995: this ph 7 was strongest that was cold…but this is the only exception that was almost as strong as the ext-EPS but still not nearly as strong as the ext-GEFS 5. -6: 12/4-9/1977 ph 7 (the cold one is well inside the COD, not the one that comes out later which wasn’t cold): 6. -6: 12/5-8/1989 ph 7 just outside to right on COD: 7. -6: 12/15-25/1981 ph 7 just outside to just inside COD: 8. -5: 12/9-11/2017 this is the ph 7 going into the COD (not the one further out 12/17-20, which was mild): 9. -5: 12/11-14/2000 ph 7 moderate


-
I hope you’re right but the MJO actually reaching phase 8 is far from certain. Dec MJO in phase 8 has been difficult to come by for 15 years. The only notable (3+ days long) Dec phase 8 since 2009 was in 2017! 2023’s 8 zipped through in just one day. Some of this lack of Dec phase 8 was bad timing where they occurred late Nov or early Jan. But there were four times that phase 8 seemed to be blocked and instead it detoured and stayed back in 7 or went around to 1.
-
From our member @griteaterposted elsewhere: my take on him is that he isn’t a baseless hyping forecaster. Instead, he generally uses his intelligence and immense knowledge in an objective manner and thus is well worth following. Yes, he’s an optimist in the sense that his winter posts are mainly when the prospects for E US cold are good and is usually quiet(er) when prospects aren’t good. I think of him as the opposite of @snowman19. Both smart/knowledgeable and neither are baseless hypsters as they back up their posts well. One loves to predict cold and the other mild. Predicting the future is hard in any business or hobby, but I have higher than normal confidence that the Dec 15 to Jan 15 period is going to be active and fun in here. Get the load testing done early boys! My own feeling is that the combo of a weak SPV in late Nov/early Dec along with a weak to moderate MJO since that’s on average when it’s coldest (preferably slow moving <1.5 amp phase 8 followed by slow moving near or inside COD phases 1-2-3) combined with Nina climo would give a good chance at a cold dominated E US 12/15-1/15. A lot is up to the MJO, which has struggled to get into phase 8 at all in Dec since 2010. *Edit: After looking closely at actual cases of Dec phase 2, I need to amend what I said above about phase 2 with phase 3 still to be researched more closely when I get time. Phase 2 surprisingly tended to be colder outside the COD vs inside, which is unlike the others I’ve researched in detail so far, phases 6-8 and 1. So, a path through weak 6-1 followed by stronger 2 seems like it may give the best chance at a solid cold period though still with much variation.
-
Making the CFS even wackier is when it is a WxBell version: -For one thing their versions almost always have an odd cold spot over Lake Michigan along with a warm spot to the NNE near the E UP of Mich. -The wackiest maps are the control runs (C) as opposed to ensemble mean (M) runs Here’s another example: cold spot over L Mich. (to -6C, which would be close to coldest on record) while there’s a warm spot of +4C over NE UP of Mich!
-
Today’s Euro Weeklies: 1. SPV: though there’s still a decent % with a reversal on 11/25, there actually was a notable drop in the % of SSWs on 11/25 in exchange for an increase in the % for that to be ~11/27-8: @MJO812@BlizzardWx Yesterday’s: 2. Today’s E US 2m temps are similar to yesterday’s run for Dec with a strong SE ridge early (mild again in the SE to lower Mid-Atlantic) that again slowly weakens through mid-Dec: 12/1-7: 12/8-14: 12/15-21: (12/22-28 similar) But yesterday’s extended EPS/GEFS were forecasting the MJO on 12/11-14 to reach phase 8, which is about the coldest phase on avg in the E US in Dec. with 60%/80% of them having been cold in Baltimore/RDU, for examples. Also, should the SSWE actually occur, the lagged cold may also start ~mid-Dec. So, should it actually get to phase 8 and the SSW occur in late Nov, I’d be looking for a very good chance for 12/15-21 and 12/22-28 to turn much colder in the E US on later runs as we get closer. That’s still a month out, an eternity for model accuracy and the ability for big changes to be seen. *Edit: In semi-windshield washer form, the 12Z EPS did turn back a bit colder in the SE US the last few days of the run vs the 0Z run due to a weaker SE ridge though it doesn’t look nearly as good to me as yesterday’s 12Z. Regardless, it is well after the end of the 2 week EPS that has the best prospects for cold for the 2 reasons I gave above. Patience would be helpful.
-
The 12/13 extended GEFS/EPS are both headed for phase 8 mid-Dec. For those wondering how often E US cold has been associated with phase 8 in Dec (whether well outside, just outside, near, or inside the circle), here’s the breakdown of 3+ day long phase 8 periods in Baltimore as a representative (centrally located) E US city: For 3+ day long phase 8 (includes inside circle): 23 periods (* La Niña) 12/20-22/1974: +1* 12/19-31/1975: -4* 12/14-17/1976: -2 12/10-15/1977: -6 12/16-18/1979: -5 12/26-28/1981: -2 12/8-10/1982: -6 12/19-23/1986: -3 12/2-6/1988: +1* 12/1-4/1989: -9 12/9-18/1989: -16 12/2-4/1990: +6 12/1-7/1991: +1 12/9-14/1991: +8 12/9-12/1992: 0 12/20-25/1995: -8* 12/15-17/2000: 0* 12/21-25/2001: -1 12/5-9/2002: -15 12/1-3/2007: -4* 12/6-9/2009: -4 12/20-22/2009: -7 12/21-24/2017: +5* ——— Before analyzing the temperatures, note how the frequency of 3+ day long Dec phase 8 periods has plunged since 2009: -During 1974-2009, there were 22 three+ day long phase 8s through the 36 Decs or a frequency of 0.61/Dec. -But during 2010-2024, there was only ONE 3+ day long period or a mere 0.07/Dec, which is a minuscule 1/9 as often as that for 1974-2008! -The longest drought during 1974-2009 was a mere 4 Decs. But during 2010-24, there have been two 7 Dec droughts!@bluewave -So, based on this, although I’m hoping the latest extended EPS/GEFS are correct in projecting a 3++ day long phase 8 this Dec, I’m taking it with a grain for now. —————— Now to analyze the Baltimore temps for the 23 three+ day Dec phase 8 periods 1974-2024: -# of periods: MB 4 (17%), B 10 (43%), NN 6 (26%), A 2 (9%), MA 1 (4%) -So, there have been nearly 5 times as many B/MB periods as A/MA periods! -The average daily anomaly was -4 over the 112 days. @donsutherland1
-
The latest MJO forecast is a mix with GEFS not looking as good but the Euro still looking good: 11/14 GEFS further right with it hung up in middle of 6 rather than 6/7 border: But Euro is still all systems go to 7/8: 11/14 Euro ~same as yesterday with progression into 7: 11/13 extended Euro (they run a day later) continues to look very nice with it again getting to the often cold in the E US phase 8 mid-Dec (can’t ask for better for then): And yesterday’s extended GEFS also heads to phase 8 mid-Dec:
-
But they for much of Dec actually have a stronger SE ridge than prior runs even though they show it weakening through the month: these, which are from the ECMWF site, itself, are definitely not showing persistent cold in the E US, especially Mid-Atlantic and more especially in the SE. Heart of the cold is Chicago W and SW. Dec 1-7: significantly warmer than prior runs thanks to SE ridge Dec 8-14: slightly warmer than prior runs Dec 15-21: Dec 22-28:
-
Tell me about it, Ray! For those not knowing about or seeing what we’re talking about, check this craziness out: not a single day in the entire DJF 1995-6 for the 10 mb zonal mean wind at 60N to be below the 1958-2022 mean and with most of Jan/Feb above the 70th percentile:
-
The avg SPV strength of a winter is by no means anywhere close to an end all be all factor as many of us know. For example, these winters had an SPV on the strong side but still had cool to cold in much of the E US (a bit counter-intuitive): -1980-1 DJ -1983-4 -1995-6 -2013-4 -2024-5 DJ https://acd-ext.gsfc.nasa.gov/Data_services/met/ann_data.html
-
No worries, Don! Very easy to do. I sometimes get them mixed up. Actually, at first, I didn’t see what I noticed with a second look.
-
Thanks for the link! From there: Nov/Dec 1983: SPV not even weak ————- Nov/Dec 1989: SPV actually pretty strong ——————- Nov/Dec 2000 no reversal but SPV quite weak with low ~+4 late Nov: So, none of Novs/Decs 1983, 1989, and 2000 had a major SSW (reversal) though 2000 had a weak SPV. @snowman19
-
Thanks as always, Don. The weakest zonal winds/wind reversal on your bottom chart (Euro zonal wind forecast for 12Z on 11/22/25) actually are within 60-90N (blue shades) rather than south of 60N. For 60N at 10 mb, this actually shows a very weak wind of a mere +5 on 11/22 (and is dropping) and that’s still ~3 days before the EPS mean drops to 0.
-
Today’s 2 week GEFS and EPS MJO progs are in very good agreement on the MJO being hung up near the 6/7 border with moderate intensity: GEFS: EPS: Here’s yesterday’s (11/12/25) extended EPS (these always come out at this site a day later): after the near 2 week long stall near the 6/7 border, it crawls through 7 and then barely into 8 with a trajectory that suggests it might collapse into within the circle/weak amplitude soon afterward. But keep in mind that should it actually occur, a weak amplitude doesn’t at all necessarily mean mild in the E US as weaker MJO on the left side is often associated with cold based on analyses I’ve done and posted here plus charts I’ve seen from others: just outside the circle phase 8 in Dec like this shows has sometimes been associated with quite cold in the E US:
-
I’m still looking for strat. zonal wind data for 1983 and 1989. In the meantime, I did find the following graph, which is of 65N to 90N zonal mean temperatures at 10 mb in 1988 and 1989. Look on the far right: although there was no major SSW in any of the tables I look at (meaning no reversal of zonal winds at 10 mb), you can see there still was a bit of a stratospheric warming spike centered on ~Dec 1st of 1989 to near a record high for that date: https://www.cpc.ncep.noaa.gov/products/stratosphere/temperature/archive/10mb9065_1989.gif —————— This is even more evident further up at 5 mb and at 2 mb: 5 mb: 15C spike warming centered near 12/1/1989: https://www.cpc.ncep.noaa.gov/products/stratosphere/temperature/archive/05mb9065_1989.gif ————— 2 mb: 15C spike warming centered near 12/1/1989: https://www.cpc.ncep.noaa.gov/products/stratosphere/temperature/archive/02mb9065_1989.gif
-
Ray, You have to go to the bottom of this and then choose the winter: http://arctic.som.ou.edu/tburg/products/realtime/strat/ Unfortunately, one can go back only to 1990-1 from this source for some reason even though graphs exist back at least to 1958-9.
-
There are no official Nov or Dec major SSWs based on reversals at 10 mb for any of 1983, 1989, and 2000. To be fair if you read this closely, BAMwx isn’t explicitly saying that there was an early major SSW in any of those 3 years (if they were they’d be wrong): A few of these years were absolutely blockbuster in December. Chances to replicate the intensity of cold in years like 2000, 1989 and 1983 are unlikely, but there is strong support notable cold the first half of December setting up. That’s not to say that the SPV wasn’t weak. Despite no reversal, 2000 was quite weak mid-Nov through Dec with a low of +4 to +5 m/s in late Nov as per the chart below: (I don’t have these charts for 1983 and 1989….does anyone else have a link to them?):
-
Snowman, I don’t see an SSWE at any point in Nov or Dec of 1989. Where are you seeing that? https://www.researchgate.net/figure/The-SSW-and-SFW-event-onset-date-year-and-type-identified-in-the-NCEP-NCAR-dataset-The_tbl1_267063738
-
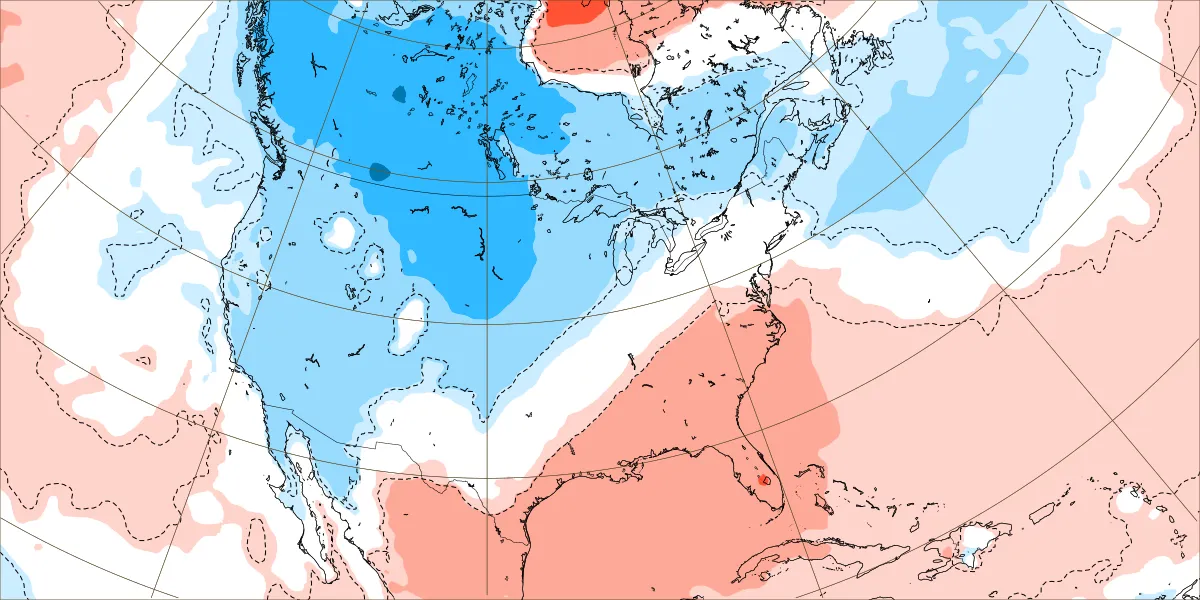
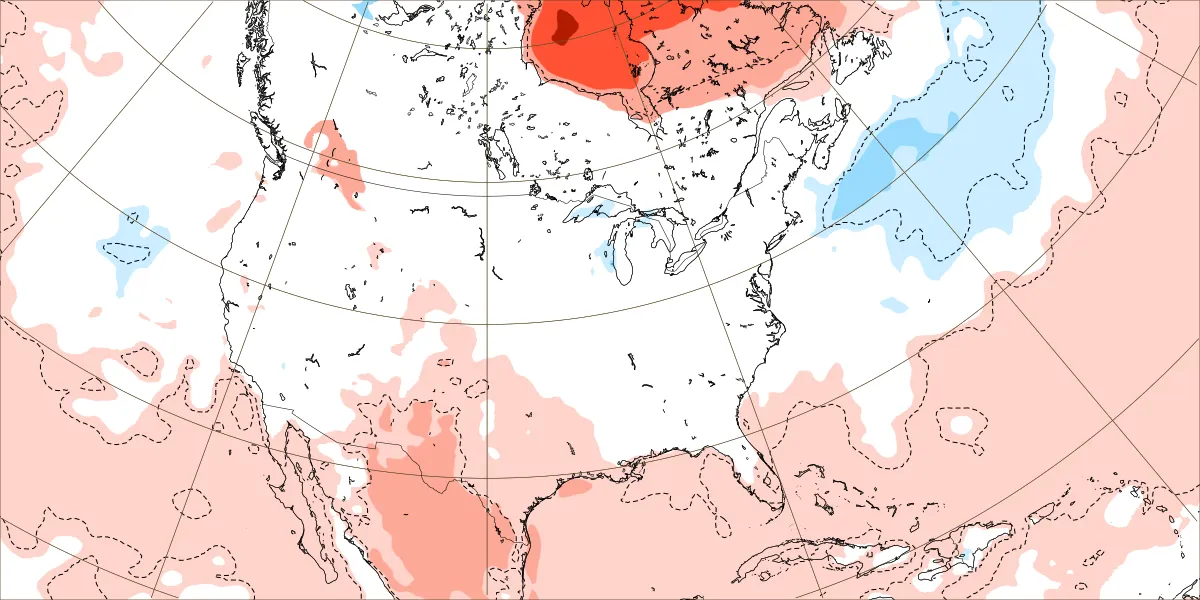
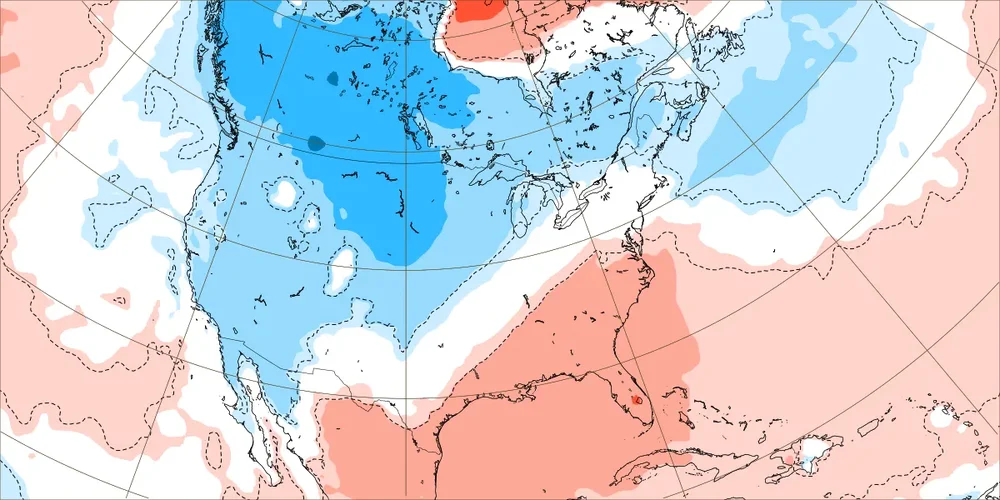
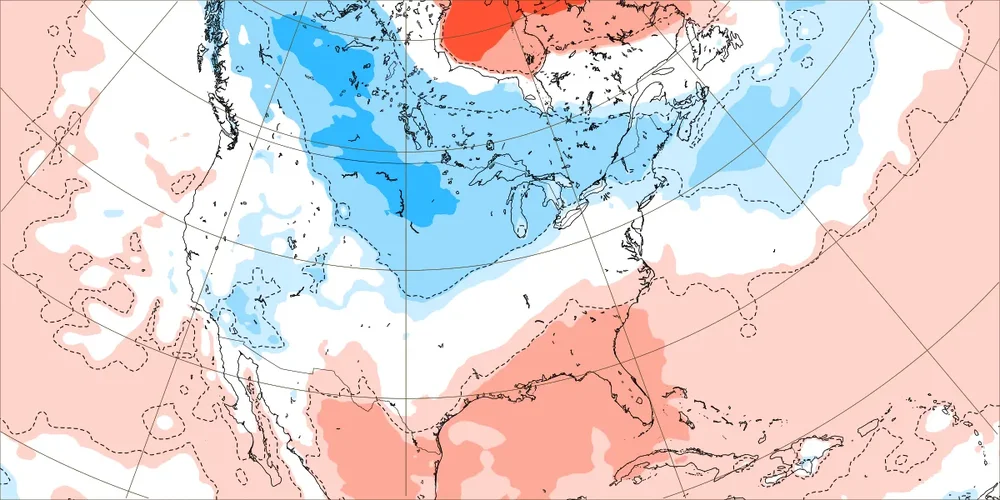
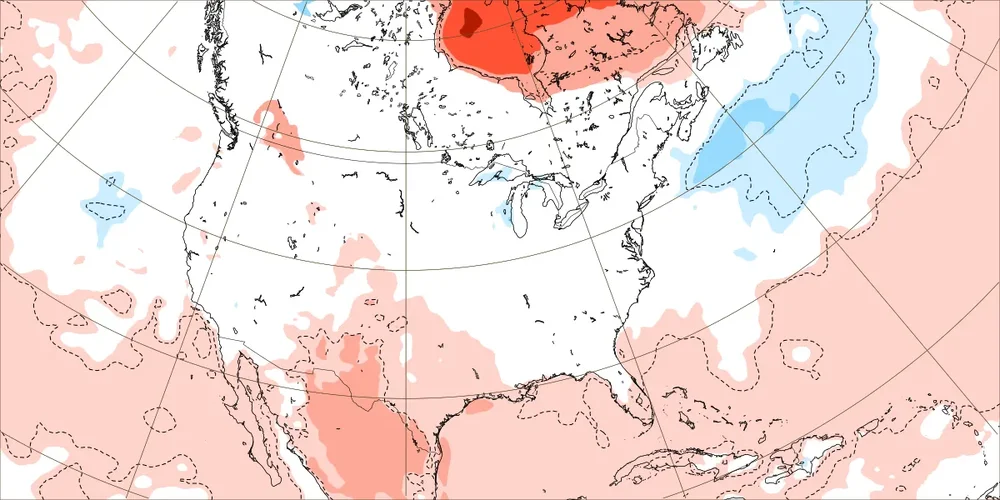
There are 5 major SSW events on record between Nov 24th and Dec 7th:-1958-1965-1968-1981-1987Here’s the Dec temp. anomaly map: E US mainly 1-2 F BN Here’s the Jan temp. anomaly map: E US mainly 2-4 BN, which incorporates extreme cold in places during 1966 (late), 1982 (mid) and 1988 (early): Here’s the Feb temp. anomaly map: E US NN: So, the coldest month regarding E US anomalies was Jan and the warmest was Feb. Feb. might have been even warmer (warmer than normal) had 4 of these 5 winters not been during El Niño, which tends to favor cold in the 2nd half of winter vs La Nina’s colder 1st half. All of this is telling me that should the late Nov major SSW actually occur, the coldest month could easily be Jan rather than Dec, which makes sense considering an assumed several week lag. But, of course, that would remain to be seen especially considering La Niña often favoring Dec as the coldest anomalywise. https://www.researchgate.net/figure/The-SSW-and-SFW-event-onset-date-year-and-type-identified-in-the-NCEP-NCAR-dataset-The_tbl1_267063738