

GaWx
-
Posts
18,240 -
Joined
Content Type
Profiles
Blogs
Forums
American Weather
Media Demo
Store
Gallery
Everything posted by GaWx
-
Euro Weeklies are still not giving in to more active. Sunday’s had member mean of 27 ACE for the next 4 weeks vs 1991-2020 avg of 58. If relative quiet were to verify, they’d deserve major kudos for being so persistent. Regardless, they’re still calling for some activity and not anywhere near dead.
-
You’re off on the month with the freezes that absolutely devastated the 2023 GA peach crop. It was March, not May. This was the mid-March cold snap that resulted about a month after the 2/16/23 major SSWE. After “one of the warmest Februarys on record for Georgia,” Knox said, those varieties came out of dormancy early and prepared to bloom just in time for mercilessly freezing weather in March. https://www.gpb.org/news/2023/07/05/dire-situation-what-caused-georgias-catastrophic-peach-crop-failure Most of GA’s peaches are grown just SW of Macon. Macon had freezes on 3/15, 16, 20, and 21. Those were the last freezes of the season: https://www.weather.gov/wrh/Climate?wfo=ffc
-
Report: Another Year of Record Heat for the Oceans
GaWx replied to donsutherland1's topic in Climate Change
Thanks, Charlie. I just figured out the reason for the misleading info. I just found a link in Hawkins’ article to this article written by James Dinneen, a science and environmental reporter: https://www.new-scientist.com/article/2444394-part-of-the-atlantic-is-cooling-at-record-speed-and-nobody-knows-why/ From this: “Part of the Atlantic is cooling at record speed and nobody knows why” is the headline “After over a year of record-high global sea temperatures, the equatorial Atlantic is cooling off more quickly than ever recorded, which could impact weather around the world. Over the past three months, the shift from hot to cool temperatures in the equatorial Atlantic Ocean has happened at record speed. This emerging ‘Atlantic Niña’ pattern comes just ahead of an expected transition to a cooler La Niña in the Pacific Ocean, and these back-to-back events could have ripple effects on weather worldwide.” Then within the article I saw this very important note: “Article amended on 22 August 2024. We clarified that warming is happening in part of the Atlantic and that long-term warming signals are not covered in the graph” The rest of the article there is paywalled. But then I found another link to the original article that isn’t paywalled: https://archive.ph/2024.08.20-103704/https://www.newscientist.com/article/2444394-the-atlantic-is-cooling-at-record-speed-and-nobody-knows-why/ From this: “We are starting to see that the global mean ocean temperatures are going down a bit,” says Pedro DiNezio at the University of Colorado Boulder. According to the US National Oceanic and Atmospheric Administration (NOAA), global sea surface temperatures this past July were slightly cooler than in July 2023 – ending a 15-month streak of record-high average ocean temperatures.” Then further down is this graph, which seems to be the key to the miscommunication and thus lead to the amendment note in the paywalled link that I bolded above. Focus on the far right, where 2024 is shown with a rapid cooling of anomalies from ~+1.15C in Mar to ~-0.5C in July or an anom. cooling of ~1.65C in just 4 months. So, evidently JB, himself, or someone else JB read misinterpreted that the entire or at least a large portion of the Atlantic cooled by 1.65C in just 4 months when in reality that was the case for just the (Nino portion of the?) eq. Atlantic. Then that lead to the need to amend the Dinneen article. But unfortunately there remains a huge problem. I’m not expecting JB to clarify because the misinterpretation of “record cooling of the Atlantic” fits his narrative of the recent underwater seismic activity drop leading to significant ocean/global cooling. @roardog@donsutherland1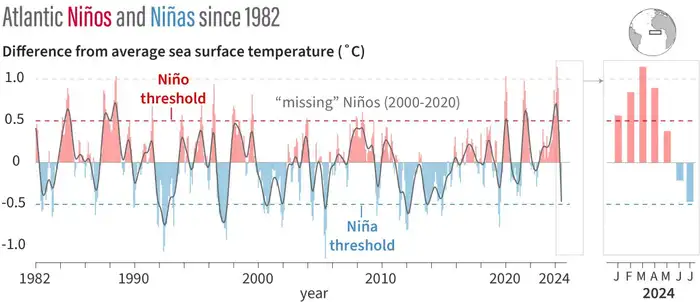
-
Hey snowman, FYI, I couldn’t see what’s at your Facebook link. This may be because I don’t have a FB account. Are you able to copy and paste it?
-
Report: Another Year of Record Heat for the Oceans
GaWx replied to donsutherland1's topic in Climate Change
Today on his free Saturday Summary, JB reiterated that not only is the Atlantic cooling, the entire globe is cooling due to a lagged response to reduced underwater seismic activity. Does anyone have any reliable data source that actually shows this “record” speed of cooling? -
The tropics look like they may get active again in just over a week. If so, that would mean the quiet period would end up under 2 weeks long. Not long at all unfortunately.
-
The SE had one notably cold week in early to mid-March largely attributed to the -NAO/-AO caused by the 2/16/23 major SSW. The -NAO started 2/26 and the -AO started 3/4. The cold took its sweet time to get here due to the stubborn RNA and was also shortlived. But it still got here within 3 weeks.
-
But the CONUS has already had 2 H landfalls and it’s still pretty early. That’s pretty rare for this early. Since 1950 only 2020, 2005, 2004, 1986, 1985, and 1959 had 2+ CONUS H landfalls by Aug 31st.
-
Regarding high solar/W for all ENSO, there are 9 winters since 1948 as I listed earlier today. Of those nine, seven had at least one major SSW and two of those seven had two: 57-8: 1/31 59-60: 1/17 78-9: 2/22 80-1: 2/6 and 3/4 90-1: none listed 99-00: 3/20 01-02: 12/31 and 2/18 13-14: none listed 22-23: 2/16
-
On what are you basing it taking at least 1-2 months for blocking pattern to come after a major SSW? Per @Stormchaserchuck1 it takes less time especially later in the season.
-
It’s crucial what years Joe is including. I see that his high solar/W map has a BN SE….hmm. Since 1948 there are only two Niña/W winters with high solar (though not necessarily right at max): 99-00 (Roni -1.7)(NN SE) and 22-3 (Roni -0.8)(warm SE). Also, both had strong -PDO. Thus, these are the 2 best analogs for QBO/solar. But Joe undoubtedly included others in his set because those two alone averaged mild in SE. The other high solar/W have these Roni’s/PDO: 57-8: +2.0/+ terrible analog/very cold SE 59-60: 0/+ poor/cool SE 78-9: +0.2/mod - fair at best/cool SE 80-1: 0/+ poor/cool SE 90-1: +0.6/strong - fair at best/warm SE 01-02: -0.2/strong - pretty good/mild SE 13-14: -0.5/mod - pretty good/cool SE So, best analogs: 1999-0, 2022-3 Next best analogs: 2001-2, 2013-4 No telling what of these Joe included. He may have included ~all of these to come up with his high solar/W, which if so would imho be misleading for 2024-5 forecasting. With the cool El Ninoish look in the SE on his map, I’m suspecting he’s also including some or all of 57-8, 59-60, 78-9, and 13-4. The only of those I’d consider a decent analog is 13-4. @40/70 Benchmark
-
GT!!!!! Wooooo! Ooops, wx thread…PC and warm.
-
The 6Z Euro-AIFS has a TC that originates from a TCG in the vicinity of the Leeward Islands ~Sept 2nd. This makes it the 21st run in a row with a TCG near the Leewards ~9/2. This goes all of the way back to the 6Z 8/19 run! You can still see all of these runs on Tropical Tidbits.
-
Report: Another Year of Record Heat for the Oceans
GaWx replied to donsutherland1's topic in Climate Change
Thanks. JB putting a lot of weight on this article isn’t surprising because it fits his narrative of cooling oceans after a drop in underwater seismic levels. 1. But and this isn’t directed at you: who’s Joshua Hawkins? Not a met/climatologist: “Josh Hawkins has been writing for over a decade, covering science, gaming, and tech culture. He also is a top-rated product reviewer with experience in extensively researched product comparisons, headphones, and gaming devices. Whenever he isn’t busy writing about tech or gadgets, he can usually be found enjoying a new world in a video game, or tinkering with something on his computer.” https://bgr.com/author/joshua-hawkins/ 2. Hawkins says this: “The Atlantic Ocean is cooling at an exponential rate, and nobody is sure why. It's been more than a year of record-high global sea temperatures, including being close to the collapse of the AMOC. Despite those troubles, though, the Atlantic is now experiencing something quite baffling-temperatures are cooling, and scientists are scrambling to figure out what's going on.” Where is the evidence that the Atlantic is cooling at an exponential rate? Again, not directed at you, roardog. -
Report: Another Year of Record Heat for the Oceans
GaWx replied to donsutherland1's topic in Climate Change
JB has been harping on a significant cooling of oceans overall in recent months. He’s implying this is due to reduced underwater seismic activity and is thus very excited. But the problem I have is finding this cooldown! I’m still seeing near record warmth in many areas. Thus I’m confused. Does anyone here know about a significant worldwide averaged ocean cooling? If so please post any links. -
Thanks for pointing this out. By the way, note that same warm anom spot that’s on most of the WB CFS over N Mich/N L Mich (+1C) while just 200 mi S (where it is almost always much colder on these WB CFS) it is -7C. So, a whopping 8C difference! And then note the cold to the N of the warm spot. Like clockwork. Keep in mind that the bogus map is merely a control run. To compare, here’s a much more believable Jan CFS map from TT, the avg of the last 12 runs:
-
The dewpoints well down into the 60s along with pretty brisk NE winds and afternoon temps in the 80s here the last couple of days have been refreshing for summer!
-
QBO/solar 1950-1 slight E/moderate solar ~3 yrs after prior peak 1961-2 slight W/moderate solar ~4 hrs after prior peak
-
What do you mean by “a bit more aggressive”?
-
I don’t have much to go on though I did see this at another BB fwiw: “If I’m being honest, the only model I have much trust in right now is the AI-EURO. Mainly because it’s gotten every storm this season (was a bit slow with Debby but caught on) and caught on 10-14 days out.”
-
Extended summer stormlover74 future snow hole banter thread 23
GaWx replied to BxEngine's topic in New York City Metro
Followup showing that this WxBell CFS map was as expected significantly too cool at DC for 8/16-20: As the above WxBell map for 8/16-20 shows, it had DC and vicinity at 6.5 F BN. It ended up verifying at only 0.7/1.8 F BN at IAD/DCA, which is close to what the DCA NWS had predicted: 1. IAD: actual mean/1991-2020 normal mean 8/16: 75/76 8/17: 78.5/76 8/18: 80/76 8/19: 76/75.5 8/20: 66/75.5 So, 8/16-20: 75.1/75.8 Thus IAD verified at only 0.7 F BN vs WB forecasted ~6.5 F BN. https://kamala.cod.edu/offs/KLWX/2408170524.cdus41.IAD.html ————————— 2. DCA: actual mean/1991-2020 normal mean 8/16: 79.5/79.5 8/17: 79/79.5 8/18: 80/79.5 8/19: 80.5/79.5 8/20: 69.5/79.5 So, 8/16-20: 77.7/79.5 Thus IAD verified at only 1.8 F BN vs WB forecasted ~6.5 F BN. https://kamala.cod.edu/offs/KLWX/2408170524.cdus41.DCA.html This adds to the evidence that WxBell CFS maps have significant flaws in their map generating algorithms as TT CFS maps weren’t nearly as cool. @donsutherland1 -
The 6Z Euro-AIFS has a TC that originates from a TCG in the vicinity of the Leeward Islands ~Sept 2nd. This makes it the 17th run in a row with a TCG near the Leewards ~9/2. This goes all of the way back to the 6Z 8/19 run! You can still see all of these runs on Tropical Tidbits
-
I’d say the 18Z is about the most active GEFS for early Sep yet though not really that active for late Aug as there were a number of runs more active for then awhile back. **Corrected from 12Z to 18Z
-
The 12Z AI-Euro is the 14th run in a row with TCG near the Leewards ~9/2. It then recurves near 70W fwiw.
-
12Z Euro has no TC. But per last 13 Euro AIFS runs the crucial period for TCG may be centered around Sep 2nd, just beyond the 12Z Euro 240.


