J.Spin
-
Posts
6,440 -
Joined
-
Last visited
1 Follower

About J.Spin

Recent Profile Visitors
10,290 profile views


-
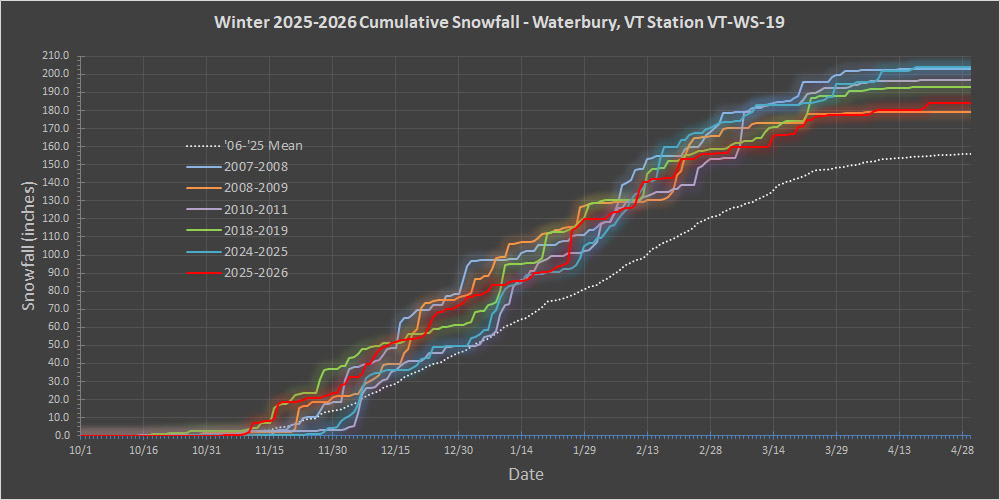
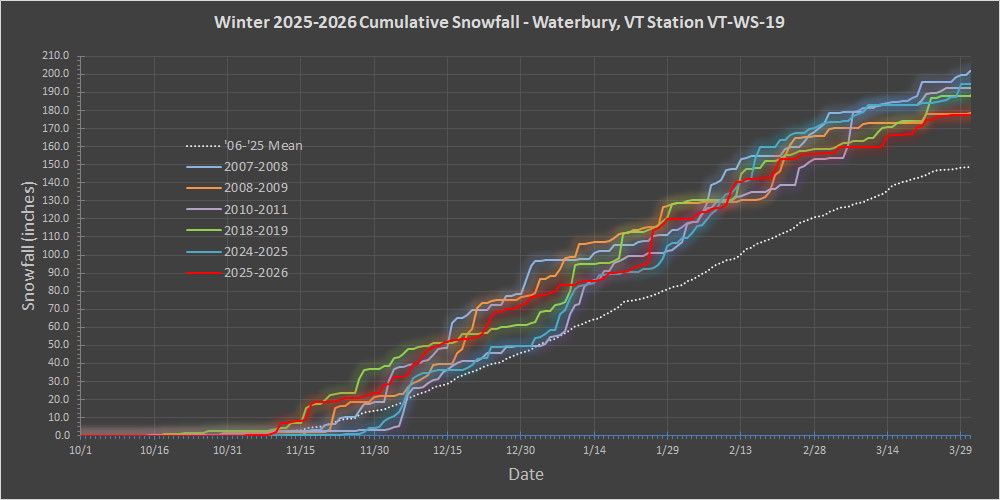
I hadn’t had a chance to put together our site’s seasonal snowfall progress update for April, but I’ve finally had some time to sum it up. The updated seasonal snowfall progression plot is below, and this season (shown in the red line) doesn’t look like it’s going to finish in there among the upper echelon of top 5 seasons. It’s certainly been a solid snowfall season though, and as you can see from the plot, it’s sitting in that zone between 2008-2009 (orange line) and that grouping of snowier seasons. The month of April itself was fairly average from a snow perspective, delivering 6 days with snowfall, 4 accumulating storms, 6.6 inches of snow, and 12 days with snow on the ground. Even though it doesn’t look like the winter of 2025-2026 is going to be a record snowfall season, I can already see that it’s going to have a number of records associated with it like the highest number of December snowstorms, highest number of March snowstorms, etc. And on that note, it has now set the record for the greatest number of accumulating storms at 66. This beats out the previous record of 64 storms held by the 2018-2019 season, and this season’s detailed winter storm list to date is provided below: We’ve only had a trace of snow at most this May, so there’s nothing new to add to the season total, but I’ll do a full season report when we get to June. The data from my last report indicated that the season was looking to end up in the range of 180-190” of snowfall, and indeed that’s right where things stand. The odds of ending up in that range are now near 100% I checked where the Vermont ski areas stand for season snowfall, and the north to south listing of totals is below. The resorts along the spine of the Northern Greens all surpassed the 300” mark, and Jay Peak exceeded 400”. That’s certainly decent, but fairly typical and nothing near record breaking. Being around 300” is average for those resorts, aside from Jay Peak where the average is ~350”, so they were definitely a bit ahead of the game since they surpassed 400”. Most of the rest of the resorts saw <200” of snowfall, which is not uncommon for the southern resorts, but is below average for some of the central resorts. Jay Peak: 410” Burke: 173” Smuggler’s Notch: 312” Stowe: 310” Bolton Valley: 307” Mad River Glen: 192” Sugarbush: 234” Pico: 195” Killington: 195” Okemo: 129” Bromley: 178” Magic Mountain: 112” Stratton: 153” Mount Snow: 130”

-
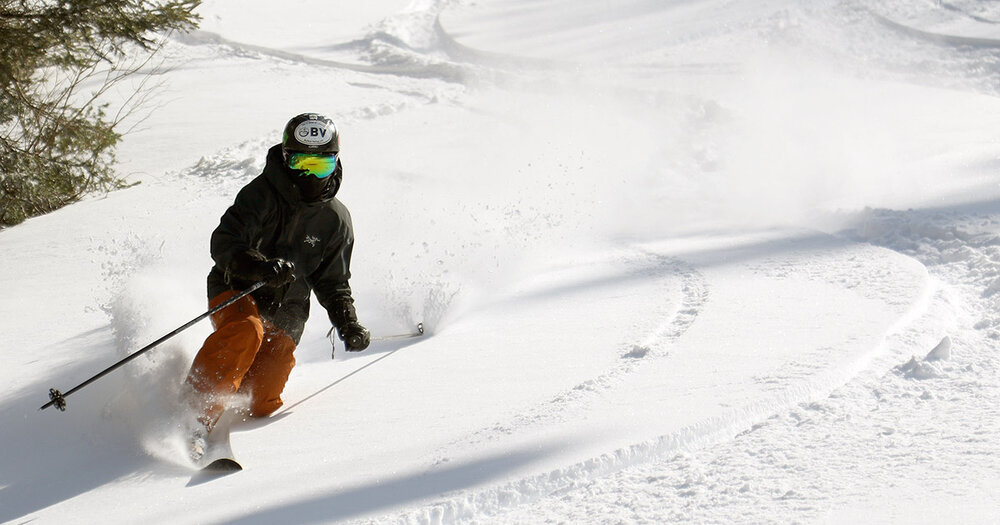
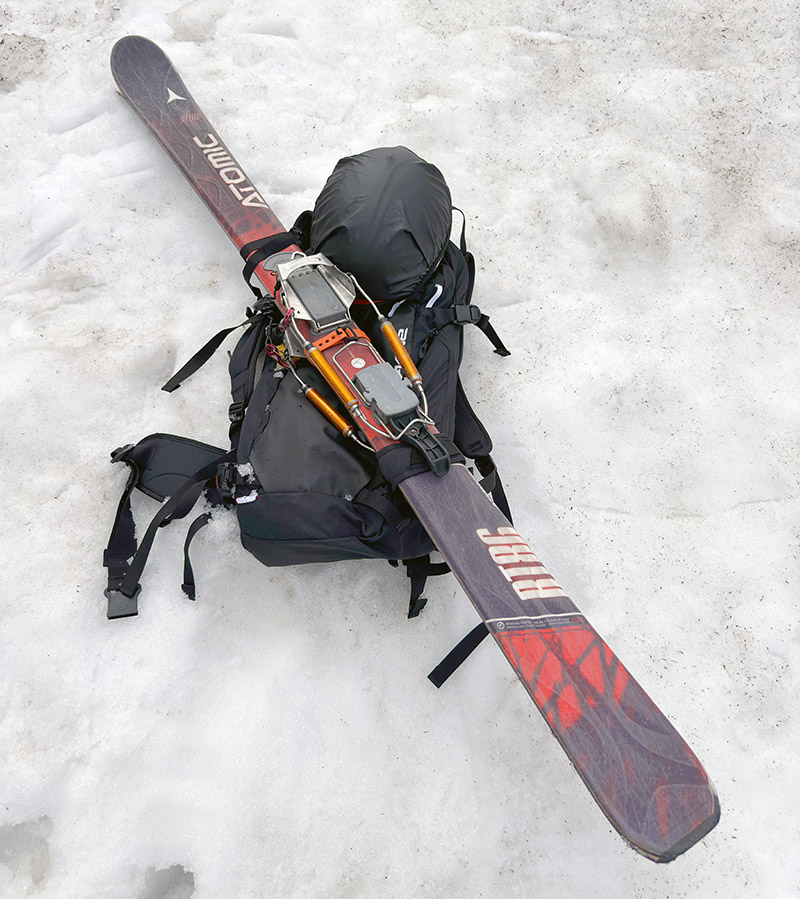
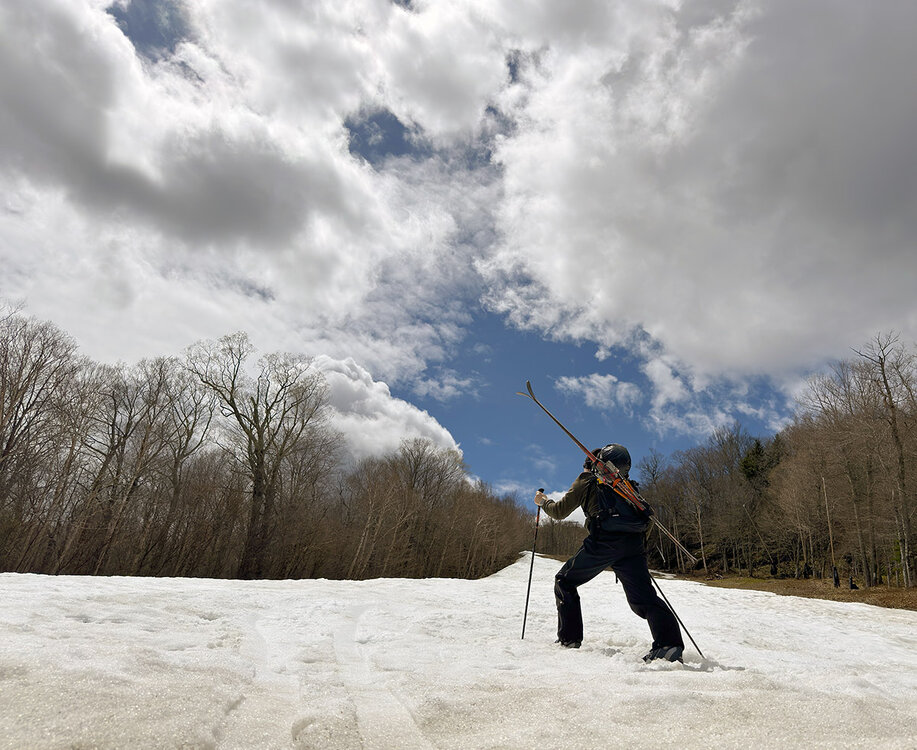
For several days I’d been looking for a chance to get out for my next ski tour, but it wasn’t until yesterday that the weather and my schedule lined up for an outing – or at least I thought the weather had lined up. I headed toward Stowe in the morning, since that was supposed to be the sunniest part or the day. I left our place in Waterbury under sunny skies and temperatures in the mid-50s F, but as headed north, clouds began to appear, and they were thicker and darker around Mt. Mansfield. Eventually, I saw that there were obvious rain/snow shafts around the mountain, and by the time I pulled into the main parking lot, I was hit with a maelstrom of wet snow and graupel. It was amazing to think that over a distance of less than 10 miles I’d gone from clear skies and temperatures in the 50s F to heavy snow falling, but that’s what you get in the Northern Greens, and that’s the power of Mt. Mansfield. I was looking for a relatively short ski tour, and the highest availability of lower-elevation snow was definitely on the terrain below The Nose. The North Slope trail is often a good bet for these types of late season outings, but yesterday, Hayride seemed to offer better snow availability. That’s always a fun feature of these later spring days – you get different terrain options each spring based on how the snowmaking was done and how the weather patterns treated the snow. With the snow falling at the beginning of my tour, I debated putting on my shell for the start of the ascent, but the precipitation quickly began to subside, and before long I was starting to see patches of blue sky around the mountain. By the time I began my descent, the weather was back to more of what you’d expect on a nice spring day in the mountains. Even with the snowfall, the temperatures hadn’t fallen too far, so the snow was staying soft and springlike. The snowpack that’s out there now has seen a lot of spring temperature cycling by this point, so the quality of the corn was quite good, and the only places to avoid were areas where the snow was ground up or bumpy due to previous vehicle traffic or weird melting patterns. The snowpack isn’t continuous anywhere down near the base of the lifts, but you get into some good long areas of coverage just a few hundred vertical feet up. I’ve been using a new Dakine Poacher 22L ski pack for touring over the past month or two, but I’ve been able to continue skinning for ascents so far this spring, so yesterday was my first chance to try it out for actually carrying skis. Prior to this pack, for years I’d been ski touring with my Dakine Sequence pack, which is specialized for carrying both skis and photo gear. But the volume of the Sequence is around 33L, and for a while I’d been wanting something smaller for days when I’m not carrying multiple camera lenses. I was looking for something in the 20-25L range, and the Poacher 22L really fit the bill. It’s been a while since I’d shopped for a ski pack, and I had no idea of the dozens and dozens of top notch companies that make them now – there clearly must be quite a market for them. I looked around at many brands, but the Poacher 22L won out when I saw the video Dakine put together that thoroughly covered the redesign they did in 2022 – it just ticked so many boxes for me that it was the obvious choice. Plus, our family has various Dakine ski packs, and Dakine definitely knows their stuff when it comes to making a practical pack for frontcountry, sidecountry, and/or backcountry skiing. I won’t do a full review here, but I’ll mention a few key features that I finally got to try out during yesterday’s outing. A nice feature that many of the newer ski packs are adding is dual position helmet carry – instead of just being able to carry your helmet directly on the back of your pack, there is now an additional carry position available at the top of the pack using the same helmet carrier. They figured out that when you go with diagonal ski carry (which is definitely my preferred positioning), your skis and helmet are horribly in the way of each other when the helmet is on the back of the pack, so the top carry position gets the helmet out of the way of the skis. As one might expect, I tried out the top carry mode yesterday, and it’s a huge improvement – the skis still push on the helmet a bit, but it’s a monumentally better position. The top position does block access to some of the upper pockets, but the option is there when you need it. The next feature I was able to get a sense for yesterday was the internal frame they have in the pack. It’s really just a stiff wire that runs around inside the pack, so it’s extremely light, but it adds an incredible degree of rigidity to the pack. When I initially got the pack I was thrown off by how stiff the whole structure was relative to similar ski packs I’ve owned and used, but then I realized where they were going – if you’ve ever carried skis on an empty backpack with no frame, you know what I mean. Skis can bounce all over the place on empty packs with no support, and this wire frame setup totally takes care of that issue. Finally, I even tried flipping my pack around and opening it in access mode with skis on the pack, and that even worked. Dakine is well known for their back access zippers that let you get to the contents of the pack without taking the pack off – you just slide your shoulders out of the straps, spin the pack around to the front, open the back zipper, and the pack works like a table/desk in front of you with access to your gear. The internal wire produces an even more stable platform, and I’ve tried it for photography on several outings this spring and been very impressed. I’ve used this feature on other Dakine packs, but the stiffness with the internal wire was remarkable, and I even tried it with my skis still on the pack to see if it was practical. I think it’s best if you rest the tips of your skis on the snow when you do it, but I was surprised at how well it handled all that extra weight of the skis. Anyway, as a first trip with the pack in which I actually carried skis, I figured I’d send along some impressions for others that might be wondering about the real world utility for some of these ski pack features.


-
Yesterday was another gorgeous one with temperatures in the 50s F, so I headed back to Stowe for a bit of ski touring. Looking at some of the available options, I decided to head to MMSC/Spruce Peak again since the descents there are starting to lose their snow continuity, and top to bottom won’t be very efficient before long. Snow on the Gondola terrain looked more robust, especially over toward Perry Merrill, so that will probably hold out longer in terms of providing more sustained continuous descents. Overall I’d say weather conditions on the mountain were similar to what I experienced last weekend, except that yesterday didn’t have those strong southerly winds. Sometimes winds can be helpful in keeping the snow cooled just a bit more to reduce stickiness, but snow quality wasn’t an issue yesterday, so the lack of wind just wound up making it more comfortable on the mountain. In fact, I think additional spring temperature cycling has helped the snow a bit over the past week, because there was some excellent spring corn out there that topped what I found last weekend. Whereas last weekend I was on the Meadows Quad and Sunny Spruce Quad terrain, yesterday I focused on Sensation Quad terrain, and Main Street delivered some really good surfaces as it often does. The temperature cycling over the past week hasn’t really pushed the snow into sun cup mode, it just sort of smoothed out some terrain areas and set the best areas of snowpack up with that inch or two of corn snow on top that you can just shave off with effortless turns. Unfortunately, not every part of the descent featured those perfect surfaces, and there area already some gaps in the continuous snow if you start in the upper flats of Main Street, but there are still a lot of great turns out there.


-
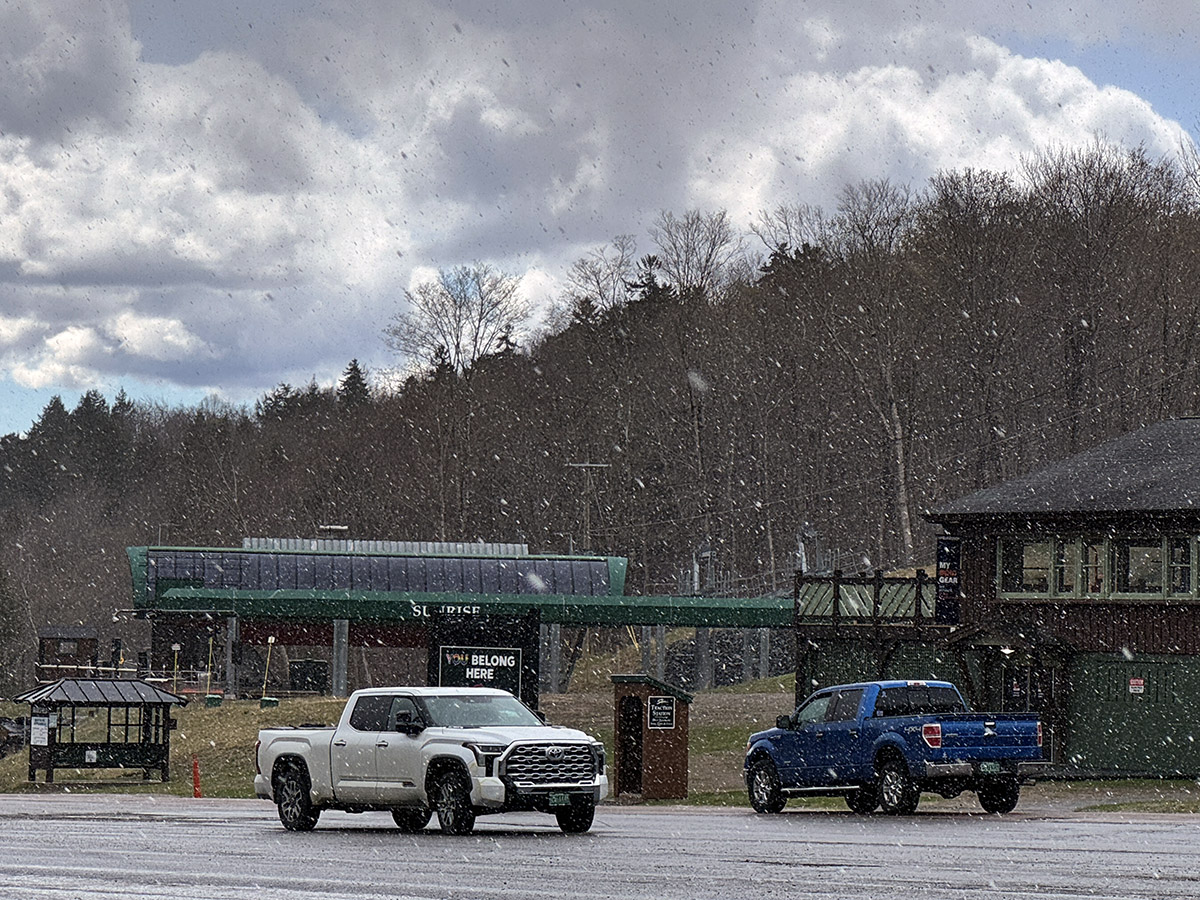
With just an inch or two of snow falling here in the valley on Sunday, I hadn’t planned to ski yesterday – even a couple of inches at the mountain wasn’t really going to cut it in terms of covering up the old snow and bare patches on the slopes. But yesterday morning I woke up to 1-2”/hr. snow pounding down, and that called for a change of plans. With 4 inches of accumulation here at our site in the valley, the mountains had almost certainly done quite well, so I was quickly scrambling to get my gear together for an impromptu ski tour. As one would expect with marginal spring temperatures, snow accumulations were quite elevation dependent. Snow was just patchy down at the base of the Bolton Valley Access Road at ~340’ by midmorning when I was heading up to the mountain, but up in the Bolton Valley Village at ~2,000’ there were accumulations of 6-9”. Temperatures were in the mid-20s F, and the new snow was dry, medium weight powder with plenty of liquid equivalent. We picked up ¾” of liquid in the valley, so there was probably 1” of liquid in the snow up high, and it skied very well. It was enough to easily cover low and moderate-angle terrain for bottomless powder turns, but it was almost too much for snow skiing the lower angle slopes. Indeed it was dry enough to let you cruise on low-angle terrain, but moderate angle terrain was the better option. Accumulations increased a bit more with elevation, up to roughly 7-10” in the 2,500’-2,700’ range, but they didn’t seem to get much deeper than that. All in all though, with base snow and most water bars still covered, it was more than enough for a solid April powder skiing session.


-
Yesterday’s weather was gorgeous, with temperatures in the 60s F and blue skies, so I headed to Stowe for some ski touring. The Spruce Peak terrain still has decent snow and easy access at this time of year via the MMSC parking lot, so that’s where I started my tour. There were about 6 to 10 other cars there around midday, with a group of several skiers tailgating after finishing their time on the snow. Snow conditions were quite nice, with good spring corn and only minor areas of stickiness. I toured up toward the Meadows Quad, and coverage was more than sufficient for a full descent, but it looked like the terrain off the Sensation Quad also offered a continuous or near continuous descent. The only knock against the weather was that there were some brisk southerly winds. They were notable, but the temperatures were warm enough that I still never had to pull out my shell during the tour.
-
Thanks for the snowpack updates PF. Down in the valley at our site, Saturday was the first day without any snowpack left on the property, so April 10th was the last day of the continuous snowpack season this time around. The average snowpack ending date at our site is April 13th, so this year was indeed quite close to an average melt out. The overall continuous snowpack duration this season was on the high side of average though (151 days) because we had such an early start – November 11th, which ranked third for early starts behind November 8th in 2019 and November 10th in 2018. This season was notable though in the data set, because it actually pulled the mean snowpack start date down into November. These seasons with early snowpack starts are great with respect to skipping out on a bunch of stick season and getting the ski season going, but five months straight with snow on the ground is quite a stretch – it takes a bit of adjustment when you start seeing the grass again.
-
Yesterday’s system was our biggest snowmaker of the month thus far, so I decided to head up to Bolton this morning to get in some turns in the fresh snow. I wasn’t exactly sure what I was going to find up at the hill, just a couple of new inches atop a hard base, or something more, but when I stepped out of my car at ~2,000’ into 4-6” of dry powder, the prospects were looking good. I toured in the 2,000’ – 2,700’ range and didn’t really find any increases in snow depths with respect to elevation aside from the occasional 7” measurement in sheltered hollows. The powder was staying light and dry even as of late morning, and I’d say it held about a third of an inch of liquid equivalent. That was enough for bottomless turns on low angle terrain, but anything steeper and I was quickly contacting the subsurface. The powder was dry enough to support really nice turns and speed even on lower angle pitches though, so that made for a fantastic descent. An added plus was that there was bright April sunshine out there, and it warmed you up quickly. Thankfully the air was dry enough to keep the powder in good shape despite the strong sun, at least through the morning hours. In terms of seasonal snowfall, this storm pushed all the resorts along the spine of the Northern Greens past the 300” mark, and Jay Peak past 400”, so some good seasonal benchmarks were reached with this one.


-
Yesterday was the nicer day of the weekend, so my wife and I headed up to Bolton Valley for some spring skiing. Temperatures were in the 40s F up on the mountain, although I wouldn’t be surprised if there were some 30s F up in the 3,000’ range. The sunniest part of the day was early afternoon, and altogether the sun and temperatures were enough to nicely soften the snowpack in many areas. Conditions were still somewhat inconsistent though, with firm areas underneath the spring snow in various spots that made the skiing a bit more challenging than when you get those perfect sunny days with just the right temperatures that set up great corn snow that is soft but not sticky. One of the best areas we visited was the lower half of Hard Luck, it had some of the most consistent surfaces and just the right pitch to go with it. Surprisingly, Spillway right next door was closed, and it was perhaps due to its steep pitches with some of those areas that had been scoured and were very icy.

-
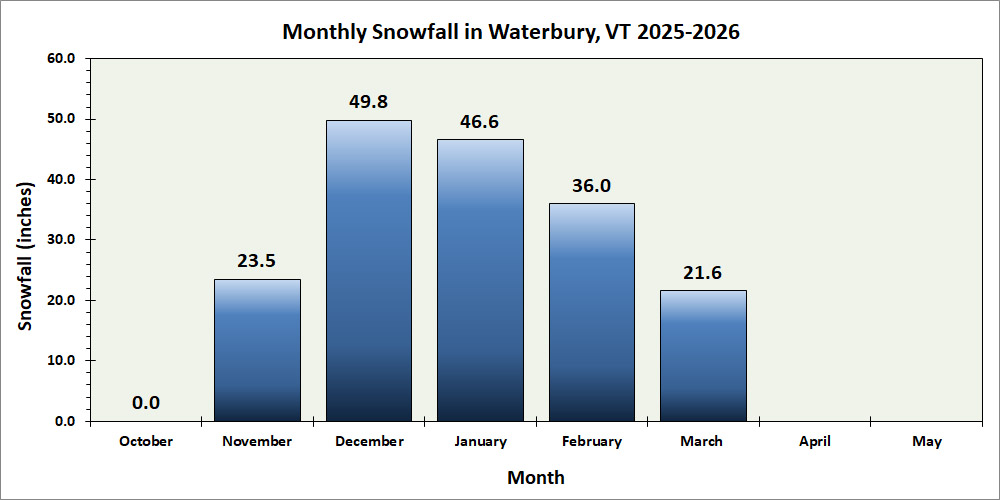
March is complete, so I’ll pass along an update on seasonal snowfall progress here at our site in Waterbury. The updated seasonal snowfall progression plot is below, and this season (shown in the red line) is now just barely hanging on at the bottom of the pack of similar seasons. It’s quite obvious from the plot that this season is still well above average with respect to snowfall, but below average snowfall for the past couple of months has certainly cut into this season’s position among some of our top seasons. This March certainly showed the weather dichotomy that the month can bring, and there were some interesting aspects with respect to snowfall. The updated storm list below is a good way to see the different periods within the month, with the first week continuing the wintry regime from February, and then the second week bringing in a warm, springlike period. After that though, we moved into a somewhat tempered, late-season bread and butter pattern with a good sequence of storms. You can see this starting on the 11th, and system after system pushed through the area to bring 11 additional storms. That pattern persisted almost to the end of the month, when temperatures warmed up a bit once again. The number of storms was well above the monthly average of roughly 8 to 9 storms, and in fact, March 2026 now holds the record for the most March storms in my database with 13, beating out March 2019, which had 11 storms. That record is a testament to just how active and snowy the month was once we were beyond that early week of spring-like warmth. But even with 20+ inches of snow, the month was still about 10 inches below average on snowfall. So we had a lot of storms, but they were all small to moderate snowstorms, and the month can often have some very significant events, and that’s why the snowfall average is up around 30 inches. On a seasonal note, it’s been consistently strong with respect to the number of winter storms – we’d already had 62 accumulating storms through the end of March, and we’re onto number 63 with some accumulation from the front end of the current system (Winter Storm Joseline). The highest number of accumulating storms I’ve ever recorded here in a season is 64 in 2018-2019, and that number is certainly within reach with all of April and May still to go. Below I’ve updated the statistical projections for where this season’s snowfall might end up. It’s really looking like something in the 180-190” range if snowfall progresses at an average pace from here on out; getting to 200” would take a hefty event or two and is very unlikely. But there’s still a couple of months to go in the snow season, and a good April can bring 20”+ of snow, so we’ll see what Mother Nature does. It looks like we do have another snowy period coming up from Sunday night onward, which I’ll touch on below. ≥150”: 100.0% ≥160”: 100.0% ≥170”: 100.0% ≥180”: 82.6% ≥190”: 18.1% ≥200”: 0.3% This season’s snowfall started out at a good pace – with three months of above average snowfall and 120” by midseason. None of those early winter months were actually outrageously far above average, but stacking a solid November, December, and January together with lots of storms and minimal warm periods is going to make an impression. The valley, and especially the mountain snowpack had a solid start, and that set up a fantastic base moving forward in the ski season. In the monthly snowfall plot below though, you can see how the snowfall pace fell off in February and March, which were both below average. I did a quick check on where the Vermont ski areas stand for season snowfall thus far, and the north to south listing of totals is below. The resorts along the spine of the Northern Greens are right around that 300” mark, which is probably around average, and I think Bolton Valley only has a week or two left before their planned closing. Hitting 300” is certainly the sign of a decent/average season in the Northern Greens, but those are typical numbers and they’re not going to be a huge story. Jay Peak is somewhat ahead of average and approaching 400”, which is a bit more notable, but they just hit 475” last season and are probably in that 400” range in about a third of their seasons. So, their snowfall number is good, but not groundbreaking. It’s when they pass 500” up there that you know it’s one of those very special winter/ski seasons. Jay Peak: 397” Burke: 169” Smuggler’s Notch: 301” Stowe: 294” Bolton Valley: 297” Mad River Glen: 192” Sugarbush: 222” Pico: 190” Killington: 190” Okemo: 126” Bromley: 178” Magic Mountain: 112” Stratton: 153” Mount Snow: 128” On average, the snow on our property here typically runs out in mid-April, and we seem to be on track for something average like that with a colder stretch coming up. There’s nothing too substantial expected at this point with respect to big events, but the BTV NWS is starting to discuss the period: Area Forecast Discussion National Weather Service Burlington VT 733 AM EDT Thu Apr 2, 2026 KEY MESSAGE 3: An upper level trough along with several lobes of embedded shortwave energy will bring upslope snow showers to our area from Sunday night through Tuesday. Cold air will sink down over the north country from Canada during this timeframe, and cooler than normal temperatures will remain through Wednesday night.

-
When I left the mountain around midday yesterday, it was a bit tough to pull myself away because the ski conditions were really good both on and off piste. The Vista Peak terrain was skiing on 10-12” of dense powder that provided a solid resurfacing of even steep pitches, and all the way down to 1,500’ at the Timberline Base there was at least 9-10” of that snow with a lot of liquid equivalent in it. The precipitation at that point was snow that was a mixture of both regular flakes and more granular types, and it frequently switched back and forth favoring one over the other. As the day wore on and moved into the evening, precipitation at our place in the valley gradually transitioned to more mixed precipitation, but I wasn’t sure what had gone on up at Bolton Valley – it was possible that the mixed precipitation was minor, leaving just a skim atop the new snow, or it might have been a lot more substantial. I decided to head up for some turns today to find out where conditions stood, and without the Vista Quad, the Timberline Quad, or the Wilderness Chair in operation, I decided to do some touring. I had though about hitting the Nordic and Backcountry Network, but I decided that touring via the Wilderness Uphill Route was a better option – if the off piste and ungroomed snow was in bad shape I could catch a run down some groomed terrain instead. Well, I’m glad I gave myself the option of a groomed descent, because anything terrain had not been groomed was essentially unskiable. The combination of dense snow granules, sleet, freezing drizzle, rime, and whatever else had fallen, hadn’t left just a thin crust atop the snowpack, it was a substantial crust. I checked in various spots on my tour, and the crust was typically about a half inch thick, with probably close to a half inch of liquid equivalent in it. Thankfully, the groomed terrain was in excellent shape, since once that crust was pulverized into the rest of the new snow, it made a substantial covering of the old snowpack. I descended on groomed terrain via the Wilderness Liftline and Lower Fanny Hill, and that was really nice. In terms of the off piste skiing, it’s not going to be good again unless you hit an area that has been broken up by previous skiers. The snow below the crust is excellent, but you’ve got to break up the crust to get to it. Other than that, it will need to either need to warm up or we’ll have to get another resurfacing storm cycle before it will be fun to get back off piste again. Until that point, at least the groomed slopes are in great shape because of the resurfacing we’ve gone through. In the valley I’ve recorded 1.05” of new liquid equivalent in the snows from the past couple of systems, so the mountains must be up there around 1.5” of liquid or even more. As a testament to that, the snow depth at the Mt. Mansfield Stake has jumped a foot over the course of the past few days, so these recent March storms have been an excellent addition to the snowpack as we head toward spring.

-
Our next winter system in the current series moved into the area overnight, and by early this morning we’d picked up another couple of inches of snow in the valley. The mountains had picked up a few inches of new snow as well, and since it was expected to continue throughout the day, I was a bit torn on whether to head right up for a ski session in the morning or wait for later in the day when there might be more accumulation. I decided that early morning was the better option, and I’d say that was probably the right call because we started to get into more mixed precipitation as we approached midday. For convenience, I parked at the Timberline Base, but my real goal for the morning was to head right over to the Vista Quad and get up to the Vista Summit – the Vista Quad hasn’t really run since Thursday due to wind/mechanical issues. That meant that all the snow from these recent systems has been siting there without any skier traffic. Based on yesterday’s conditions, I brought out the alpine boards today; I wanted the extra stability to easily handle that hard layer of subsurface snow where the new snow hadn’t bonded well, or, if it turned out that there was enough new snow to start diving into the really steep terrain, I’d want to have the alpine boards for those adventures anyway. Thankfully, the latter of those two situations applied, and it was game on for a lot of very steep terrain. With the fresh opening today of the Vista Quad, the Vista Summit was definitely the place to be – my measurements typically revealed 10-12” of dense powder anywhere that hadn't seen skier traffic. Down in the valley we’ve had over an inch of liquid equivalent in the snow we’ve seen from these past couple of systems, so the mountains must be in the range of at least 1 to 1½ inches of liquid at this point, and that’s generally enough to get into resurfacing high-angle terrain. The snow that’s out there is dense and surfy, and I was typically getting bottomless powder turns on both single black and double black pitches like those in the Hard Luck, Vermont 200, and TNT area. The caveat to that was that vegetation mattered – in the trees, and especially evergreen areas, enough of the new snow was captured on branches that the lower depths on the ground were obvious. The open trails were the place to be, since all that new dense powder was just sitting there. When I was wrapping up my session and heading back to Timberline, the conditions were so good even in the lower elevations that I hung around there for a couple of extra runs. Even below 2,000’ I was finding 9-10” of that same dense powder in areas that had not yet seen any skier traffic. A testament to just how good all this dense snow has been with respect to resurfacing slopes is that fact that patrol was reopening trails all over the place on Timberline – even the steepest pitches like the Tattle Tale Headwall were skiing well. Like yesterday, groomed terrain was skiing very well with over an inch of new liquid equivalent tilled in because of the new snow. The weather today wasn’t quite as friendly as it was yesterday; today there were some periods of wind, and at times heavy snowfall and blowing snow. The early morning snowfall was generally regular flakes, but those became mixed with grainy flakes as the morning wore on, so your goggles were definitely needed. As PF mentioned, there was also a bit of freezing mist at times, so you had to keep that from obscuring your goggles. Relatively speaking, the freezing mist wasn’t too heavy though, and I only cleaned it off my goggles once when I stopped in at the Timberline Base for a late morning break. None of the precipitation seemed to hamper the snow surfaces, and thankfully the dense snow and grainy flakes only continued to help deepen the powder. In term of visitors, it was a surprisingly quite day on the mountain for a weekend storm day (not to mention the fresh opening of the Vista Quad). Perhaps the questionable weather kept a lot of people away. All the lifts were basically walk on, and it was especially quiet at Timberline – there were often several empty chairs between people when I was there around midday. That could be a bit of the late March slowdown taking place as people start to get busy with other things, but as I’ve often seen this season, there were a good number of Indy Pass holders making use of their two free days at Bolton Valley. That’s probably a good way to manage your passes though: use March and April to hit up some of those northern resorts that are still getting good snowstorms.


-
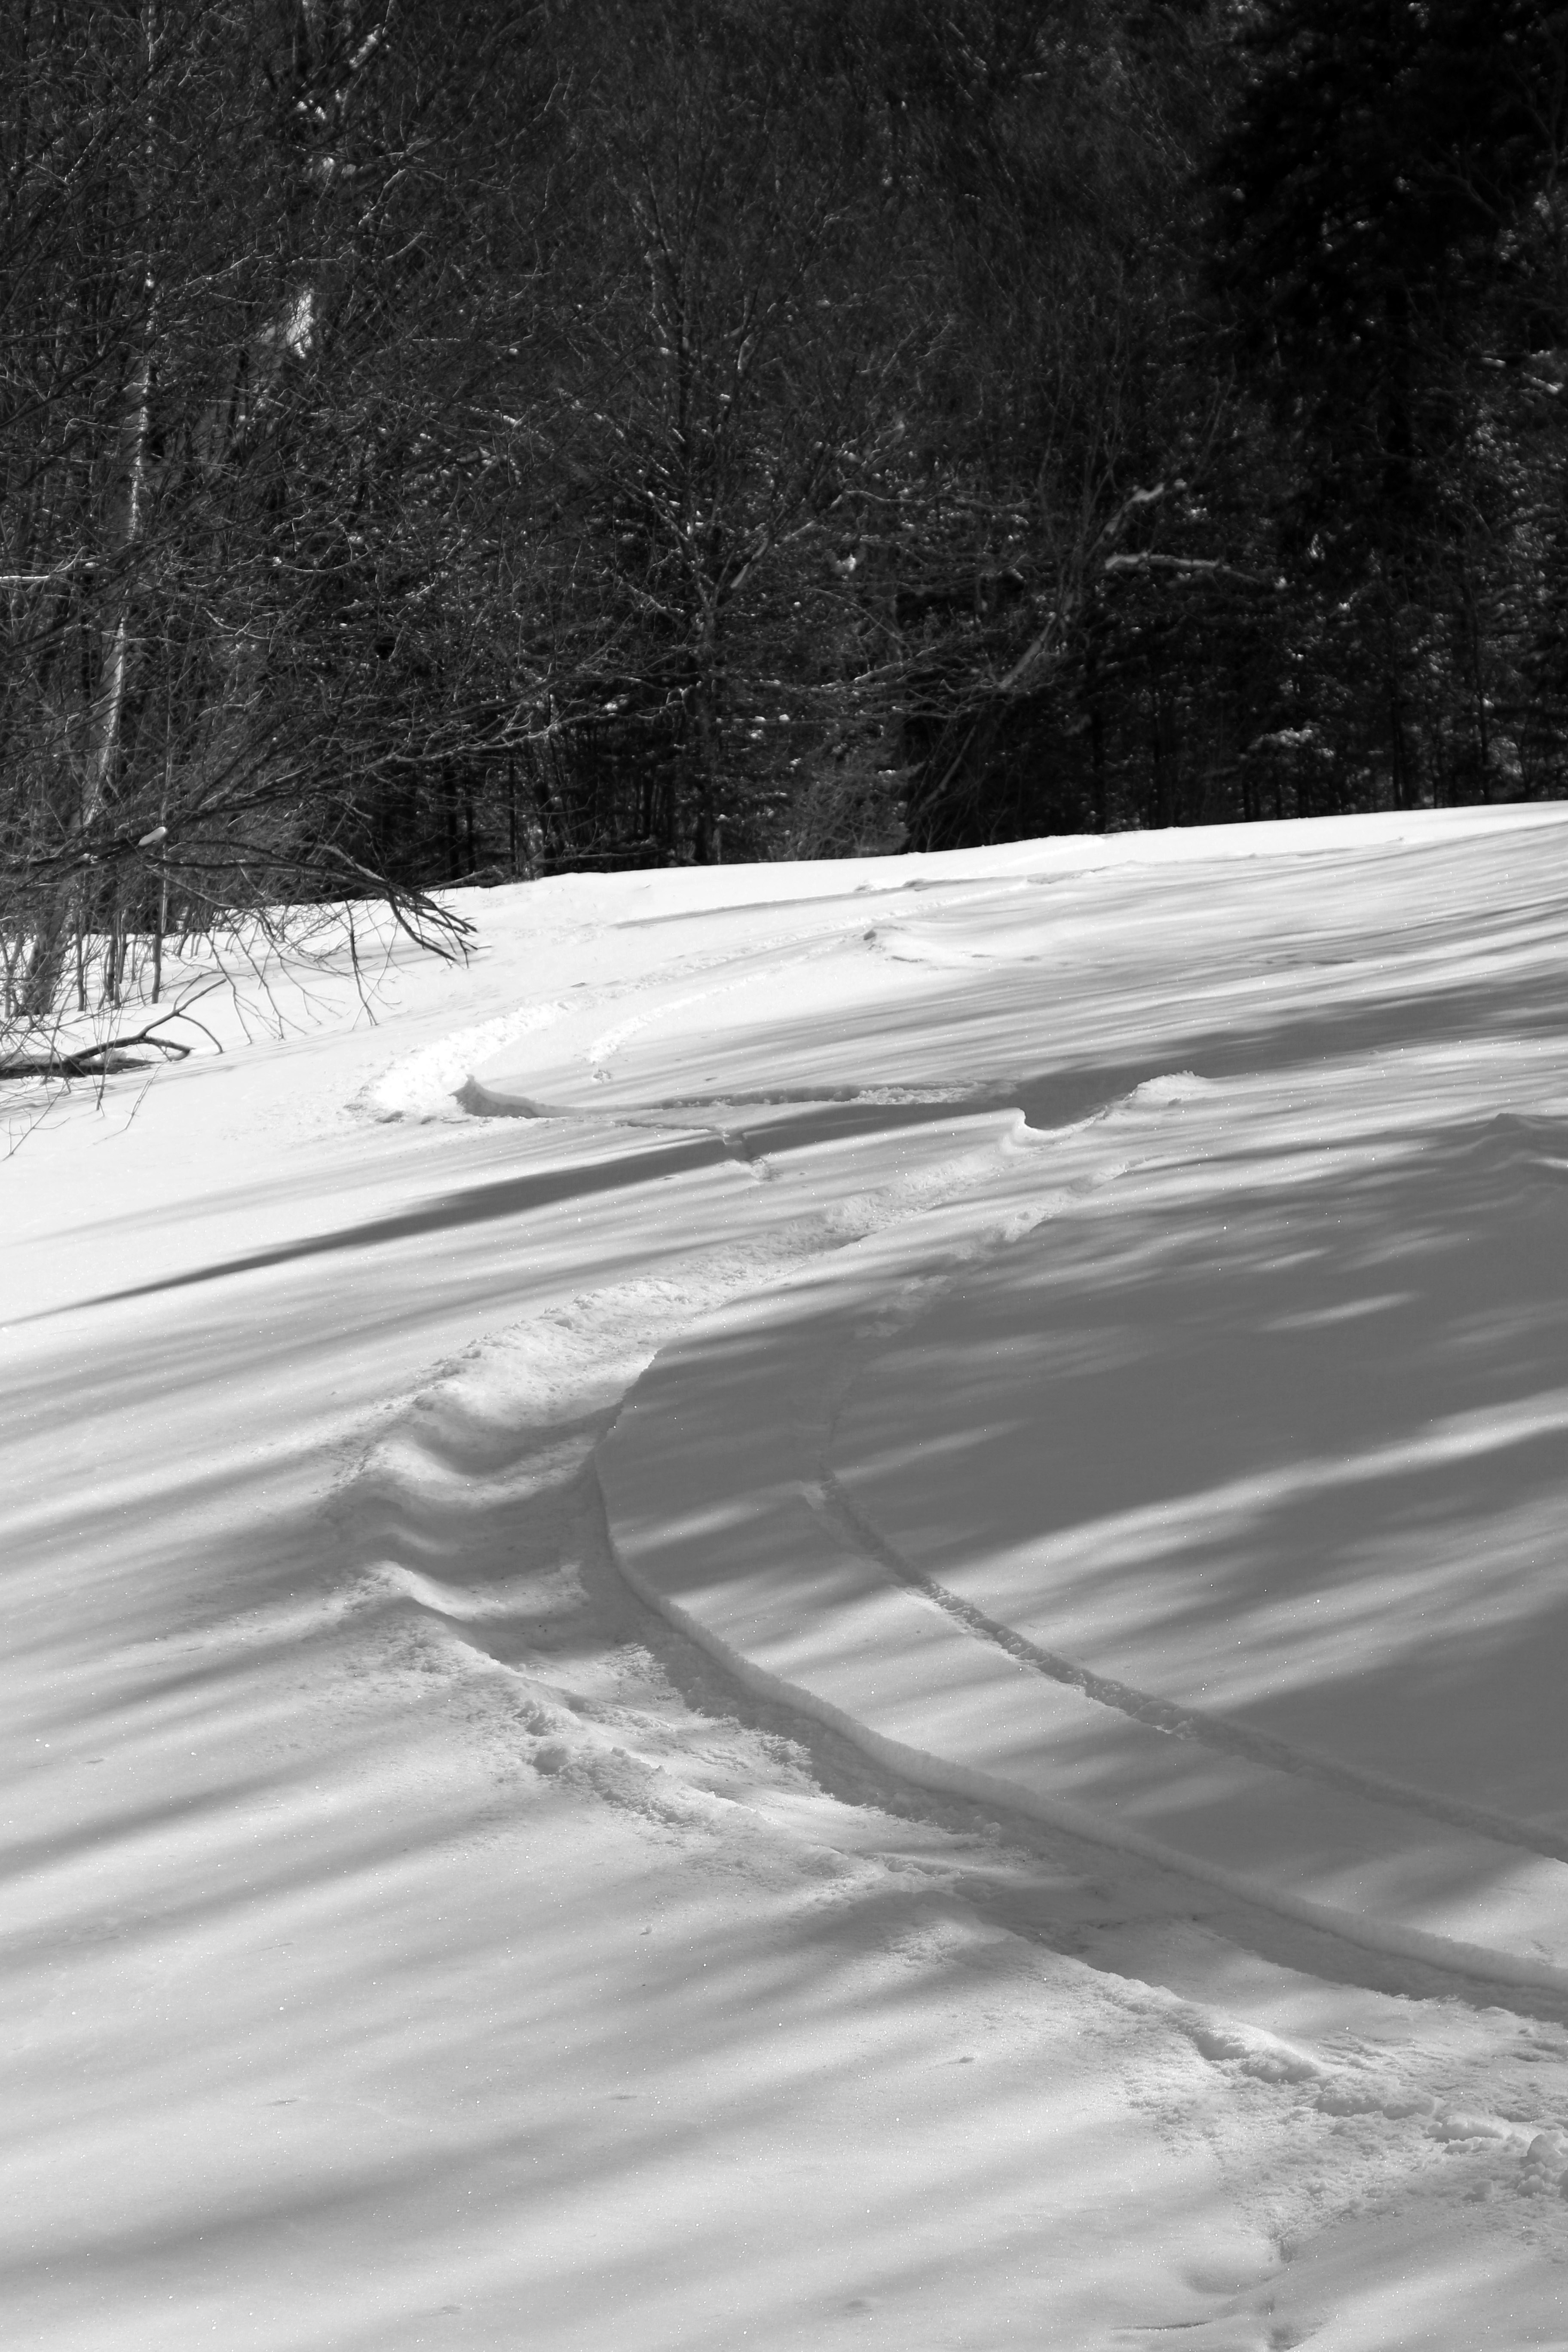
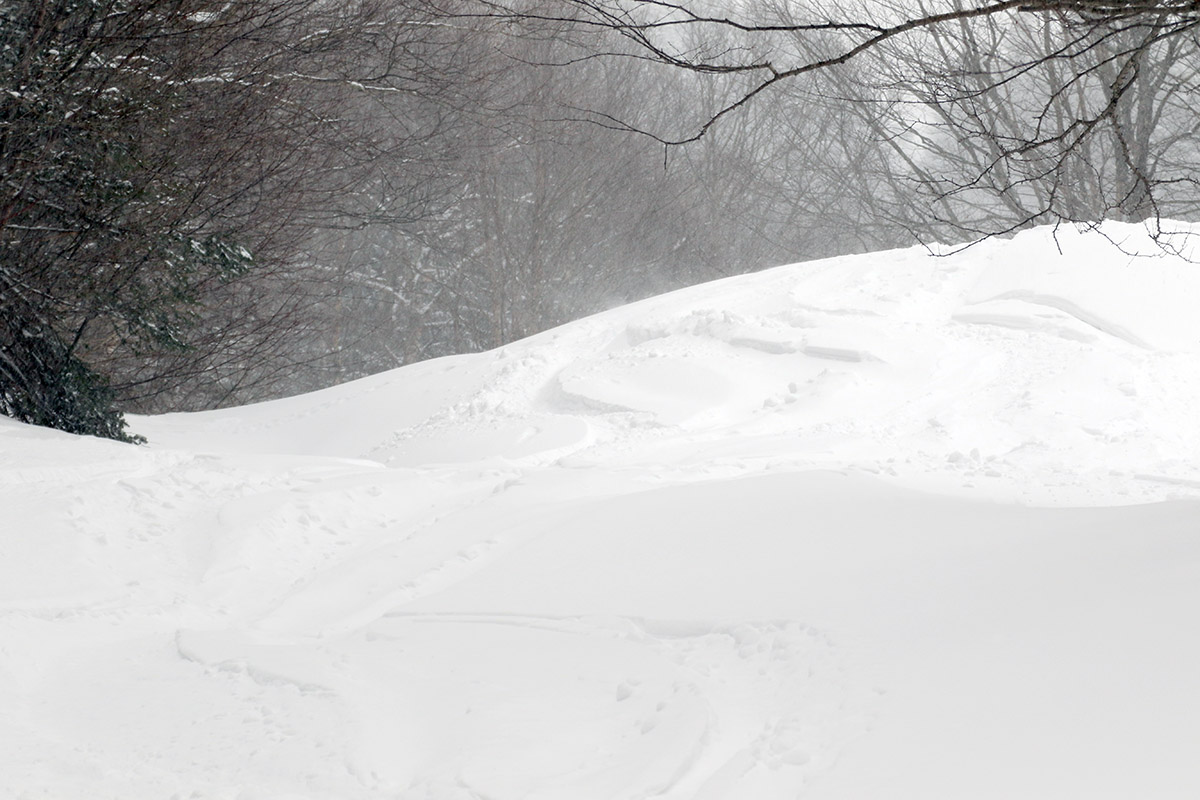
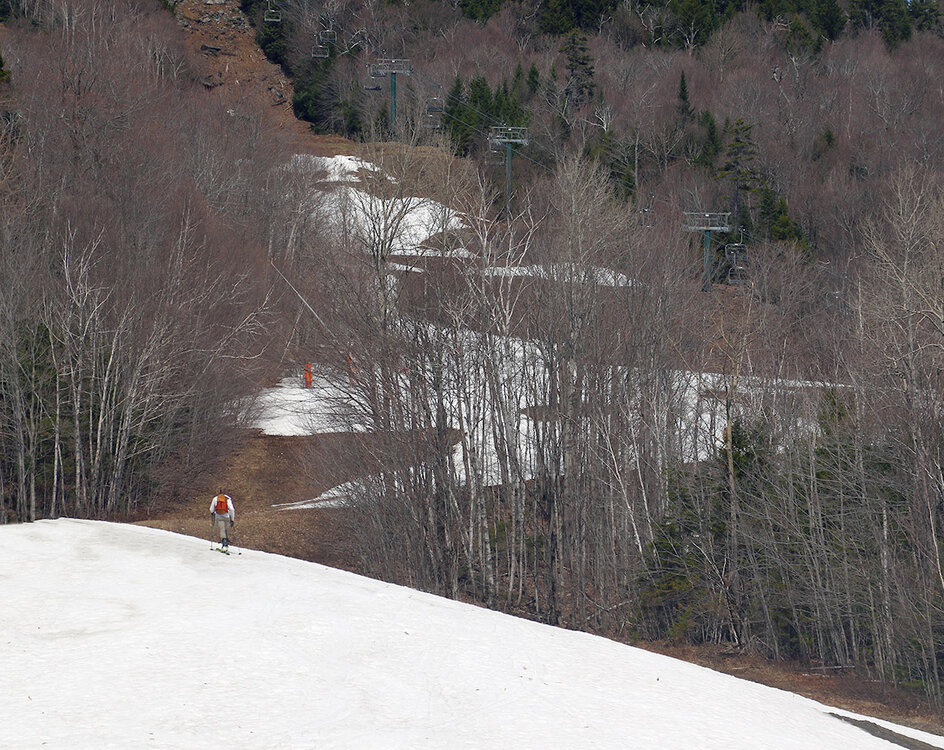
Thanks for the Mansfield snowpack updates PF – very informative and useful. Your last image in the series, which I copied above, is a great example of what I wrote about in my Bolton Valley report from yesterday. In your shot, you can see some spots where there are snow bridges across the gully, which are very easy to cross on skis. In contrast, if you run up against one of those sheer faces with multiple feet of snowpack like you see at the very front of your image, it’s a logistical nightmare to try to get across – both getting down into the gully and then trying to get back up out of would be incredibly difficult with a lot of wasted energy.
-
We are now a couple of storms deep into our current March series of what the weather modeling suggests will be about a half dozen systems. The resorts of the Northern Greens are generally reporting 6-12” of accumulation from the first couple of events, with the one that moved into the area yesterday being the most vigorous. Snowfall yesterday afternoon was in the 1-2”/hr. range even in the valleys, and for those out on the roads, driving was very difficult due to both the accumulations and the limited visibility in the intense snowfall. As of this morning, Bolton Valley was reporting 7 inches of new snow from the most recent storm, so I headed up to the hill for some turns. It was a beautiful late winter day out there at the resort, with temperatures in the 20s F, a mix of clouds and some sun, and occasional flurries as well. Compared to last weekend, the number of visitors wasn’t quite as high, since there weren’t as may events taking place at the resort; I arrived around opening time and parked in the upper backcountry lot, which was about half filled at that point. I started the first half of the morning with a lift-served ski session, and up at the main mountain neither the Vista Quad nor the Wilderness Double were running due to planned closures and mechanical work. I did take a couple of quick runs off the Mid Mountain Chair and the Snowflake Chair to get a feel for the snow. My snow analyses from the valley indicated that the storm had left about a half inch of liquid equivalent in the area, so it had the potential to be a moderate resurfacing of the slopes. Compared to what we picked up in the valley, the snow at elevation was notably drier, and it didn’t seem to bond as well to the subsurface as last weekend’s snow. At least up at Bolton’s elevations, it was cold throughout the storm, so there wasn’t any of that extra dense snow at the start to improve the interface with the old snow. Similar to last weekend, the storm made for a decent resurfacing of low and moderate-angle terrain, but it just didn’t hold up quite as well as last time. If you didn’t get first tracks, you were quickly down to the very firm subsurface, and the snow not bonding well meant that the skiing just wasn’t great with repeat traffic. Groomed surfaces were actually quite good though, so the snow being cold throughout the storm seemed to set it up for being tilled into the base extremely well. I ventured over to Timberline after those fist couple of runs, and that was definitely the place to be. Skier traffic was lighter and with the Timberline Quad in operation, there was just so much more terrain open that fresh tracks were plentiful. There was still the issue of the quality dropping off quickly on tracked terrain, but with the relatively low skier density, that took a while. I skied at Timberline until about midmorning when it became harder to find untracked snow on piste, and then I headed back to the main mountain for a tour on the Nordic and Backcountry Network. I spent the rest of the morning ski touring, and my route was in the 2,000 – 2,800’ elevation range from the lower Village area up past Bryant Cabin. There were a couple of water bars near the bottom of the Bryant Trail that had been blown out during last week’s thaw, but people have made bypass routes to quickly get around them. Even though the water bars have been filled in somewhat with new snow, with vertical gouges cut into 5 to 6 feet of snowpack, the physical dimension of the trenches make it just too awkward to try to climb down into them and then climb back out the other side. At least as of this morning, skier traffic on the Nordic and Backcountry Network had been very low, so you had access to untracked lines just about anywhere you went. To that point, I was breaking trail this morning as the first one out onto North Slope, so everything out past there was untracked. The powder skiing was great on low and moderate angle terrain. As PF mentioned, there wasn’t much elevation dependence with respect to new snow accumulations. I did find the very best depths with 7 to 8 inches of fresh powder up around 2,800’ above Bryant Cabin, but even down at the lower elevations of Timberline around 1,500’ there was a good 6 inches of new snow, and it was slightly denser so it may have had just about the same amount of liquid in it. All morning, people I talked to at the resort spoke about this next storm coming into the area tonight as being even bigger, so at least that’s the perception that the general skiing public seems to have. Some of the models do have twice as much liquid forecast for this next system, and there are projected accumulations through Monday morning to match, so we’ll see how this next one plays out.
-
I hadn’t really noticed it until I was watching TWC this morning and saw their model blend for the upcoming days, but it looks like there’s a bit of a bread and butter pattern setting up for the coming week, with 3 potential winter systems through the weekend, and 4 over the course of the next week. Modeling shows a system tomorrow night, one Friday night, another Sunday into Monday, and then another on Wednesday. Nothing jumps out immediately as having the potential of the one we had over the weekend, but the recent GFS depictions of the Sunday/Monday system would certainly be in that ballpark. None of the other models really have that setup, and temperatures would potentially be an issue depending on the track, but the GFS is typically pretty good with these patterns, so it’s certainly something to watch. The BTV NWS forecast discussion doesn’t highlight anything too notable at this point, and they mention the potential for warmer temperatures, but they definitely talk about the pattern setting up. We haven’t really seen a Northern Greens bread and butter pattern in a few weeks, so it’s good to see a possible return. It’s definitely worth watching to see if any of the systems or the cumulative accumulations set up any decent or partial resurfacing for the slopes like we saw this past Sunday. Area Forecast Discussion National Weather Service Burlington VT 706 AM EDT Wed Mar 18, 2026 A series of fast moving systems are favored Saturday into Sunday and again later next week as mid/upper level flow goes more near zonal in the base of a long wave trough.

-
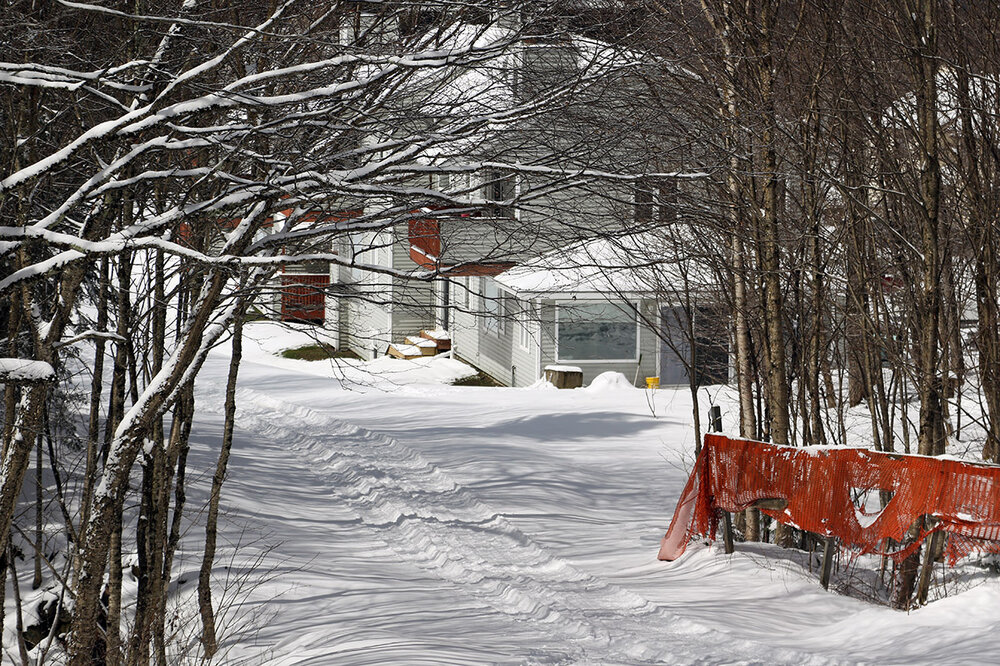
It was a relatively slow second week of March for snowfall here in the Northern Greens – our last winter storm finished up on the 4th, and then we had multiple days of springtime warmth. That warm stretch brought some fun spring skiing, but by midweek, cooler weather had returned and we were back into wintry storms. Our most recent storm began yesterday, and while the lower valleys received snow with minimal accumulation, the mountain valleys and especially the mountains themselves stacked up several inches or more. After a modest start in the morning, the upslope snow kicked in for the afternoon into the evening and pounded the mountains. The snowfall was so intense that the road crews couldn’t keep up with it on the Bolton Valley Access Road, which had to be closed for a time to clear out cars that were stuck. Out of caution, the resort even closed its lifts during that period, since emergency vehicles wouldn’t have been able to get up to the resort if they’d been needed. We weren’t skiing yesterday, but Bolton’s snow report updates told the story, and it sounded like quite a challenge for resort operations. Ultimately, accumulations topped out around a foot along with spine, so it was just another example of what often happens when one of those minor clipper systems runs into the Northern Greens: 3:30 PM UPDATE: The good news is that it's nuking up here, the bad news is that Vista will be closed for the evening due to winds. Mid-Mountain, Mighty Mite, and Snowflake will run as scheduled. With all of the snow coming down hard and fast, please use extreme caution when traveling on the Access Road. Winter tires and four wheel drive is highly encouraged at this time. 4:15 PM UPDATE: The Access Road is currently closed to both uphill and downhill traffic. We're working to clear cars off of the road and then will have to wait for plow trucks to make their rounds. We'll keep you updated as soon as something changes. 4:45 PM UPDATE: The state police and plow trucks are currently working to untangle the Access Road below Timberline. We are making the call to temporarily close ALL LIFTS while the Access Road is closed due to it being inaccessible for emergency vehicles to reach the resort if needed. Stay tuned for updates, and thank you to our local officials, Bolton township, and Bolton team for working hard to get things moving again. 5:30 PM UPDATE: Traffic is now gradually moving on the Access Road. It's not completely clear just yet, but the teams are getting close. We will resume lift operations. Please continue to use caution when traveling. If any skier and rider needs to get back to Timberline but does not have a night ticket, our lift ops team will gladly let you on the lift to get back to Timberline while it's still light out. The storm wound down overnight, so my older son joined my wife and I today for a Bolton session to check out the new snow. I was surprised to see the Bolton Valley snow report only indicating 7 inches of new snow when we’d picked up 6 to 7 inches from the system down in the valley, but I’d say that report was on the conservative side – we did find some spots with only 7 inches, but even after overnight settling, depths of 8 to 10 inches seemed more common. In the valley at our site, the new snow contained close to a third of an inch of liquid equivalent, so I’m guessing the mountain picked up probably a half inch of liquid. It certainly wasn’t a full resurfacing storm, but it did reset the low-angle terrain and a decent percentage of the mid-angle terrain to bottomless or nearly bottomless turns. The average density of the powder down at our place in the valley was 4-5% H2O, but the settled powder we found out there today was still dense enough to slow you down somewhat in the lowest angle areas. The trick to dialing in some of the best powder turns today was finding that sweet spot of terrain pitch that was steep enough to give you good momentum in the available powder yet keep the turns mostly bottomless. We had a lot of fun using our knowledge of the mountain and seeking out those untracked areas with the right pitches to yield some excellent turns. On that note, temperatures in the 20s F today and minimal wind made it that much better. We were glad we started up right when the lifts were opening though, because even at that point it was clear that it was going to be a busy day at the resort – we were already parking in the 4th tier of the main Village lots right around opening bell. It was a big event day for the resort though, with the 5th Annual Blauvelt’s Banks competition taking place at Timberline, and some slalom racing and other events taking place at the main base. When we were leaving around midday, it looked like both the Timberline and main Village lots were basically full.