

jpeters3
-
Posts
736 -
Joined
-
Last visited
Content Type
Profiles
Blogs
Forums
American Weather
Media Demo
Store
Gallery
Posts posted by jpeters3
-
-
2 minutes ago, ingyball said:
Atlanta and the western parts of Georgia are under the 10% hatched, perhaps it may be a tad overboard, but they're very much on the eastern edge of the tornado threat for right now.
The 12 UTC 3km NAM sends an UH track right over downtown ATL...
-
 2
2
-
-
Good call on the Mod risk, IMO.
-
1
-
-
5 minutes ago, ILMRoss said:
We really don’t know if the high ceiling will be realized until this time tomorrow. Every CAM has a different technique on how they render boundary layer mixing, which dictates how warm it gets at the surface. 3km NAM still displays a “mild” solution, in this case meh surface temperatures never get past the mid 70s and rising parcels don’t really have a ton of difference between their temp and the background temp until they rise to about 700 MB, according to this sounding I pulled. If the 3km is right, expect to see a lot of shallow, ‘baby’ supercells that struggle to stay alive amongst the strong low level shear. This solution would keep the SPC from slapping a high risk onto things.
Once again, all about boundary layer with this limiter, and other models (looking at you HRRR) will scare a lot of people because they have a tendency to overdue temps and therefore, CAPE.
I would be cautious in interpreting these soundings from tropical tidbits. Strictly speaking, one should compare the virtual temperature of a lifted parcel to the virtual temperature of the background environment to assess lifted parcel buoyancy and CAPE, but their soundings use actual temperature. So this plot is misleading - the dashed line is probably a bit more to the right than indicated on here. Note that there is no MLCIN. This is actually a pretty good looking thermodynamic profile.
Attached is a similar sounding from the same approximate location and time, plotted correctly from dupage. You can see that there is actually quite a bit of low-level buoyancy for a lifted parcel.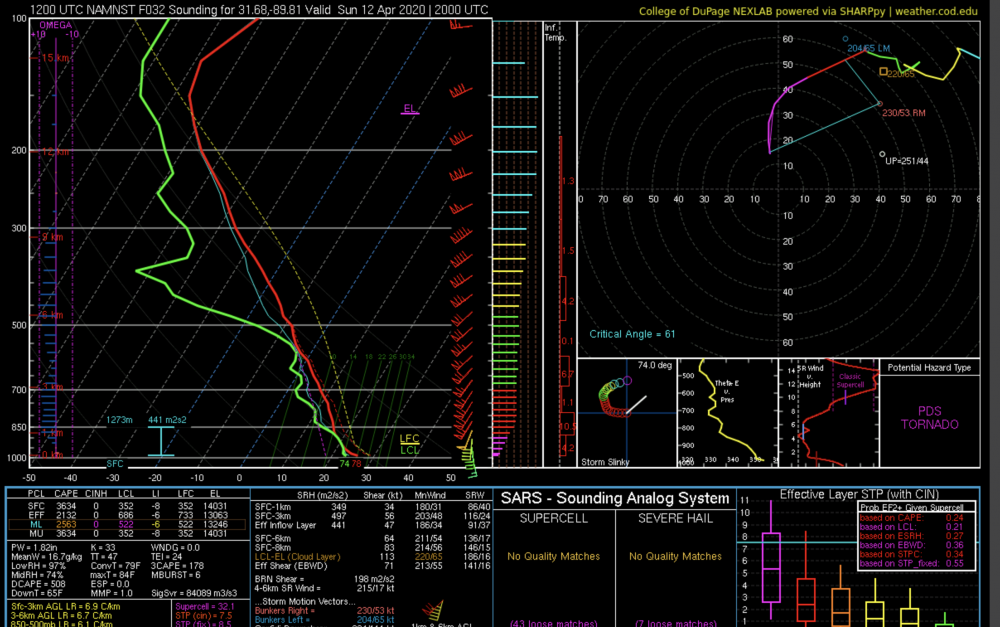
-
2
-
-
Just now, Wmsptwx said:
Looking like we stay moderate until tomorrow and then wait and see if upgrade is needed depending on real time conditions tomorrow.
This seems like the responsible decision given the lingering uncertainty.
-
3 minutes ago, SnowGoose69 said:
The overnight threat I think may be getting missed somewhat. For AL in particular but I think even GA might see a violent squall line overnight. I don’t see much argument for this weakening as it crosses through. Especially since it appears GA could break out into sun for awhile Sunday afternoon which could destabilize things further
Depending on where you pick a sounding overnight in AL, the environment is going to be on the borderline of being supportive for violent tornadoes. There is the issue of lacking buoyancy below 3 km, but relatively off-the-chart wind profiles. It's also a bit hard to interpret whether the 3 km NAM is depicting supercells, or junkvection with embedded spin-ups. But I agree, AL is certainly in play in the late evening/overnight, along with central TN.
-
16 minutes ago, 1900hurricane said:
At the risk of sounding like a total nutjob, what if the very high 0-1 km SRH in the lesser outcome models is a sign of a poorly mixed boundary layer where the surface remains largely uncoupled from the low level jet? It seems counterintuitive, but if the low level jet and surface aren't coupled, surface winds would be lower and 0-1 km SRH would increase. The ARW/NSSL WRFs from 00Z all show low level winds closer in vector to the low level jet than the 3km NAM and NMMB of the same suite, which have weaker winds with a stronger easterly component. That however leaves the question of why the boundary layer wouldn't be mixing. Maybe low level lapse rates have something to do with it. It's a highly anecdotal case, but January 10th, 2020 was a day that had a very strong low level jet, massive 0-1 km SRH, enough instability at face value, but poor low level lapse rates across Texas (sounding below). Storms were largely elevated and messy that day. Again, highly anecdotal and far from anything scientifically sound, but maybe something to watch.


I don't think you are a nutjob at all. This is quite possibly an explanation for the different solutions.
-
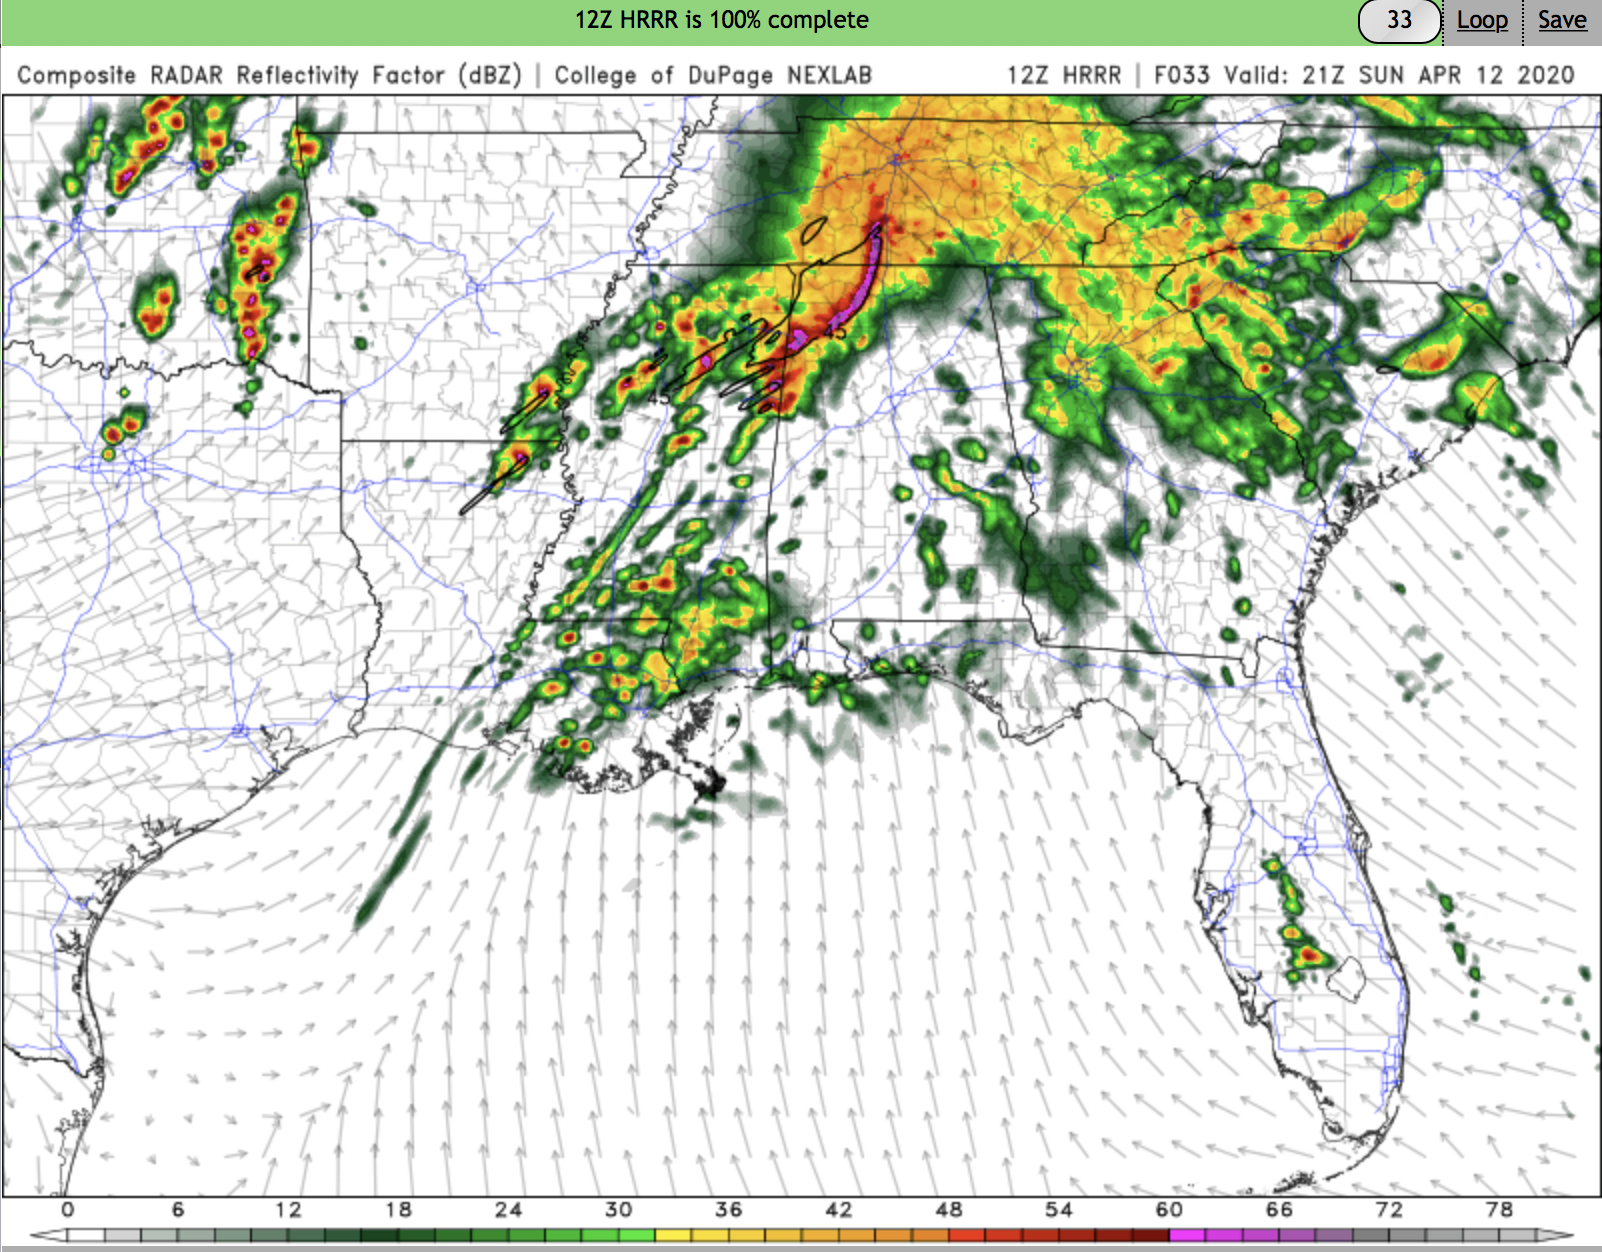
Another CAM solution to add to the mix. HRRR seems to air more toward the "outbreak" end of the spectrum by 2100 UTC, with numerous apparently discrete supercells developing over northern LA, MS, and SE AR in the high-parameter part of the warm sector.
Edit: The end of the run is still sort of a mixed bag. Somewhere between the higher end and lower end solutions. Probably a regional outbreak with a few strong tornadoes.
-
1
-
-
2 minutes ago, DanLarsen34 said:
I think you’re right. Let’s just hope we don’t have to deal with this affecting people’s lives either way.
Yeah. A tornado outbreak on top of a pandemic starts to sound like a SCI-FI channel mini-series plotline...
-
6
-
-
7 minutes ago, DanLarsen34 said:
This is a tough call, but avoiding large groups in shelters which will almost certainly lead to additional covid infections in favor of a probably comparatively statistically unlikely outcome of a tornado hitting a given location seems like a good tradeoff to me.
-
1
-
-
Just now, jjwxman said:
I believe the algorithms used to determine the STP are different among different model websites. Pivotal weather in my opinion has a more realistic outcome with STP in the 5-7 range (which is still really significant) across MS/AL/S TN. Other pages such as COD Meteorology and WeatherBell have the STP in the 12-15 range which is just off the charts, but maybe a bit misleading as well?
Pretty much all the available sites do not plot maps of STP correctly. Most show fixed layer STP, when they should really show effective layer STP. I've also noticed large discrepancies between what is shown in SHARPpy soundings and what is shown on the map. I trust the soundings more-so than the maps, and maximum values i've seen are in the 6-9 range.
-
1
-
-
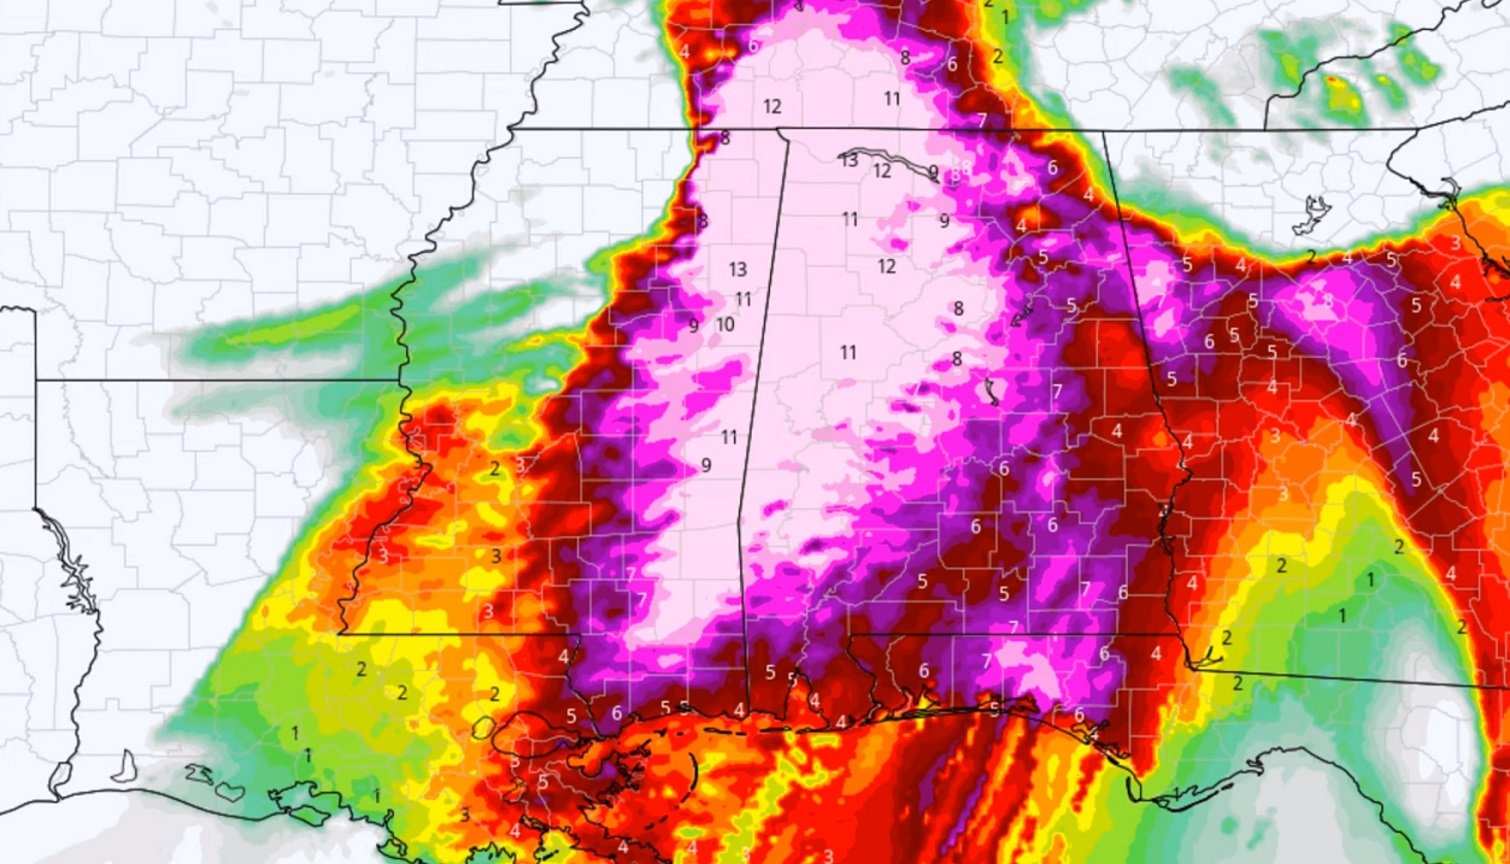
38 minutes ago, sakau2007 said:
My overall concern for this event continues to grow. I know the parameters aren't exactly the same, but this is as close to April 27, 2011 as I've seen since April 27, 2011 for MS/AL.
Just look at these STP values and tell me that doesn't bring back memories. Makes me shudder:

I get not wanting to be hyperbolic, but at this point emphatically saying this won't be like April 27, 2011 seems to be borderline irresponsible, no? And let's not forget this event looks like there will be prior convection. Some of the radar loops look eerily similar to me showing earlier rounds of convection that we aren't overly concerned about followed by outrageously high STP's later in the day. That is.... exactly what we were staring at on April 27 and the result was absolutely disastrous. The early morning event across Alabama was absolutely underwarned for until the event was occurring. I don't think the atmospheric paramaters were expected to be off the charts that morning (just as they aren't this time around) yet there were still dozens of tornadoes and a vicious line of storms. What is the risk something like that, even on a smaller scale, occurs? I haven't really heard that mentioned at all.
I think the point is that the chances of a repeat of April 27, 2011 are very small. Events like this are more than just parameters. There are a lot of things that need to come together to cause an outbreak like April 27. Miss one piece of the puzzle, and you can end up with a marginal event at best despite off-the-charts parameters (5-20 is a classic example of this, but there have been several over the past few years). And there are already indications that some of those things won't come together this time (questions about storm mode, etc). So if we "sound the alarm" and tell people this will be comparable to April 27, 2011, when in reality the probability of this happening is extremely low, we lose credibility as forecasters. I would put the chances of something comparable to that day at 5%, at best. Especially given that parameters look to be a tad smaller than 4-27 among the consensus of guidance on top of all the uncertainties.
-
3
-
-
7 hours ago, jojo762 said:
00z CAMs were a mixed bag of results... Here is a run down, with some of my own thoughts on what each solution would result in.
HRW WRF-NSSL
Storms fire early in Eastern Texas, partially associated with a long-lived complex, they continue east-northeastward over the threat are with a mixed bag of storm modes, numerous UH tracks associated with this initially activity as it traverses Louisiana and Mississippi. Numerous other supercells fire in the main threat area. This solution likely yields a tornado outbreak of some extent.
HRW NMMB
Storms fire early in Eastern Texas, traverse Louisiana and into the main threat area... WAA activity explodes across the warm sector, still some hints of severe supercells embedded within this activity, but overall mutes most of the threat across Mississippi/Alabama... Meanwhile numerous discrete cells pop across Arkansas, possibly yielding a more localized tornado outbreak there. In relation to the WAA activity, from my own experience of using the NMMB, it does seem to frequently overconvect.
HRW WRF-ARW
Probably the scariest of the bunch... Storms fire early in Eastern Texas and remain mostly discrete/semi-discrete as they scream east-northeastward, numerous other discrete supercells fire in the open warm sector across large parts of Louisiana, Arkansas, Mississippi, and Alabama. This solution definitely produces a big-time tornado outbreak.
NAM NEST
Similar to every other solution, storms fire very early in the period over Eastern Texas and traverse Louisiana, essentially becoming a big blob by the time they reach Mississippi. Throughout the afternoon WAA convection is persistent across Mississippi and Alabama, with the chance for embedded supercells. By late afternoon several supercells are firing, embedded within clusters, in Arkansas with other cells trying to get going further down the front and in the open warm sector in Mississippi. Sunday night features what would likely be a dangerous QLCS over Tennessee. Unsure what this type of scenario would result in, but best guess is several tornadoes, and a ton of severe wind reports.
Imagine SPC will stick with a MDT risk for the 06z Day 2 SWO. 00z CAMs didn't do much to help squash the uncertainties that have been spoken about at length on twitter, this board, etc... If SPC takes credence in the idea of WAA convection persisting in the warm sector, we certainly will not get a high risk in a couple hours... If they do not put much faith in that solution, then we would probably see a high risk given the preponderance of evidence from every other model.
Good assessment of the different runs here. It's pretty frustrating to have such a mixed-bag of solutions at this point, especially when the global models are in good agreement!
Another interesting thing to note: the modeled depictions of the warm sector parameters are quite different among these runs. This is probably at least partially due to the different solutions for the distribution of convection through the warm sector, but I suspect something else is going on as well. The runs that are more geared toward a tornado outbreak actually have considerably less coverage of high 0-1 km SRH in the warm sector, even prior to widespread convective converge. Not sure why this is, or if it is even that important, but it is an interesting (and somewhat inexplicable difference).
-
Showing quite a bit of UH swaths over northern AL and into TN Sunday night though... Even if the daytime warm sector doesn't go of (and i'm not sold on that solution yet), it seems like there will be a substantial overnight event further east and north
-
NAM nest remains stubbornly devoid of convection through much of the warm sector. However, there do appear more discrete cells close to the triple point than in previous runs.
-
NAMcandy inbound
-
1
-
-
14 minutes ago, Bob's Burgers said:

Yikes!
-
FWIW, 18 UTC NAM nest is a similar story. Warm sector is devoid of convection closer to the cold front, and a bunch of junkvection further east....
Interested to see what CAMs do tomorrow.
-
3 minutes ago, Wmsptwx said:
As an amateur last two pages have been confusing a bit lol... is this trending toward less severe or more severe or stable. I see ingredients in place especially with low placement and strength and sheer but lapse rates are only average looking.
I would say the models have been trending toward a higher-end event over the last few days, in term of ingredients. The lapse rate issue was somewhat apparent in every model solution I've seen (though it seems ever so slightly less pronounced today). The NAM nest was a hiccup, but too early to throw in the towel.
18 UTC NAM coming in. Should we spar on this one????-
2
-
-
Just now, hlcater said:
its on Sharppy skew-ts. SPC meso has a 3CAPE/LLLR crossover plot thats really helpful too
Thanks. I never noticed it there.
-
2 minutes ago, hlcater said:
Anymore, I find myself using 0-3km MLCAPE as my instability parameter of choice over SBCAPE, particularly with regard to tornadoes. I've found SBCAPE is best used as a discriminator as to how robust an updraft may be but not how "good" that instability is for tornadoes. That definitely applies here I think and the fact numerous models are struggling to surpass 50 3CAPE is something I find tough to ignore.
Where do you look at 0-3km MLCAPE? There is a lot of recent research that supports the role of buoyancy in this layer in making/breaking tornado formation.
-
Just now, Indystorm said:
I am not criticizing. I am extending a compliment. Saying that I love the discussion is not meant in a sarcastic way.
I just re-read your original post, and I realize that it was complementary and I mistook it as criticism. My apologies. I will delete my offending posts.
I am cranky today, sorry. -
2 minutes ago, MUWX said:
Fair enough, but if we are only going to base forecasting off of things that have been scientifically proven, we aren't going to get super far. I think there is reason to potentially discount the NAM in the short term, based on what the Met who knows the model and the area has to say about it. Doesnt necessarily mean it is wrong, but until other models back it up, that gives me some reason to doubt it.
While I don't think it is wrong to doubt this solution (I have my doubts too), I don't think it is good practice to forecast based on dogma and scientifically unfounded principles.
-
Just now, MUWX said:
People trying to find every reason to talk down a risk.
You are right about this one, but that is not what is happening here. The first CAM we get gives us a solution that would certainly qualify as a "bust." I don't think this is reason to reduce day 3 to a "see text", but it would be asinine to simply discount this solution based on ill-founded scientific reasoning.
-
1 minute ago, MUWX said:
The opposite can also be true.
The opposite of what?
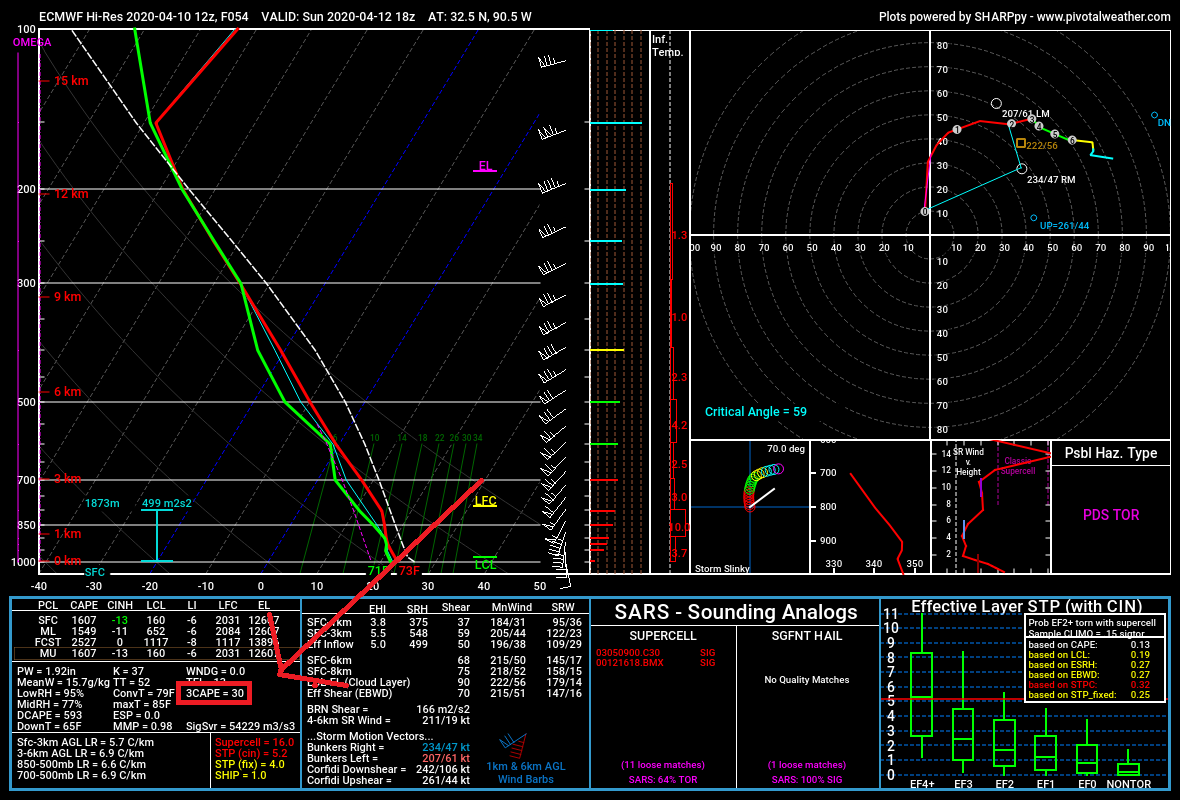
April 12 Severe Event
in Southeastern States
Posted
You don't have to patronize with statements like this. Obviously UH tracks are not a direct indicator of a tornado. UH tracks in an environment that can support tornadoes suggest the possibility. Take a look at the models before posting.
Below is a forecast sounding just west of ATL just before the UH track was produced. A low-shear very high CAPE type of scenario, but could certainly support a strong QLCS and/or embedded supercell related tornado threat.