donsutherland1
-
Posts
24,407 -
Joined
Content Type
Profiles
Blogs
Forums
American Weather
Media Demo
Store
Gallery
Everything posted by donsutherland1
-
Mid/late morning into early mid-afternoon may see some sun. Clouds should return afterward.
-
Periods of rain and drizzle are likely tomorrow and Tuesday. Highs tomorrow should be in the middle and upper 60s. Tuesday will be cooler with the temperature struggling to reach the lower 60s. Wednesday could temporarily dry out. Additional rain and showers are possible Thursday and Friday. Temperatures will remain unseasonably cool throughout the week with highs mainly in the lower 60s. The ENSO Region 1+2 anomaly was +4.5°C and the Region 3.4 anomaly was +2.9°C for the week centered around September 9. For the past six weeks, the ENSO Region 1+2 anomaly has averaged +4.23°C and the ENSO Region 3.4 anomaly has averaged +2.65°C. The ongoing strong El Niño, will continue to strengthen through the mid-fall. The SOI was -35.18 today. The preliminary Arctic Oscillation (AO) was +1.619 today. Based on sensitivity analysis applied to the latest guidance, there is an implied near 69% probability that New York City will have a cooler than normal September (1991-2020 normal). September will likely finish with a mean temperature near 68.3° (0.9° below normal). Supplemental Information: The projected mean would be 0.3° above the 1981-2010 normal monthly value.
-
Scenes from the New York Botanical Garden yesterday before a prolonged siege of clouds and periods of rain set in.

- 971 replies
-
- 10
-

-

-
A rainy period will likely develop tomorrow. Periods of rain could continue into at least the middle of next week. Temperatures will remain unseasonably cool throughout next week. The ENSO Region 1+2 anomaly was +4.5°C and the Region 3.4 anomaly was +2.9°C for the week centered around September 9. For the past six weeks, the ENSO Region 1+2 anomaly has averaged +4.23°C and the ENSO Region 3.4 anomaly has averaged +2.65°C. The ongoing strong El Niño, will continue to strengthen through the mid-fall. The SOI was -42.37 today. The preliminary Arctic Oscillation (AO) was +2.194 today. Based on sensitivity analysis applied to the latest guidance, there is an implied near 70% probability that New York City will have a cooler than normal September (1991-2020 normal). September will likely finish with a mean temperature near 68.2° (1.0° below normal). Supplemental Information: The projected mean would be 0.2° above the 1981-2010 normal monthly value.
-
Yes, in terms of the fall equinox, fall begins Tuesday. Meteorological fall, which is used for climate data purposes, began on September 1st.
-
It's early in terms of timing, but Sunday afternoon/evening appear to have the highest chance of heavier rain.
-
Cooler air will return for the weekend. Saturday will be a dry day with partly sunny skies. Clouds will increase on Sunday. Highs will be in the upper 60s to around 70°. A rainy period will likely develop late Sunday. Periods of rain could continue into at least the middle of next week. Temperatures will remain unseasonably cool throughout next week. The ENSO Region 1+2 anomaly was +4.5°C and the Region 3.4 anomaly was +2.9°C for the week centered around September 9. For the past six weeks, the ENSO Region 1+2 anomaly has averaged +4.23°C and the ENSO Region 3.4 anomaly has averaged +2.65°C. The ongoing strong El Niño, will continue to strengthen through the mid-fall. The SOI was -34.52 today. The preliminary Arctic Oscillation (AO) was +2.661 today. Based on sensitivity analysis applied to the latest guidance, there is an implied near 63% probability that New York City will have a cooler than normal September (1991-2020 normal). September will likely finish with a mean temperature near 68.5° (0.7° below normal). Supplemental Information: The projected mean would be 0.5° above the 1981-2010 normal monthly value.
-
Tomorrow will see temperatures top out in the upper 70s. Cooler air will return for the weekend. A rainy period could develop late Sunday and continue into early next week. Temperatures will remain unseasonably cool. The chance that the region could see its coolest air mass this fall arrive toward midweek next week has increased. The ENSO Region 1+2 anomaly was +4.5°C and the Region 3.4 anomaly was +2.9°C for the week centered around September 9. For the past six weeks, the ENSO Region 1+2 anomaly has averaged +4.23°C and the ENSO Region 3.4 anomaly has averaged +2.65°C. The ongoing strong El Niño, will continue to strengthen through the mid-fall. The SOI was -31.02 today. The preliminary Arctic Oscillation (AO) was +2.934 today. Based on sensitivity analysis applied to the latest guidance, there is an implied near 55% probability that New York City will have a cooler than normal September (1991-2020 normal). September will likely finish with a mean temperature near 69.0° (0.2° below normal). Supplemental Information: The projected mean would be 1.0° above the 1981-2010 normal monthly value.
-
Tomorrow through Friday will see temperatures recover mainly to the upper 70s. A few locations could reach or exceed 80° on one or more days. Cooler air will return for the weekend. A rainy period could develop late Sunday and continue into early next week. Temperatures will remain unseasonably cool. The ENSO Region 1+2 anomaly was +4.5°C and the Region 3.4 anomaly was +2.9°C for the week centered around September 9. For the past six weeks, the ENSO Region 1+2 anomaly has averaged +4.23°C and the ENSO Region 3.4 anomaly has averaged +2.65°C. The ongoing strong El Niño, will continue to strengthen through the mid-fall. The SOI was -36.78 today. The preliminary Arctic Oscillation (AO) was +2.191 today. Based on sensitivity analysis applied to the latest guidance, there is an implied near 54% probability that New York City will have a warmer than normal September (1991-2020 normal). September will likely finish with a mean temperature near 69.4° (0.2° above normal). Supplemental Information: The projected mean would be 1.4° above the 1981-2010 normal monthly value.
-
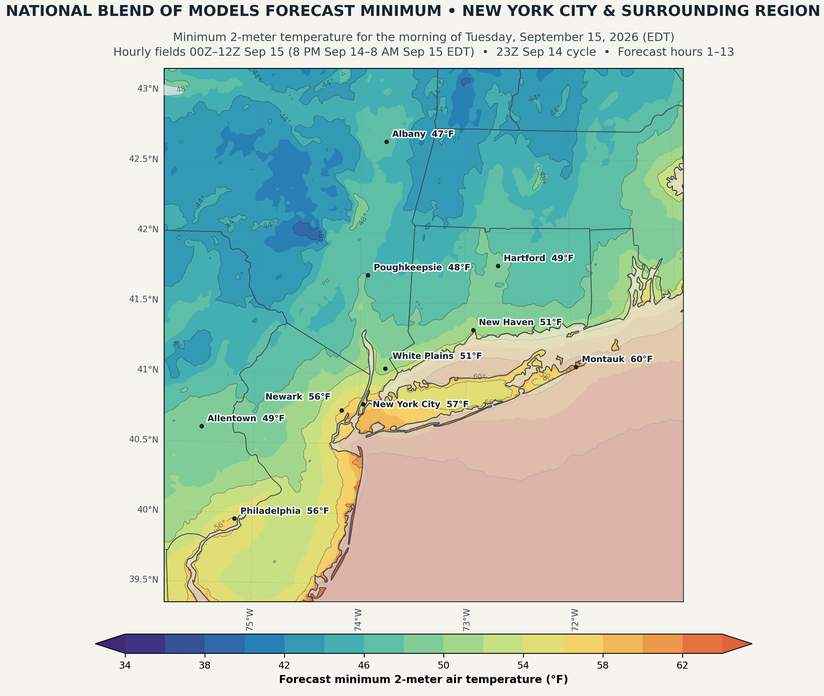
The New York City area will see its first lows in the 50s this season tomorrow morning.
-
The coolest air mass is continuing to push into the region. Highs tomorrow and Wednesday will reach the lower and middle 70s. New York City will see lows in the upper 50s to lower 60s. As a result, Central Park will experience its first reading below 60° this season tomorrow morning. the timing matches well with the last two El Niño events: 2015-2016: September 14 and 2023-2024: September 15. Wednesday through Friday will see temperatures recover mainly to the upper 70s. However, additional cool air will likely arrive some time during the next weekend. The ENSO Region 1+2 anomaly was +4.5°C and the Region 3.4 anomaly was +2.9°C for the week centered around September 9. For the past six weeks, the ENSO Region 1+2 anomaly has averaged +4.23°C and the ENSO Region 3.4 anomaly has averaged +2.65°C. The ongoing strong El Niño, will continue to strengthen through the mid-fall. The SOI was -25.91 today. The preliminary Arctic Oscillation (AO) was +1.373 today. Based on sensitivity analysis applied to the latest guidance, there is an implied near 54% probability that New York City will have a warmer than normal September (1991-2020 normal). September will likely finish with a mean temperature near 69.4° (0.2° above normal). Supplemental Information: The projected mean would be 1.4° above the 1981-2010 normal monthly value.
-
Daily record rainfall brought flooding to parts of the region, especially Connecticut and New Jersey, earlier today. Drier weather is now taking hold. The coolest air mass so far this season is poised to move into the region to tomorrow. Highs tomorrow through Wednesday will reach the lower and middle 70s. New York City will see lows in the upper 50s to lower 60s. As a result, Central Park will experience its first reading below 60° this season. the timing matches well with the last two El Niño events: 2015-2016: September 14 and 2023-2024: September 15. Wednesday through Friday will see temperatures recover mainly to the upper 70s. However, additional cool air will likely arrive some time during the next weekend. The ENSO Region 1+2 anomaly was +4.6°C and the Region 3.4 anomaly was +2.7°C for the week centered around September 2. For the past six weeks, the ENSO Region 1+2 anomaly has averaged +4.12°C and the ENSO Region 3.4 anomaly has averaged +2.57°C. The ongoing strong El Niño, will continue to strengthen through the mid-fall. The Region 1+2 anomaly surpasses the all-time record of +4.5° that was set during the week centered around June 29, 1983. The SOI was -25.61 today. The preliminary Arctic Oscillation (AO) was +1.716 today. Based on sensitivity analysis applied to the latest guidance, there is an implied near 50% probability that New York City will have a warmer than normal September (1991-2020 normal). September will likely finish with a mean temperature near 69.2° (near normal). Supplemental Information: The projected mean would be 1.2° above the 1981-2010 normal monthly value.
-
Islip has now picked up 2.31" of rain. That breaks the daily mark of 1.82" from 1971. Rain is falling heavily there.
-
So far, both Bridgeport (1.18") and Islip (1.13") have had an hourly period today with 1" or more rainfall. New Haven's rain measurements are again not being recorded.
-
Bridgeport has now received 3.45" of rain today. That is the fourth highest daily rainfall record for any day in September. It is also Bridgeport's heaviest one-day rainfall since the September 1, 2021 deluge dumped 5.77" of rain.
-
Following its wettest summer on record, Bridgeport has now picked up 2.43" (61.7 mm) of rain today. That breaks the daily record of 2.12" (53.8 mm) from 1971. Heavy rain continues to fall.
-
Artwork by Tania Franco Klein at the Yancey Richardson Gallery in New York City:

-
Rain will arrive tonight. A general 1.00"-2.00" rainfall with locally higher amounts in excess of 3.00" appears likely. Clouds will break tomorrow with the mercury rising into the upper 70s. However, the coolest air mass so far this season will then push into the region to begin the work week. Highs Monday through Wednesday will reach the lower and middle 70s. New York City will see lows in the upper 50s to lower 60s. As a result, Central Park will experience its first reading below 60° this season. the timing matches well with the last two El Niño events: 2015-2016: September 14 and 2023-2024: September 15. Wednesday through Friday will see temperatures recover mainly to the upper 70s. However, additional cool air will likely arrive some time during the next weekend. The ENSO Region 1+2 anomaly was +4.6°C and the Region 3.4 anomaly was +2.7°C for the week centered around September 2. For the past six weeks, the ENSO Region 1+2 anomaly has averaged +4.12°C and the ENSO Region 3.4 anomaly has averaged +2.57°C. The ongoing strong El Niño, will continue to strengthen through the mid-fall. The Region 1+2 anomaly surpasses the all-time record of +4.5° that was set during the week centered around June 29, 1983. The SOI was -29.77 today. The preliminary Arctic Oscillation (AO) was +1.761 today. Based on sensitivity analysis applied to the latest guidance, there is an implied near 50% probability that New York City will have a warmer than normal September (1991-2020 normal). September will likely finish with a mean temperature near 69.2° (near normal). Supplemental Information: The projected mean would be 1.2° above the 1981-2010 normal monthly value.
-
The weekend will start dry. However, rain will likely develop tomorrow night. In general, the temperature should top out in the upper 70s with lower 80s possible in the warmest spots this weekend. A period of rain is likely Saturday night into early Sunday. The potential exists for 0.50" or more rainfall. Highs could fall to the lower 70s for Monday and Tuesday before rebounding briefly toward 80° by mid-week. A fresh shot of cool air could arrive late in the week. The ENSO Region 1+2 anomaly was +4.6°C and the Region 3.4 anomaly was +2.7°C for the week centered around September 2. For the past six weeks, the ENSO Region 1+2 anomaly has averaged +4.12°C and the ENSO Region 3.4 anomaly has averaged +2.57°C. The ongoing strong El Niño, will continue to strengthen through the mid-fall. The Region 1+2 anomaly surpasses the all-time record of +4.5° that was set during the week centered around June 29, 1983. The SOI was -28.88 today. The preliminary Arctic Oscillation (AO) was +1.897 today. Based on sensitivity analysis applied to the latest guidance, there is an implied near 54% probability that New York City will have a warmer than normal September (1991-2020 normal). September will likely finish with a mean temperature near 69.5° (0.3° above normal). Supplemental Information: The projected mean would be 1.5° above the 1981-2010 normal monthly value.
-
It did. The terrible attacks have left a scar that won’t ever fully heal.
-
From February 2001:

- 971 replies
-
- 10
-
-
-

-
Occasional Thoughts on Climate Change
donsutherland1 replied to donsutherland1's topic in Climate Change
Using @TheClimateChanger's inspirational mapping work using AI, I ran a map for Colorado. As noted on numerous occasions regarding Denver, summers have grown hotter with the frequency of 90° days increasing dramatically. Mean Number of 90° or Above Highs Each Year: 1872-1999: 27.6 days 2000-2025: 50.7 days 2000-2026: 51.2 days (64 days in 2026 through September 10; mean summer 2026 high: 90.4°) Is the rising heat largely confined to Denver or are summers warming across Colorado? Here's how Colorado's most recent 30-years (1997-2026) compare with the preceding 30-year period. The data show that some of the mountainous regions have seen more rapid summer warming than Denver. In sum, Denver's rising heat is part of a larger story of ongoing climate change.

-
Somewhat cooler air will overspread the region tonight. In the wake of the frontal passage, highs tomorrow and Friday will likely peak in the upper 70s. In general, the temperature should top out in the upper 70s and lower 80s from the weekend through the middle of next week. Some rain is possible Saturday night into early Sunday. The ENSO Region 1+2 anomaly was +4.6°C and the Region 3.4 anomaly was +2.7°C for the week centered around September 2. For the past six weeks, the ENSO Region 1+2 anomaly has averaged +4.12°C and the ENSO Region 3.4 anomaly has averaged +2.57°C. The ongoing strong El Niño, will continue to strengthen through the mid-fall. The Region 1+2 anomaly surpasses the all-time record of +4.5° that was set during the week centered around June 29, 1983. The SOI was -19.73 today. The preliminary Arctic Oscillation (AO) was +2.175 today. Based on sensitivity analysis applied to the latest guidance, there is an implied near 58% probability that New York City will have a warmer than normal September (1991-2020 normal). September will likely finish with a mean temperature near 70.0° (0.8° above normal). Supplemental Information: The projected mean would be 2.0° above the 1981-2010 normal monthly value.
-
Temperatures will likely peak in the lower and middle 80s tomorrow. A shower is possible tomorrow evening or tomorrow night. Another push of cooler air could arrive by Friday or Saturday. Highs on both days will likely peak in the upper 70s. The longer-term outlook has grown somewhat warmer through the middle of next week. In general, the temperature should top out in the upper 70s and lower 80s through the middle of next week. The ENSO Region 1+2 anomaly was +4.6°C and the Region 3.4 anomaly was +2.7°C for the week centered around September 2. For the past six weeks, the ENSO Region 1+2 anomaly has averaged +4.12°C and the ENSO Region 3.4 anomaly has averaged +2.57°C. The ongoing strong El Niño, will continue to strengthen through the mid-fall. The Region 1+2 anomaly surpasses the all-time record of +4.5° that was set during the week centered around June 29, 1983. The SOI was -15.92 today. The preliminary Arctic Oscillation (AO) was +2.211 today. Based on sensitivity analysis applied to the latest guidance, there is an implied near 63% probability that New York City will have a warmer than normal September (1991-2020 normal). September will likely finish with a mean temperature near 70.2° (1.0° above normal). Supplemental Information: The projected mean would be 2.2° above the 1981-2010 normal monthly value.
-
Occasional Thoughts on Climate Change
donsutherland1 replied to donsutherland1's topic in Climate Change
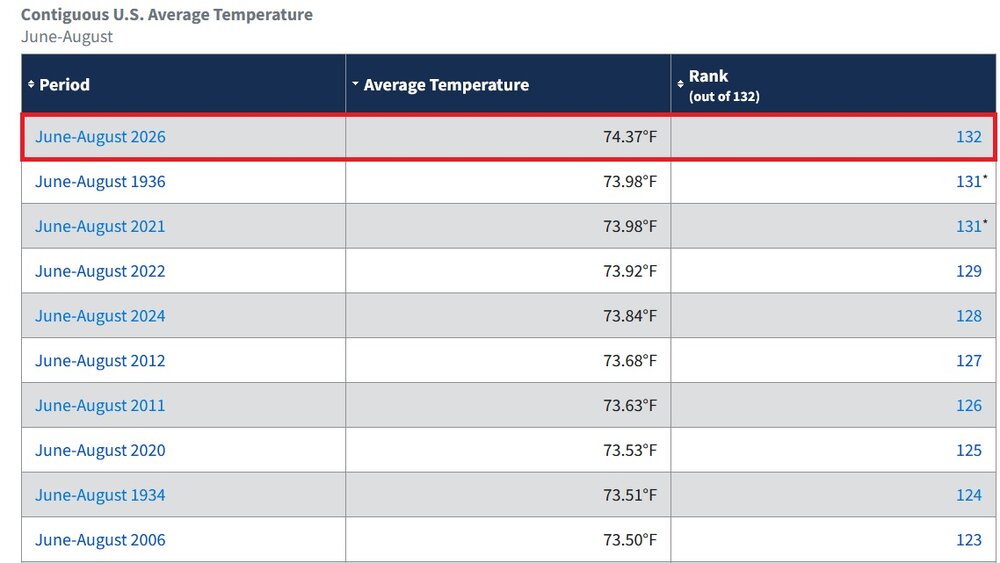
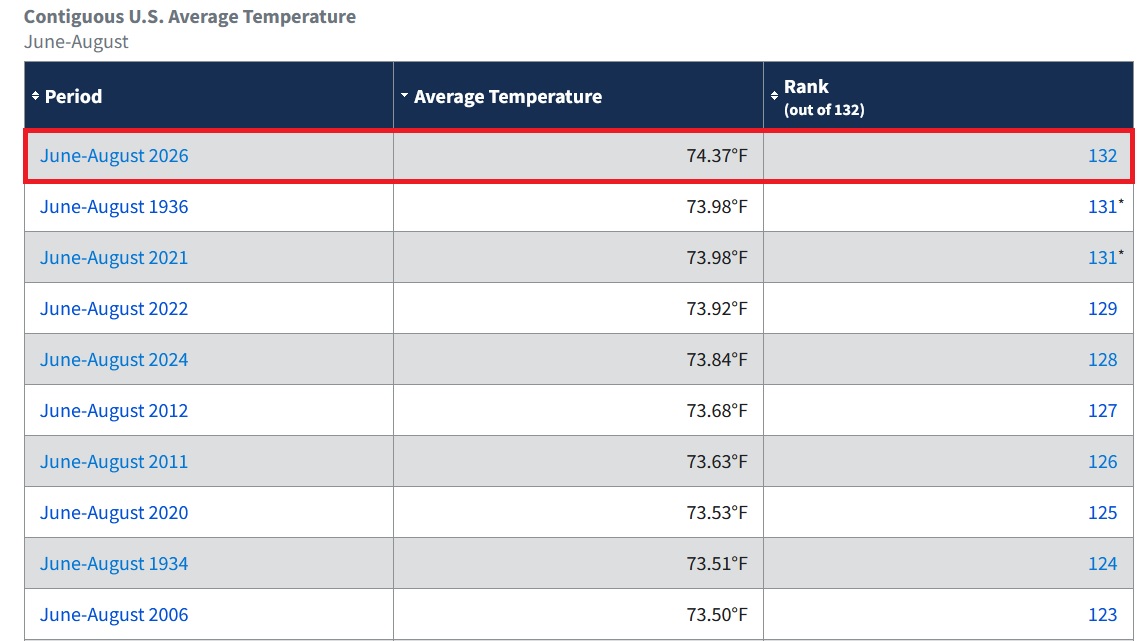
The preliminary data reveal that Summer 2026 swept past Summers 1936 and 2021 to easily become the warmest summer on record for the contiguous United States. Five of the ten warmest summers have occurred since 2020. Just two occurred during the 1930s.