Jump to content

donsutherland1

Members
  • Posts

    21,391
  • Joined

Everything posted by donsutherland1
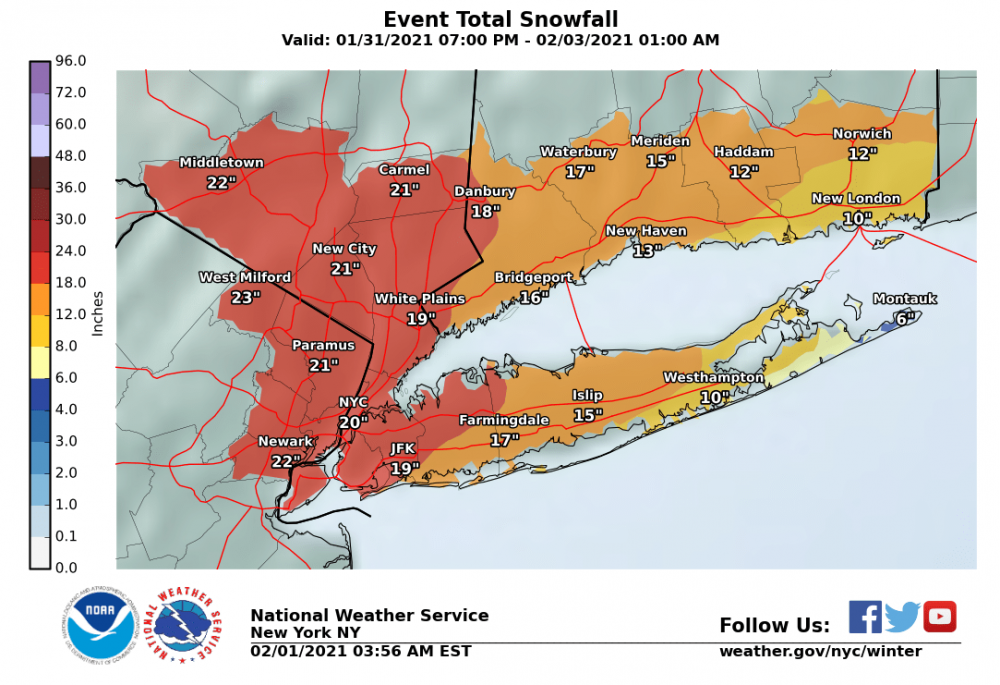
  1. On September 16, Arctic sea ice extent fell to 3.991 million square kilometers on JAXA. That is only the second time on record that Arctic sea ice extent will have a minimum figure below 4 million square kilometers.
  2. The near-real time products are not quality controlled. The final data is. From the NSIDC site: The daily and monthly images that we show in Arctic Sea Ice News & Analysis are near-real-time data. Near-real-time data do not receive the rigorous quality control that final sea ice products enjoy, but it allows us to monitor ice conditions as they develop. https://nsidc.org/arcticseaicenews/faq/#average-vs-daily It should be noted that the JAXA data set shows Arctic sea ice extent as second lowest and NSIDC shows it as 3rd lowest. One can probably have a reasonable degree of confidence that Arctic sea ice extent has fallen to at least the 3rd lowest figure on record at least somewhat below that of 2007. Corroboration across data sets adds confidence.
  3. Newly-released GISS temperature data revealed that summer 2019 was the warmest summer on record globally with a mean temperature anomaly of +0.92°C. The old record was +0.89°C, which was set in 2016. 9 of the 10 warmest summers occurred since 2000 and 5 of the last 10 warmest summers occurred since 2015. Weekly ENSO data suggest increased prospects of a neutral-cool wintertime ENSO. The ENSO Region 1+2 anomaly was -1.3°C and the Region 3.4 anomaly was -0.3°C for the week centered around September 11. For the past six weeks, the ENSO Region 1+2 anomaly has averaged -0.65°C and the ENSO Region 3.4 anomaly has averaged -0.03°C. There remains uncertainty about the ENSO evolution later this fall. Despite the guidance, the strong cooling in Region 1+2 indicates that the prospects for a neutral-cool ENSO during the winter have increased. Such a scenario may be somewhat more likely than not. That outcome could have significant winter season implications. Since 1991 when weekly ENSO region data was available, six years have seen September record 2 or more weeks with -1.0°C or cooler weekly anomalies in Region 1+2: 1996, 1999, 2002, 2007, 2010, and 2017. 5/6 (83%) of those cases went on to feature warm December-February temperature anomalies in the Middle Atlantic and southern New England regions. 2002 had one such week ahead of what would evolve into an El Niño winter. The SOI was -5.76 today. Today, the preliminary Arctic Oscillation (AO) figure was +1.041. Since 1950, there have been five prior cases when the AO averaged -0.500 or below in both July and August: 1950, 1958, 1960, 1968, and 2015. The average temperature for September was 69.1° (69.8° after adjusting for ongoing warming) and 58.9° (59.6° adjusted) for September through November in New York City. The 1981-2010 baseline normal figures are 68.0° and 57.5° respectively. The majority of cases saw a warmer than normal September and all cases featured a warmer than normal fall. Among those five cases, 2015 made a transition from predominantly negative AO values to predominantly positive ones during the fall. The combination of the AO's recent increase to the strongest positive values since April and some of the extended range guidance leave open a scenario where the AO is currently in the early stages of evolving to a predominantly positive regime. Such an outcome would also favor a warmer than normal fall and possible warm start to winter in the Middle Atlantic and southern New England regions. For now, this is merely a hypothetical discussion of one potential path toward winter. Many other variables are involved. The only idea that carries weight at this time is that the possible evolution reaffirms the longstanding signal for a warm fall. Overall, September remains on a path that will very likely lead to an above normal monthly temperature. A mean figure of 70.0° or above remains possible for New York City. Therefore, a warmer than normal September and fall appear likely. The potential for autumn 2019 to rank among the 30 warmest cases on record remains on the table. For New York City, that would translate into a September-November mean temperature of 58.8°. The latest EPS weekly data shows widespread warmth across the CONUS during October. On September 15, the MJO was in Phase 8 at an amplitude of 0.906 (RMM). The September 14-adjusted amplitude was 0.707. Based on sensitivity analysis applied to the latest guidance, the implied probability of New York City having a warmer than normal September is approximately 75%.
  4. Quick update for the larger June 1-September 15 period for Anchorage: 2019 had a mean temperature of 62.0°F (16.7°C). That surpassed the previous record warm figure of 60.0°F (15.6°), which was set in 2016. The 10 warmest June 1-September 15 timeframes occurred as follows: Prior to 1980: 2 cases 2000 or later: 7 cases 2010 or later: 5 cases 2015 or later: 4 cases
  5. Yesterday, National Hurricane Center scientist Eric Blake tweeted that Miami had set the record for the number of days with temperatures of 93° or above at 42 while noting that is "rouglhy double" the 40-year average. Blake's tweet was then retweeted by CBS' Jeff Berardelli, who noted that it provided an example of a "warming trend" and that in terms of such warmth "Miami is trending up quickly." Any serious look at the Miami climate record should have ended the discussion there. Berardelli was on the mark. Miami has had a clear temperature trend. Further, its 30-year moving average figure for annual temperatures reached a record high of 77.5° in 2017 and was tied in 2018. 2019 could lead to a slight increase in that figure. When one looks at Miami's years with a mean temperature of 77.0° or above, there were 26 such cases. 2 occurred prior to 1980. 22 occurred since 1990. 14 occurred since 2000. 8 occurred since 2010. 2019 is on track to become the 27th such case. Overall, there are a total of 119 cases in Miami's climate record. However, Berardelli's observation was questioned in spite of the data supporting it. Roger A. Pielke, Sr. went off on a tangent about dew points. That dew point temperatures are a distinct metric recorded by the NOAA needs to be emphasized. Blake's and Berardelli's observations concerned temperatures. They did not mention dew point figures. So, what happens when dew point data (which goes back to 1980) is included? Miami's dew point data revealed that the average number of days per year with dew point temperatures of 75° or above has generally increased in recent decades (20-year moving averages are in parentheses): 1980-89: 111.7 days per year 1990-99: 131.1 days per year (1980-1999: 121.4 days per year) 2000-09: 126.2 days per year (1990-2009: 128.7 days per year) 2010-18: 139.0 days per year (1999-2018: 130.8 days per year) The most recent 30-year period (1989-2018) averaged 130.7 days with dew point temperatures of 75° or above. That is the highest such average for a 30-year period on record.
  6. On September 15, Arctic sea ice extent had declined further to 4.006 million square kilometers on JAXA. As a result, 2019 now has the second lowest minimum extent figure on record. The previous second lowest figure was 4.017 million square kilometers, which was recorded in 2016.
  7. As the calendar marched deeper into September, France was experiencing yet another bout of record heat. Daily record highs in the 90s (fahrenheit) were recorded in parts of the country on the 15th. In large part due to the third lowest minimum extent of Arctic sea ice (JAXA), Utqiagvik (formerly Barrow) was in the midst of what could become its warmest September on record. That city had already seen 81 consecutive above freezing days through September 14, easily surpassing the previous mark of 68. It had also experienced 55 days of readings at or above 40°, smashing the old record of 32 by more than three weeks. In coming days, the GISTEMP global land and ocean temperature anomaly for August will be released. Once that happens, it will likely show that summer 2019 was either the first or second warmest summer on record globally. In response to such developments that have been linked to ongoing anthropogenic climate change, the media has begun to focus strictly on science and scientific realities associated with climate. Its former misplaced practice of granting climate change deniers a visible platform to spout their anti-scientific beliefs was showing signs of yielding to scientific reality. This is a welcome and overdue development. Climate change denial is no more robust in terms of science than past notions of a flat earth, an earth-centric solar system, among others. Toward that end, Nature announced in an editorial: For one week, starting on 15 September, Nature and more than 250 other outlets — with a combined audience of more than one billion — have committed to a week of intensive climate coverage (see ‘Covering climate now’)... Along with our colleagues in Covering Climate Now, we are united with all those who stand behind the consensus view of researchers. But there can be no more delay. The time to act is now. https://www.nature.com/articles/d41586-019-02734-x Such science-centered coverage is welcome. But one-time coverage over a short period of time is insufficient. If such coverage is sustained to reflect the sustained nature of ongoing climate change, the contribution will far more valuable. Throughout history, science has advanced in the face of often fierce resistance. The climate change denial movement almost certainly won't relent. The combination of motivated reasoning and the embrace of conspiracy theories is potent nutrition for that movement. That movement will continue to advance pseudo-scientific "explanations" for outcomes that can only be explained by anthropogenic forcing. It will deflect attention from science with false narratives and exaggerated caricatures. It will continue to launch vicious ad hominem attacks on climate scientists and climate change activists (especially females). It will seek to throw a cloak of ignorance over global society in a desperate bid to paralyze public policy and hobble the possibility for global collaboration on the challenge of climate change. But, in the end, as has happened throughout history, science will ultimately triumph. The timing of that outcome still remains uncertain. But once science prevails, society will be better for it.
  8. Another warm day lies ahead for tomorrow. Readings should reach or exceed 80° in much of the Middle Atlantic region tomorrow before a push of cooler air arrives for a few days. However, warmer air could again overspread the region late in the week. Humberto will very likely recurve away from the U.S. East Coast this week. It should have no impact on the overall weather in the Middle Atlantic and southern New England areas. Earlier today, France experienced renewed record heat. This warmth likely resulted, in part, from the combination of the currently positive Arctic Oscillation and the lengthening of wave lengths that is now underway. Record high temperatures included: Cognac: 91°; Dijon: 88°; La Roche-Sur-Yon: 88°; Limoges: 88°; Lyon-Bron: 91°; Nevers: 90°; Orange: 91°; Poitiers: 90°. The ENSO Region 1+2 anomaly was -0.6°C and the Region 3.4 anomaly was -0.2°C for the week centered around September 4. For the past six weeks, the ENSO Region 1+2 anomaly has averaged -0.52°C and the ENSO Region 3.4 anomaly has averaged +0.10°C. Neutral-warm ENSO conditions are in place in Region 3.4 with neutral-cool conditions in place in Region 1+2. There remains uncertainty about the ENSO evolution later this fall. The outcome could have significant winter season implications. The CFSv2 has recently shifted toward a warm-neutral/borderline weak El Niño signal for the winter. The SOI was -11.70 today. Today, the preliminary Arctic Oscillation (AO) figure was +1.078. That was the highest figure since April 23, when the AO was +1.503. Since 1950, there have been five prior cases when the AO averaged -0.500 or below in both July and August: 1950, 1958, 1960, 1968, and 2015. The average temperature for September was 69.1° (69.8° after adjusting for ongoing warming) and 58.9° (59.6° adjusted) for September through November in New York City. The 1981-2010 baseline normal figures are 68.0° and 57.5° respectively. The majority of cases saw a warmer than normal September and all cases featured a warmer than normal fall. Among those five cases, 2015 made a transition from predominantly negative AO values to predominantly positive ones during the fall. The combination of the AO's recent increase to the strongest positive values since April and some of the extended range guidance leave open a scenario where the AO is currently in the early stages of evolving to a predominantly positive regime. Such an outcome would also favor a warmer than normal fall and possible warm start to winter in the Middle Atlantic and southern New England regions. For now, this is merely a hypothetical discussion of one potential path toward winter. Many other variables are involved. The only idea that carries weight at this time is that the possible evolution reaffirms the longstanding signal for a warm fall. Overall, September remains on a path that will very likely lead to an above normal monthly temperature. A mean figure of 70.0° or above remains possible for New York City. Therefore, a warmer than normal September and fall appear likely. The potential for autumn 2019 to rank among the 30 warmest cases on record remains on the table. For New York City, that would translate into a September-November mean temperature of 58.8°. On September 14, the MJO was in Phase 7 at an amplitude of 0.708 (RMM). The September 13-adjusted amplitude was 0.356. Based on sensitivity analysis applied to the latest guidance, the implied probability of New York City having a warmer than normal September is approximately 75%. Finally, Artic sea ice extent reached 4.025 million square kilometers yesterday. That would rank as the third lowest minimum extent figure on record, about 9,000 square kilometers above the 2016 minimum extent figure. On account of the limited Arctic sea ice, Utqiagvik (Barrow) could see September 2019 rank among the warmest Septembers on record and possibly become the warmest September on record.
  9. After another decline, Arctic sea ice extent (JAXA) has now decreased to 4.026 million square kilometers. That is approximately 40,000 square kilometers below the 2012 minimum extent figure (4th lowest) and just under 9,000 square kilometers above the 2016 figure (2nd lowest).
  10. Warmer readings will likely push northward tomorrow. During the forthcoming week, Humberto will likely recurve away from the U.S. East Coast. It should have no impact on the overall weather in the Middle Atlantic and southern New England areas. The ENSO Region 1+2 anomaly was -0.6°C and the Region 3.4 anomaly was -0.2°C for the week centered around September 4. For the past six weeks, the ENSO Region 1+2 anomaly has averaged -0.52°C and the ENSO Region 3.4 anomaly has averaged +0.10°C. Neutral-warm ENSO conditions are in place in Region 3.4 with neutral-cool conditions in place in Region 1+2. There remains uncertainty about the ENSO evolution later this fall. The outcome could have significant winter season implications. The CFSv2 has recently shifted toward a warm-neutral/borderline weak El Niño signal for the winter. The SOI was -26.86 today. Today, the preliminary Arctic Oscillation (AO) figure was +0.934. Since 1950, there have been five prior cases when the AO averaged -0.500 or below in both July and August: 1950, 1958, 1960, 1968, and 2015. The average temperature for September was 69.1° (69.8° after adjusting for ongoing warming) and 58.9° (59.6° adjusted) for September through November in New York City. The 1981-2010 baseline normal figures are 68.0° and 57.5° respectively. The majority of cases saw a warmer than normal September and all cases featured a warmer than normal fall. Therefore, a warmer than normal September and fall appear likely. The potential for autumn 2019 to rank among the 30 warmest cases on record remains on the table. For New York City, that would translate into a September-November mean temperature of 58.8°. On September 13, the MJO was in Phase 7 at an amplitude of 0.397 (RMM). The September 12-adjusted amplitude was 0.591. Based on sensitivity analysis applied to the latest guidance, the implied probability of New York City having a warmer than normal September is approximately 61%.    
  11. The most recent EPS monthly forecast calls for both a warm October and November. The CFSv2 has a near normal October (but has run cool in recent months) and a warm November. Until there are signs that the pattern will establish itself toward one that favors cold in the East, it's premature to have much confidence there. By late October or November, there will probably be better insight. For me, at least, it's too soon to try to make a winter call.
  12. On JAXA, Arctic sea ice extent has fallen to 4.054 million square kilometers. That is just below the 2007 minimum figure and is the third lowest minimum figure on record.
  13. Just so there’s no confusion, my point dealt with temperatures on a global basis. At that time, I noted records in parts of Finland, Norway, and Russia.
  14. I agree. Almost certainly, multiple reasons including personal experience, have contributed to the shifting opinions. Those opinions are consistent with scientific understanding. However, scientific understanding, alone, very likely hasn't driven the trend. A poll that probes the shift would be interesting. It would also be helpful to scientists who have been trying to communicate the message against the noise of the climate change denial movement.
  15. Warmer air will push back into the region beginning tomorrow. Based on the forecast pattern and some of the guidance, there is a chance that a tropical cyclone could pose a risk to parts of the East Coast next week. Recurvature away from the East Coast is more likely than not. The ENSO Region 1+2 anomaly was -0.6°C and the Region 3.4 anomaly was -0.2°C for the week centered around September 4. For the past six weeks, the ENSO Region 1+2 anomaly has averaged -0.52°C and the ENSO Region 3.4 anomaly has averaged +0.10°C. Neutral-warm ENSO conditions are in place in Region 3.4 with neutral-cool conditions in place in Region 1+2. There remains uncertainty about the ENSO evolution later this fall. The outcome could have significant winter season implications. The CFSv2 has recently shifted toward a warm-neutral/borderline weak El Niño signal for the winter. The SOI was -28.88 today. Today, the preliminary Arctic Oscillation (AO) figure was +0.558. Since 1950, there have been five prior cases when the AO averaged -0.500 or below in both July and August: 1950, 1958, 1960, 1968, and 2015. The average temperature for September was 69.1° (69.8° after adjusting for ongoing warming) and 58.9° (59.6° adjusted) for September through November in New York City. The 1981-2010 baseline normal figures are 68.0° and 57.5° respectively. The majority of cases saw a warmer than normal September and all cases featured a warmer than normal fall. Therefore, a warmer than normal September and fall appear likely. The potential for autumn 2019 to rank among the 30 warmest cases on record remains on the table. The latest EPS weeklies are hinting that an extended period of above to much above normal readings could prevail after mid-September. It remains plausible that September 2019 could have a mean temperature of 70.0° or above in New York City. On September 12, the MJO was in Phase 5 at an amplitude of 0.595 (RMM). The September 11-adjusted amplitude was 1.075. Based on sensitivity analysis applied to the latest guidance, the implied probability of New York City having a warmer than normal September is approximately 60%.
  16. Despite the loud and ferocious campaign led by the shrinking climate change denial movement, the latest polling suggests that the American people are increasingly reaching climate-related conclusions based on science. A new Washington Post-Kaiser Family Foundation poll revealed, among other things, that 79% of respondents recognize that human activity is causing climate change and that 76% believe climage change is a major problem or crisis (38% each) vs. 59% in 2014. https://www.washingtonpost.com/context/washington-post-kaiser-family-foundation-climate-change-survey-july-9-aug-5-2019/601ed8ff-a7c6-4839-b57e-3f5eaa8ed09f/
  17. Probably a combination of internal variability and climate change. Certainly, the region is forecast to grow wetter by the climate models. One has witnessed a rise in precipitation in many parts of the Northeast in recent decades. One has also witnessed an increase in exceptionally wet years, too. Some additional information can be found here: https://nca2018.globalchange.gov/chapter/18/ https://www.c2es.org/content/extreme-precipitation-and-climate-change/
  18. Some additional precipitation statistics for New York City: Average annual precipitation: 1869-1970: 42.89"; 1971-2018: 50.74" Years with 50" or more precipitation: 1869-1970: 12; 1971-2018: 21
  19. Cooler readings moved into the region this afternoon and will likely predominate through tomorrow before warmer air returns. Farther south, record-tying and record-breaking heat prevailed in parts of the Middle Atlantic region. Records included: Baltimore: 97° (old record: 96°, 1931); Lynchburg, VA: 96° (tied record set in 1895); Richmond: 98° (tied record set in 1900)); Roanoke, VA: 96° (tied record set in 1933); Sterling, VA: 95° (tied record set in 1995); and, Washington, DC: 98° (old record: 96°, 1895 and 1931). Based on the forecast pattern and some of the guidance, there is a chance that a tropical cyclone could pose a risk to parts of the East Coast next week. Recurvature away from the East Coast also remains on the table. The ENSO Region 1+2 anomaly was -0.6°C and the Region 3.4 anomaly was -0.2°C for the week centered around September 4. For the past six weeks, the ENSO Region 1+2 anomaly has averaged -0.52°C and the ENSO Region 3.4 anomaly has averaged +0.10°C. Neutral-warm ENSO conditions are in place in Region 3.4 with neutral-cool conditions in place in Region 1+2. There remains uncertainty about the ENSO evolution later this fall. The outcome could have significant winter season implications. The CFSv2 has recently shifted toward a warm-neutral/borderline weak El Niño signal for the winter. The SOI was -24.42 today. Today, the preliminary Arctic Oscillation (AO) figure was +0.473. Since 1950, there have been five prior cases when the AO averaged -0.500 or below in both July and August: 1950, 1958, 1960, 1968, and 2015. The average temperature for September was 69.1° (69.8° after adjusting for ongoing warming) and 58.9° (59.6° adjusted) for September through November in New York City. The 1981-2010 baseline normal figures are 68.0° and 57.5° respectively. The majority of cases saw a warmer than normal September and all cases featured a warmer than normal fall. Therefore, a warmer than normal September and fall appear likely. The potential for autumn 2019 to rank among the 30 warmest cases on record remains on the table. The latest EPS weeklies are hinting that an extended period of above to much above normal readings could prevail after mid-September. It remains plausible that September 2019 could have a mean temperature of 70.0° or above in New York City. On September 11, the MJO was in Phase 5 at an amplitude of 1.082 (RMM). The September 10-adjusted amplitude was 1.509. Based on sensitivity analysis applied to the latest guidance, the implied probability of New York City having a warmer than normal September is approximately 60%.
  20. Time has devoted an entire issue to climate change under the provocative title "2050: The Fight for Earth." The publication contains a wide range of articles ranging from a fairly optimistic piece by Bill McKibben of a scenario where the world was able to avert the worst of climate change to an article by Penn State professor of atmospheric science and director of its Earth System Science Center, Michael Mann who writes that lifestyle changes, alone, are insufficient to address the challenge of climate change. Not every article is science-related. However, the content is based on the dual premises that (1) the world is warming and (2) anthropogenic activities are largely responsible for that warming. Every serious data set shows that there has been an observed and persistent warming. The scientific evidence pointing to the anthropogenic basis of that warming is overwhelming. Put another way, all serious scientific debate has been settled on the core issues of whether the world is warming (it is) and whether human activities are largely responsible (they are). Residual uncertainties related to feedbacks such as the rate and impact of glacial retreat and non-linear questions concerning the rate of sea level increase remain to be resolved. But the overall reality of climate change and the anthropogenic driver of climate change are established beyond any serious scientific dispute. Therefore, just as astronomers today accept that the earth revolves around the sun, the magazine proceeds from the climate foundation that has been demonstrated by science. Just as astrophysics gives no weight to disproved belief systems of the past related to the solar system, the magazine ignores disproved denial of climate change. Fiction has no place in the important public discourse, especially that related to a big issue such as the world's changing climate. In building from the firm foundation of scientific understanding, Time seeks to provide a broad portrait of climate change as it continues to play out. Its articles include a degree of science. They also talk about human society and human health. Overall, Time's focus on one of today's biggest issues makes an important contribution to public discussion.
  21. Parts of the region saw temperatures reach 90° or above. Through today, 90° or above days are as follows for select locations: Allentown: 21 Atlanta: 74 Baltimore: 52 Boston: 14 Charleston, SC: 71 Harrisburg: 30 Hartford: 26 Islip: 8 New York City-JFK: 6 New York City-LGA: 24 New York City-NYC: 14 Newark: 25 Norfolk: 47 Philadelphia: 33 Providence:12 Raleigh: 65 Richmond: 60 Savannah: 96 Sterling: 47 Washington, DC: 54 Overall, readings will then remain above to much above normal afterward for an extended period of time with some short intervals of cooler readings, one of which will likely be Friday and Saturday. The ENSO Region 1+2 anomaly was -0.6°C and the Region 3.4 anomaly was -0.2°C for the week centered around September 4. For the past six weeks, the ENSO Region 1+2 anomaly has averaged -0.52°C and the ENSO Region 3.4 anomaly has averaged +0.10°C. Neutral-warm ENSO conditions are in place in Region 3.4 with neutral-cool conditions in place in Region 1+2. There remains uncertainty about the ENSO evolution later this fall. The outcome could have significant winter season implications. The CFSv2 has recently shifted toward a warm-neutral/borderline weak El Niño signal for the winter. The SOI was -11.70 today. Today, the preliminary Arctic Oscillation (AO) figure was +0.506. Since 1950, there have been five prior cases when the AO averaged -0.500 or below in both July and August: 1950, 1958, 1960, 1968, and 2015. The average temperature for September was 69.1° (69.8° after adjusting for ongoing warming) and 58.9° (59.6° adjusted) for September through November in New York City. The 1981-2010 baseline normal figures are 68.0° and 57.5° respectively. The majority of cases saw a warmer than normal September and all cases featured a warmer than normal fall. Therefore, a warmer than normal September and fall appear likely. The potential for autumn 2019 to rank among the 30 warmest cases on record remains on the table. The latest EPS weeklies are hinting that an extended period of above to much above normal readings could prevail after mid-September. It remains plausible that September 2019 could have a mean temperature of 70.0° or above in New York City. On September 10, the MJO was in Phase 5 at an amplitude of 1.508 (RMM). The September 9-adjusted amplitude was 1.633. Based on sensitivity analysis applied to the latest guidance, the implied probability of New York City having a warmer than normal September is approximately 65%.
  22. This is disappointing, but not surprising. It was clear from the onset that the unattributed NOAA statement was a political statement. That the origins are being traced to the White House can be expected given how forcefully and persistently the President clung to his erroneous statement concerning Dorian and Alabama.
  23. In the New York City area, September has increasingly become an extension of summer. Prior to 2000, a monthly mean temperature of 70° or above was relatively uncommon. Prior to 1950, Central Park saw such warmth about once every 5.4 years. From 1950-1999 (during which the City has had a mature urban footprint), such warmth was recorded approximately once every 4.5 years. Since 2000, 70° Septembers have occurred about once every 2.1 years. There have been 9 such Septembers during the 2000-2018 period, which is just below the figure of 11 recorded during 1950-1999. Since 2010, New York City has had 6 cases where September had a mean temperature of 70° or above, including the last four years. During the 1951-80 base period, the statistical probability of a 70° September was about 24.5%. Since 2000, the statistical probability has increased to just over 42%.
  24. Today's edition of The Washington Post has a feature story on climate change. In part, the story notes: The mysterious blob covers 130,000 square miles of ocean, an area nearly twice as big as this small country. And it has been heating up extremely rapidly — by over 2 degrees Celsius — or 2C — over the past century, double the global average. At its center, it's grown even hotter, warming by as much as 3 degrees Celsius, according to one analysis. The entire global ocean is warming, but some parts are changing much faster than others — and the hot spot off Uruguay is one of the fastest. It was first identified by scientists in 2012, but it is still poorly understood and has received virtually no public attention... The South Atlantic blob is part of a global trend: Around the planet, enormous ocean currents are traveling to new locations. As these currents relocate, waters are growing warmer. Scientists have found similar hot spots along the western stretches of four other oceans — the North Atlantic, the North Pacific, the South Pacific, and the Indian... The fastest-warming zones include the Arctic, much of the Middle East, Europe and northern Asia, and key expanses of ocean. A large part of Canada is at 2C or higher. https://www.washingtonpost.com/graphics/2019/national/climate-environment/climate-change-world/ Following a historically hot summer, at the time of this article's publication, parts of Europe are engulfed in their fourth bout of record-breaking heat since June. Record temperatures were set in numerous parts of Finland, Norway, and western Russia earlier today. And in a recurrent theme, the number of daily record high temperatures vastly exceeded the number of daily record low temperatures. Svolvaer and Tromso, both in Norway, even tied their highest September temperatures on record. Although the scientific evidence for climate change and its anthropogenic basis is now overwhelming, some persist, especially on Social Media such as Twitter, to deny what is now undeniable when one rationally and objectively considers the scientific evidence. While many of those on Social Media lack scientific backgrounds and/or understanding, and this critique excludes them for that reason, some are involved in science-related fields where, unless they had not kept up with the advances in the literature since the 1970s, there is no defensible scientific reason to push back against the findings related to climate change. Perhaps astrophysicist Neil DeGrasse Tyson described that phenomenon quite well when he observed, "When scientifically investigating the natural world, the only thing worse than a blind believer is a seeing denier." He continued, "When people believe a tale that conflicts with self-checkable evidence it tells me that people undervalue the role of evidence in formulating an internal belief system." That gets to the heart of the matter. The "internal belief system" of climate change denial--and it's a non-scientific belief system, as the evidence for climate change and its anthropogenic nature, even respecting residual uncertainties, is now unequivocal--is sustained by a fundamental rejection of evidence.
×
×
  • Create New...