

donsutherland1
-
Posts
23,853 -
Joined
Content Type
Profiles
Blogs
Forums
American Weather
Media Demo
Store
Gallery
Everything posted by donsutherland1
-
OBS and nowcast 10A-5P both Mon and Tue 2/22-23
donsutherland1 replied to wdrag's topic in New York City Metro
Central Park: 0.4” -
OBS and nowcast 10A-5P both Mon and Tue 2/22-23
donsutherland1 replied to wdrag's topic in New York City Metro
They should, but that doesn’t happen there consistently. -
Philadelphia: 0.8”
-
OBS and nowcast 10A-5P both Mon and Tue 2/22-23
donsutherland1 replied to wdrag's topic in New York City Metro
EWR: 2.1” -
OBS and nowcast 10A-5P both Mon and Tue 2/22-23
donsutherland1 replied to wdrag's topic in New York City Metro
The above pictures are from NYC’s suburbs (Scarsdale, Larchmont, and Mamaroneck). If anything stuck on Central Park’s snowboard after 1 pm, it will likely be washed away before the Park measures again at 7 pm. It seems that no measurement is made when the snow stops falling or no such measurement is made on a consistent basis. -
OBS and nowcast 10A-5P both Mon and Tue 2/22-23
donsutherland1 replied to wdrag's topic in New York City Metro
Three photos from today’s snowfall: -
OBS and nowcast 10A-5P both Mon and Tue 2/22-23
donsutherland1 replied to wdrag's topic in New York City Metro
It just flipped to rain in Larchmont. The change was abrupt, from heavy snow directly to rain. -
OBS and nowcast 10A-5P both Mon and Tue 2/22-23
donsutherland1 replied to wdrag's topic in New York City Metro
A quick video clip: -
OBS and nowcast 10A-5P both Mon and Tue 2/22-23
donsutherland1 replied to wdrag's topic in New York City Metro
Light snow just started falling in Larchmont. -
OBS and nowcast 10A-5P both Mon and Tue 2/22-23
donsutherland1 replied to wdrag's topic in New York City Metro
People just to the west of the Schuylkill Expressway are reporting snow. -
Morning thoughts... At 7:50 am, an area of heavy snow (likely 1”-1.5” per hour) was moving eastward across central Pennsylvania. That snow will continue to advance rapidly eastward. A period of rain or snow changing to rain will break out during the morning. New York City, Newark, and Philadelphia will likely pick up near 1” of snow. An area extending across northeastern Pennsylvania, northwestern New Jersey and adjacent New York State, including Allentown, will likely see 2”-4” with local amounts of 6”. Temperatures will likely top out in the middle and upper 30s in most of the region. Likely high temperatures around the region include: New York City (Central Park): 39° Newark: 39° Philadelphia: 39° Following today’s precipitation, most of the remainder of February will likely see temperatures average somewhat above normal. There may still be some opportunity for snowfall despite the milder regime.
-
I hope so. I’m glad to hear that your boss cares about safety.
-
Good luck with the snow. Be careful driving if you have to be on the road.
-
I believe that’s in or near the vicinity where the latest HREF is showing 6”-8” amounts.
-
It should be a fun event for the Lehigh Valley. It will be interesting to see if there are some localized 6” amounts and where they occur.
-
I think Philadelphia gets near 1” and Allentown receives 3”-4”.
-
In response to the Arctic Oscillation's having gone positive, a pattern change is now imminent. The advance of the milder air will be preceded by a storm that could bring snow changing to rain to most parts of the region tomorrow. From the Jersey Shore and across Long Island, little or no snow is likely this time around. New York City and Newark will likely pick up near 1" of snow. Across northeastern Pennsylvania and northwestern New Jersey, including Allentown, 2"-4" with local amounts of 6" is likely. A warmup will likely follow the storm. Tuesday will likely see the temperature top out in the lower and middle 40s. Parts of the area could reach or exceed 50° on Wednesday before somewhat cooler air arrives. Overall, a period of warmer than normal temperatures is likely in the Middle Atlantic and southern New England areas into the first week of March and possibly beyond that. There could be some short-lived shots of cooler air. The ENSO Region 1+2 anomaly was -0.5°C and the Region 3.4 anomaly was -1.2°C for the week centered around February 10. For the past six weeks, the ENSO Region 1+2 anomaly has averaged -0.50°C and the ENSO Region 3.4 anomaly has averaged -1.00°C. La Niña conditions will likely prevail at least through mid-March. The SOI was +19.79 today. The preliminary Arctic Oscillation (AO) figure was +0.454 today On February 20 the MJO was in Phase 7 at an amplitude of 1.204 (RMM). The February 19-adjusted amplitude was 1.285. Based on the latest guidance, no significant stratospheric warming event is likely into the first week of March. The significant December 16-17 snowstorm during what has been a blocky December suggests that seasonal snowfall prospects have increased especially from north of Philadelphia into southern New England. At New York City, there is a high probability based on historic cases that an additional 20" or more snow will accumulate after December. Since January 1, New York City has picked up 27.7" snow. Winters that saw December receive 10" or more snow, less than 10" in January, and then 10" or more in February in New York City, saw measurable snowfall in March or April in 83% of cases. Winter 2009-2010 was the exception where only a trace of snow was recorded. This group of winters saw 6" or more snow during the March-April period in 50% of the cases. All said, it is more likely than not that there will be measurable snowfall after February. Based on sensitivity analysis applied to the latest guidance, there is an implied 97% probability that New York City will have a colder than normal February. February will likely finish with a mean temperature near 32.9° (2.4° below normal).
-
A very snowy February is nearing its conclusion. There could be some additional snowfall tomorrow in Central Park. Areas to the west of New York City should pick up 1"-3" snow with 2"-4" and localized higher amounts running across northeastern Pennsylvania and northwestern New Jersey. How March fares in terms of snowfall will depend, at least in part, on the monthly mean temperature. The monthly mean temperature explains nearly 30% of the City's March snowfall. March Temperatures and Snowfall (New York City):
-
That’s a one day chart. Here’s how the Arctic above 80N has fared:
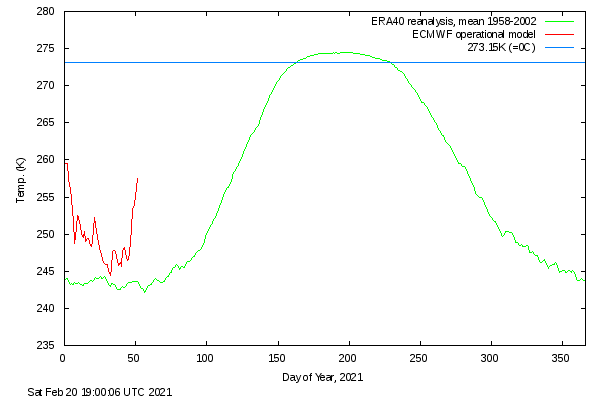
-
From CPC:
-
The 12z NAM and 3 km NAM have shifted the eastern edge of accumulating snow a little close to NYC than the 6z run. The area around Allentown and its immediate north and west looks to be in line for the heaviest amounts, a theme consistent with a lot of the other guidance though 6z.
-
Morning thoughts... Today will be partly to mostly sunny and cold. Temperatures will likely top out in the lower and middle 30s in most of the region. Likely high temperatures around the region include: New York City (Central Park): 36° Newark: 36° Philadelphia: 37° A period of rain or snow changing to rain is likely tomorrow. Some accumulation is likely, especially north and west of New York City. New York City could receive a small accumulation. The remainder of the week will likely see readings generally somewhat above seasonal norms. Meanwhile, parts of China, Japan, and South Korea experienced historic February warmth earlier today. At Beijing, the temperature soared to 79°. That broke the February mark of 69° set just yesterday. The prior record was 68°, which was set on February 13, 1996.
-
That was 9.1” in December. March had 17.4” snow.
-
The last snow flurries and snow showers departed the region early today. Most of the area saw partly sunny skies. Seasonal snowfall totals and anomalies following the most recent storm are: Albany: 52.1" (8.1" above normal) Allentown: 53.2" (24.2" above normal) ***11th highest*** Baltimore: 10.1" (6.3" below normal) Binghamton: 87.4" (28.4" above normal) ***27th highest*** Boston: 38.4" (7.4" above normal) Bridgeport: 43.3" (24.0" above normal) Buffalo: 67.1" (7.1" below normal) Burlington: 55.8" (0.5" below normal) Caribou: 73.1" (3.2" below normal) Harrisburg: 32.4" (10.0" above normal) Islip: 33.1" (15.4" above normal) New York City: 38.2" (19.4" above normal) Newark: 44.5" (23.9" above normal) ***14th highest*** Philadelphia: 23.1" (6.1" above normal) Portland: 40.8" (2.2" below normal) Providence: 33.5" (8.0" above normal) Washington, DC: 5.4" (7.4" below normal) In response to the Arctic Oscillation's having gone positive, a pattern change will likely occur early next week. The advance of the milder air could be preceded by a storm that could bring some rain or snow changing to rain to parts of the region. Following the shift in the prevailing pattern, a period of warmer than normal temperatures is likely in the Middle Atlantic and southern New England areas. The ENSO Region 1+2 anomaly was -0.5°C and the Region 3.4 anomaly was -1.2°C for the week centered around February 10. For the past six weeks, the ENSO Region 1+2 anomaly has averaged -0.50°C and the ENSO Region 3.4 anomaly has averaged -1.00°C. La Niña conditions will likely prevail at least through mid-March. The SOI was +21.71 today. The preliminary Arctic Oscillation (AO) figure was +0.494 today On February 19 the MJO was in Phase 7 at an amplitude of 1.284 (RMM). The February 18-adjusted amplitude was 1.477. Based on the latest guidance, no significant stratospheric warming event is likely into the first week of March. The significant December 16-17 snowstorm during what has been a blocky December suggests that seasonal snowfall prospects have increased especially from north of Philadelphia into southern New England. At New York City, there is a high probability based on historic cases that an additional 20" or more snow will accumulate after December. Since January 1, New York City has picked up 27.7" snow. Winters that saw December receive 10" or more snow, less than 10" in January, and then 10" or more in February in New York City, saw measurable snowfall in March or April in 83% of cases. Winter 2009-2010 was the exception where only a trace of snow was recorded. This group of winters saw 6" or more snow during the March-April period in 50% of the cases. All said, it is more likely than not that there will be measurable snowfall after February. Based on sensitivity analysis applied to the latest guidance, there is an implied 96% probability that New York City will have a colder than normal February. February will likely finish with a mean temperature near 32.9° (2.4° below normal).
-
A photo from this afternoon:


