
Bubbler86
-
Posts
29,773 -
Joined
-
Last visited
Content Type
Profiles
Blogs
Forums
American Weather
Media Demo
Store
Gallery
Everything posted by Bubbler86
-
Got the transfer and snow for 2/3 of PA...a lot of it.
-
5-10" for the 7th. A bit less North and East PA. LOL. Man, I love Red Robin. Favorite Burger joint.
-
Snow breaking out again on Jan 9th but this is from a front coming off a Midwest Low so would need a transfer or major block a transfer to stop this from changing over.
-
That is an all-night no driving deal if you do that.
-
This is the 7th not the 8th. Plus temps are still not overly cold. Snowing in the MA (MD, N VA) but 2M temps are above freezing for some of them. Philly near 32, LSV 25-30 during the height of the snow.
-
Bang
-
HH Gfs Op. Jan 4th SLP is deflected by a GL lows though this scenario does pull some of the colder air of the season into PA with teens and 20's for lows Friday AM.
-
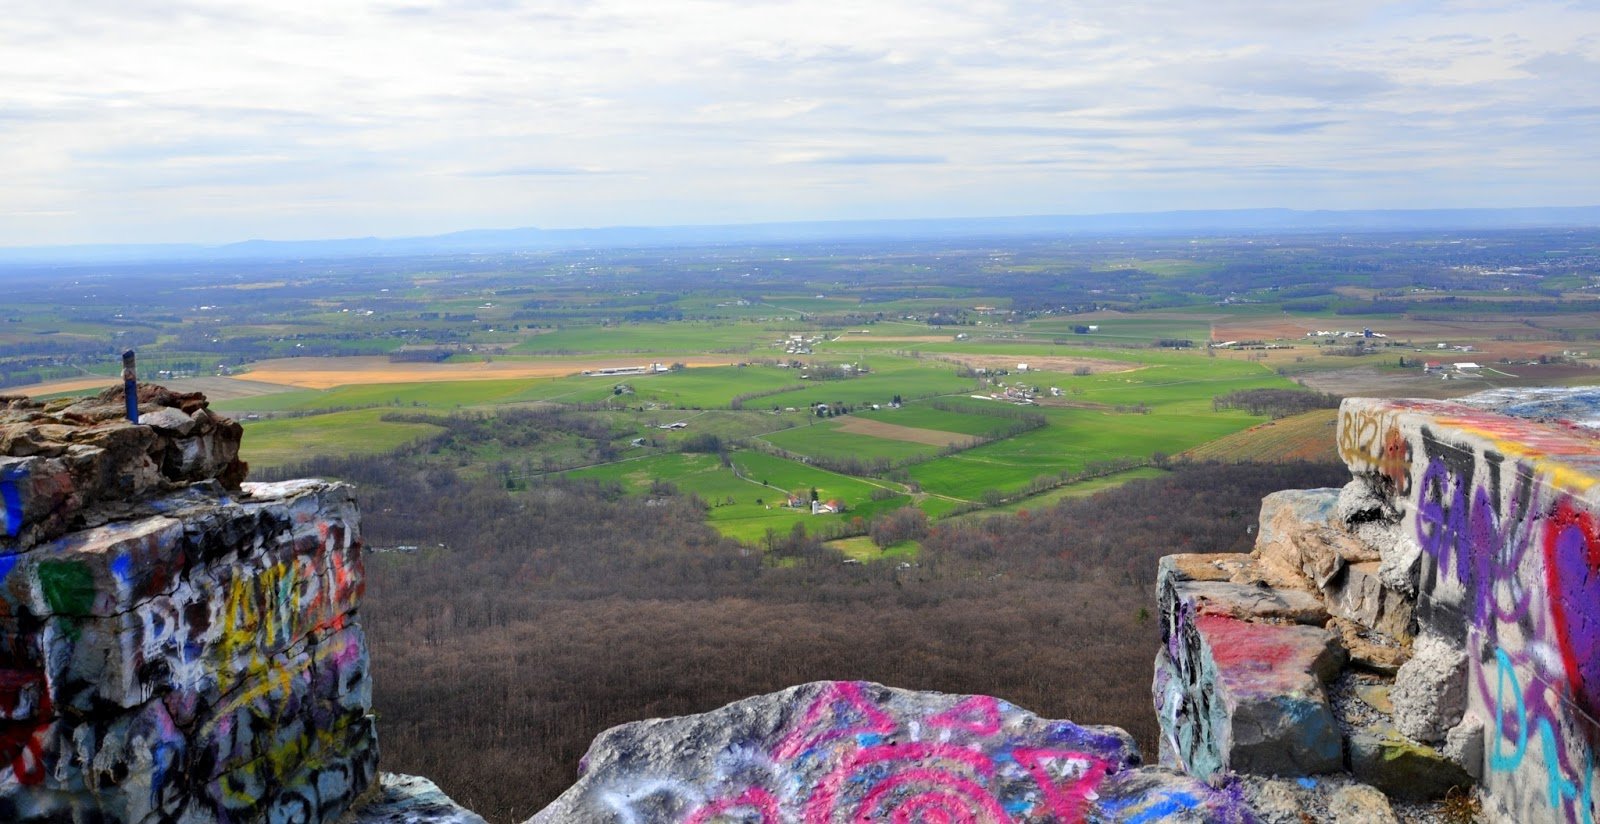
31 and mostly cloudy nooners. 3365 feet at the hogsback lookout of of skyline drive. Very little internet so took 5 min to type this out.
-
@Jns2183 speaking of Philly....this is a screen shot as the X link was not working for me.
-
You could probably monetize your powers.
-
Prepare to face a Blizzard of info to suggest otherwise! A lot of it is expectations, I think. One can argue we have pattern changes on a weekly basis but blue on those 500H anomaly maps does not always mean surface cold will be BN. I also think some (me included) see the best and have a hard time coming down from it.
-
The 8th is quite mild on the GFS and Euro and well above freezing on the CMC. 50's in Philly on the Euro. Still not much in the way of BN temps in the next two weeks as progged by Op's.
-
For Jan 6/7, the 6Z GFS looked like we were about to get spanked with a paste bomb of snow and low 30's for highs and then poof...the departing 50/50 and approaching/forming ridge from above bullies it into submission and its gone. 0Z Icon had an almost Gorilla in the Gulf look and was starting a moisture transport from the Gulf as it rounds the base of a trough in the SE. Snow would have started breaking out near us in the next panel or two...again wet snow as the cold is very marginal. Icon below first and GFS showing the low getting pushed down.
-
Our own homemade ensemble is crashing in front of our eyes if we lose the geese/one member.
-
The 7th appears in the bag. We have the cows, geese and wmsptwx on our side with this one.
-
Lol. They must be taking their queue from the geese.
-
Most of the cows I saw today seemed to be walking in a general south direction.
-
Sorry you are not feeling well. Whether covid, flu, etc.....a lot are sick right now. Bad timing and does suck.
-
He was just saying different so it surprised me. Maybe the geese got to him.
-
Surprised you are giving up on the first two weeks of Jan?
-
The 7th is our best chance in the next 15 days, IMO. Not a good chance but something. "Wall to wall winter" like weather may be off the table until mid or late Jan.
-
Speaking of things I think about when I see your name, the lights at Whitetail are OFF tonight! A bit of a shocker as they had been keeping them on but apparently, they closed the whole operation down for now and sent employees home.
-
He is leading 5-0 heading into the 4th.
-
I saw Devon but 1) They were not open 2). I was not dressed for it.
-
It is hard when we are in January and talking about lack of cold to our north. A disappointment for me as to the current runs as I thought we would have more cold in place by the 6th or 7th but now starting to worry. Take the CMC, the 0Z Suite had highs in the mid 20's for MDT on Jan 7th and had shown similar for several runs in a row. 12Z has low 40's. Yes, Op run caveat but that is quite the cave.