Jns2183
-
Posts
5,851 -
Joined
-
Last visited
Content Type
Profiles
Blogs
Forums
American Weather
Media Demo
Store
Gallery
Everything posted by Jns2183
-
Finally broke 4" for month. That last inch took a damn long time Sent from my SM-G970U using Tapatalk
-
Haha Sent from my SM-G970U using Tapatalk

-
It's been all crazy nocturnal storms this year. It's nuts Sent from my SM-G970U using Tapatalk
-
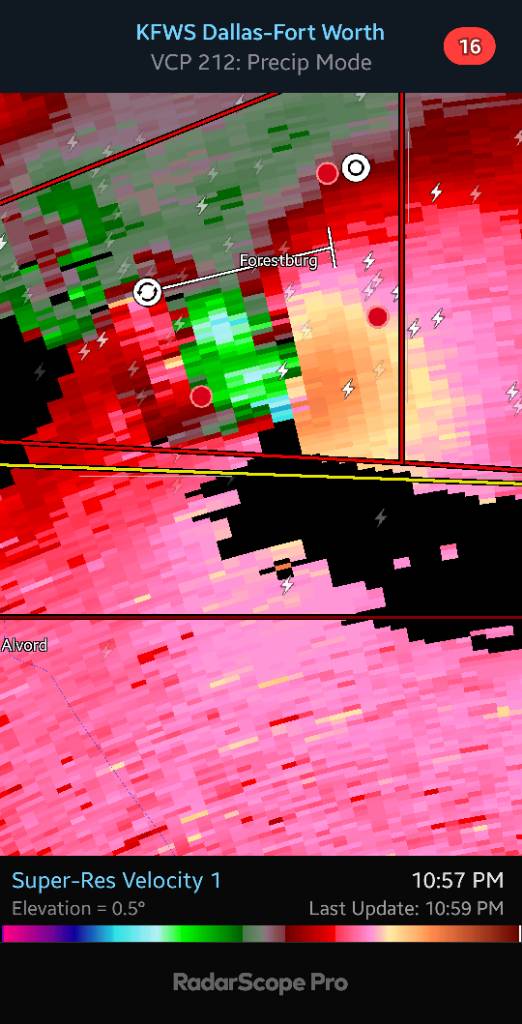
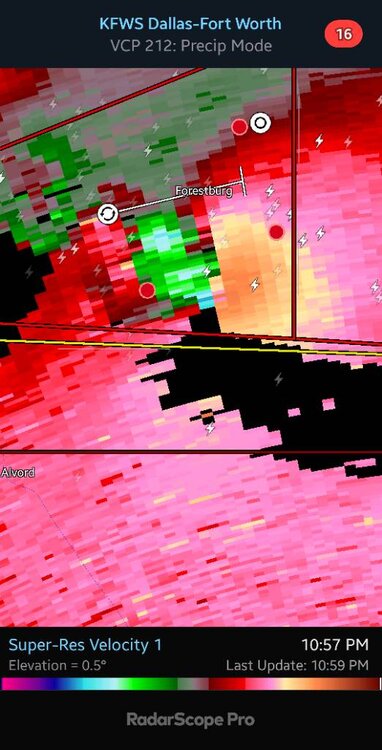
These spotter locations for this tornado in Texas at night are wild Sent from my SM-G970U using Tapatalk
-
Did today bust out in the plains? Sent from my SM-G970U using Tapatalk
-
Camp Hill got 0.4". Where I was at in Perry county 2". I swear the mountains must flood for lots of areas in true south central Pennsylvania to get normal rain Sent from my SM-G970U using Tapatalk
-
Convective snow would be lead to a weenie holocaust Sent from my SM-G970U using Tapatalk
-
I need Texas thunder Sent from my SM-G970U using Tapatalk
-
Without fail Sent from my SM-G970U using Tapatalk
-
Will the south central pa storm forcefield finally break today? Sent from my SM-G970U using Tapatalk
-
Swamp ass showers Sent from my SM-G970U using Tapatalk
-
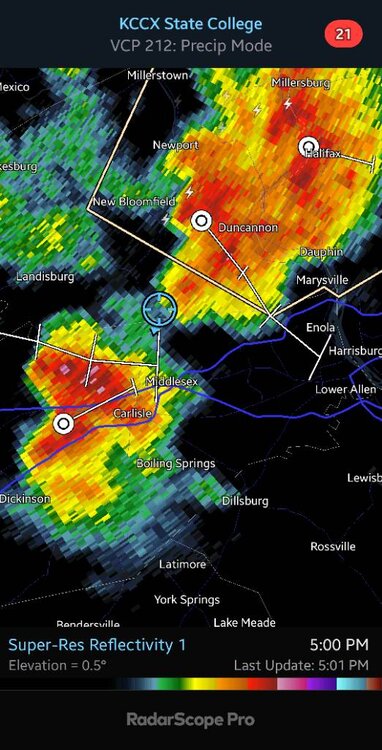
Lightning strikes just south of Carlisle Sent from my SM-G970U using Tapatalk
-
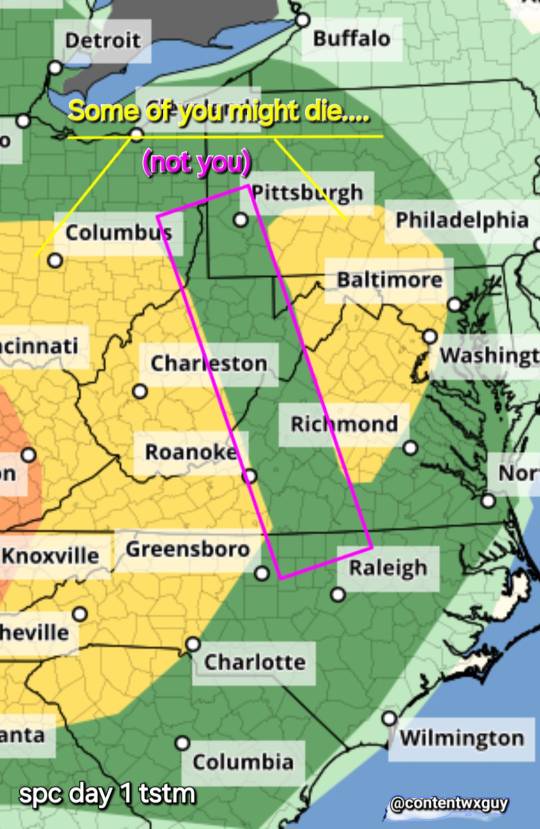
Few but violent? Sent from my SM-G970U using Tapatalk
-
How are the beer prices for those games anymore? Sent from my SM-G970U using Tapatalk
-
Are you going to arts fest at all this weekend? Sent from my SM-G970U using Tapatalk
-
Their are certain times where just reading about your travels makes me exhausted. Probably because I associate all traveling to be with a kid. Sent from my SM-G970U using Tapatalk
-
The storm gods are dead and we killed them Sent from my SM-G970U using Tapatalk
-
Insane traffic Sent from my SM-G970U using Tapatalk
-
I last heard real loud sustaimed thunder in February Sent from my SM-G970U using Tapatalk
-
Saturday looks very rough from OKC to Dallas Sent from my SM-G970U using Tapatalk
-
One of the greatest things I'll drive around across the country from Arizona all the way up here is the metamorphosis that occurs in the landscape and the atmosphere and everything around it. Are you probably know early so much probably one of the best times to do it. I'm sure you'll get some amazing photogenic shots of storms on the plains and going through all the different sceneries of this great nation. Take each night and treat each state like it's a part of you that you're going through so that when you get back here you were able to shed the old you and bring out the new you Sent from my SM-G970U using Tapatalk
-
I know. But to me it being cloudy/rainy on 75% of the days of the month and not being well above normal is like the absolute bitch slap. To be sitting where we are, needing rain to finish average; well that's a nut shot to. It should not take 20+ days of measurable precipitation to break 4". Sent from my SM-G970U using Tapatalk
-
It's even worse because similar to last July it seems we have the patent down pat on having rain/clouds on 15-23days but it just not producing Sent from my SM-G970U using Tapatalk
-
Almost totally shut out on the rain. After that great May start I can't believe I'm going to have to depend on rain over memorial day weekend to not finish below average for the month. Sent from my SM-G970U using Tapatalk
-
Looks like some nasty straight line winds Sent from my SM-G970U using Tapatalk