Jns2183
-
Posts
5,838 -
Joined
-
Last visited
Content Type
Profiles
Blogs
Forums
American Weather
Media Demo
Store
Gallery
Everything posted by Jns2183
-
Pittsburgh got a tornado confirmed Sent from my SM-G970U using Tapatalk
-
Pittsburgh at least gets thunder and lightning even if they walk home 4 straight runs with no strikes thrown in an inning. Sent from my SM-G970U using Tapatalk
-
They have decent big stouts and porters. But there IPAs are all alike Sent from my SM-G970U using Tapatalk
-
What's your beverage Sent from my SM-G970U using Tapatalk
-
You'll be in boat by then Sent from my SM-G970U using Tapatalk
-
I want to see a picture of @canderson grilling in sandals and shorts as it pours rain Sent from my SM-G970U using Tapatalk
-
I curse God daily for being a pirates fan Sent from my SM-G970U using Tapatalk
-
Haha, it's raining in camp hill. I guess the river is a force field Sent from my SM-G970U using Tapatalk
-
Rains coming Sent from my SM-G970U using Tapatalk
-
It got dark Sent from my SM-G970U using Tapatalk
-
At least the power grid has held out Sent from my SM-G970U using Tapatalk
-
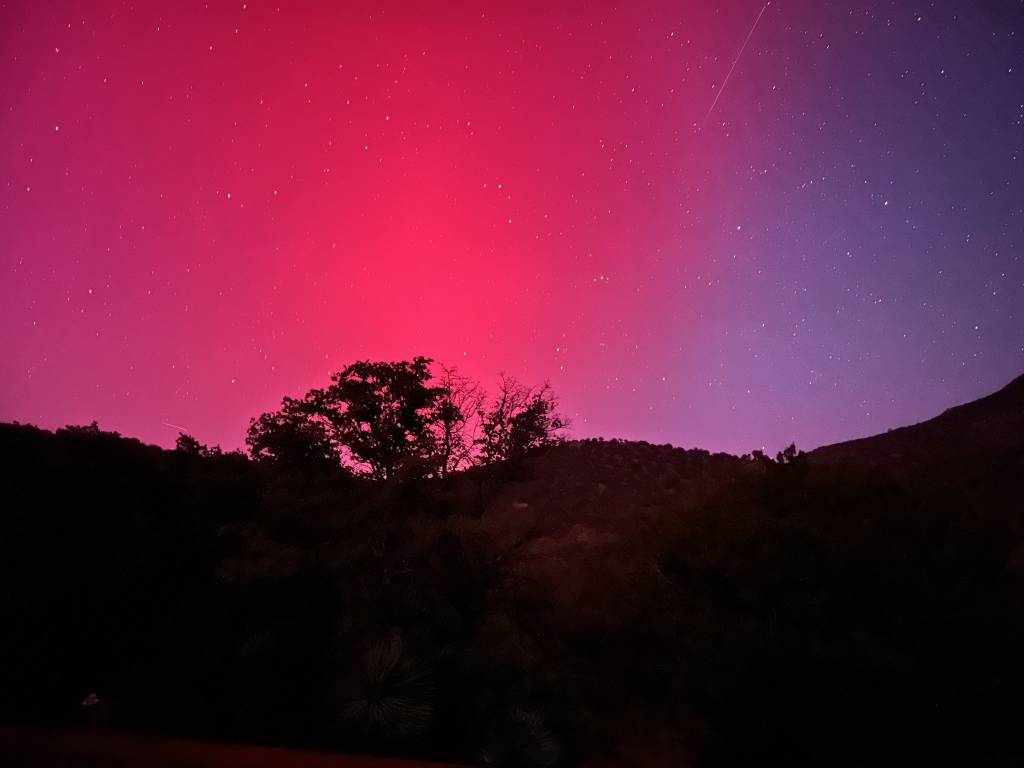
Arizona Sent from my SM-G970U using Tapatalk

-
The day we see that here is the day our entire power grid fails Sent from my SM-G970U using Tapatalk
-
You can usually see them around here once every 10-20 years Sent from my SM-G970U using Tapatalk
-
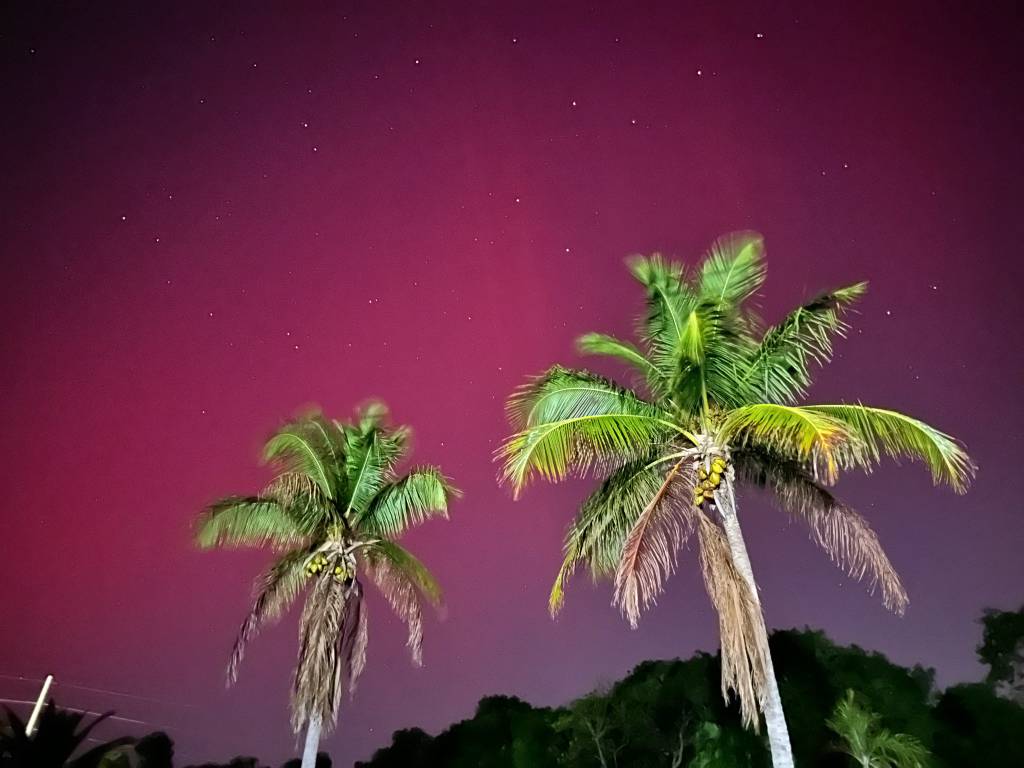
Key largo Sent from my SM-G970U using Tapatalk

-
I stood there until a break and took a 5 second exposure. Lots of pink with that. Clouds definitely have a tint to them. We are screwed for this event because dense Fog going to form as soon as a clouds go away. Sent from my SM-G970U using Tapatalk
-
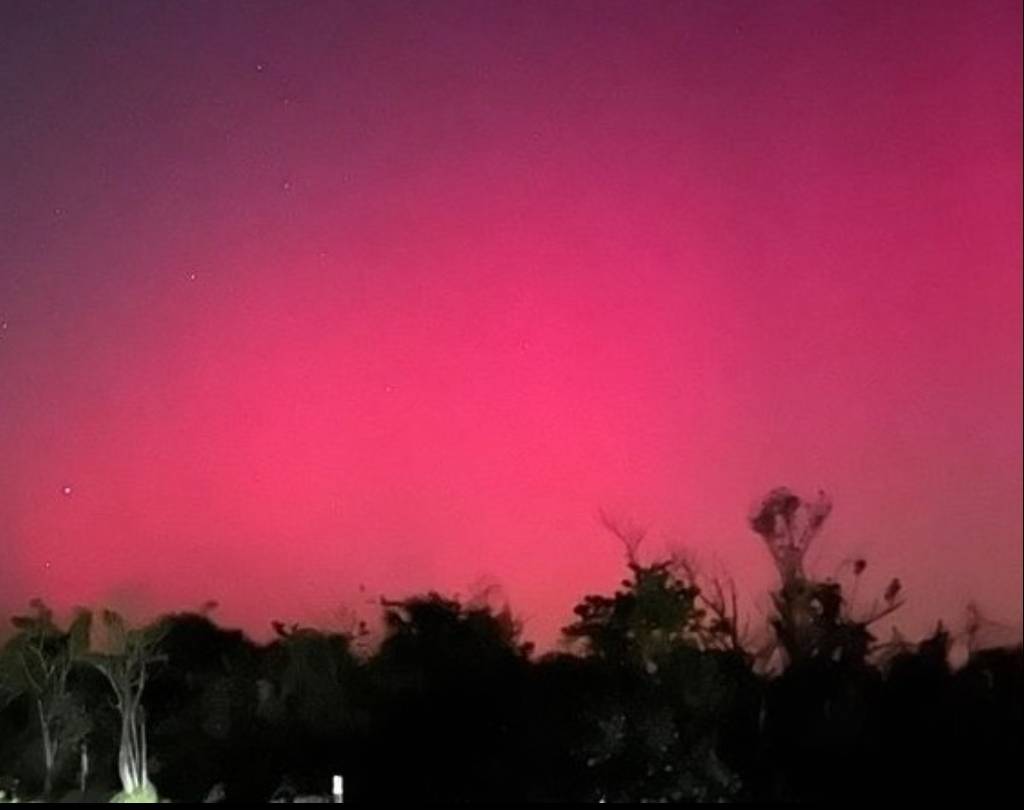
Sanibel Island Florida Sent from my SM-G970U using Tapatalk

-
It's too cloudy here right now but I look to the north away from lights I see it definitely pinkish tint to the clouds Sent from my SM-G970U using Tapatalk
-
And now Texas and Mexico Sent from my SM-G970U using Tapatalk
-
Also Alabama now Sent from my SM-G970U using Tapatalk
-
They're seeing them in Norman Oklahoma and as far south as Georgia so I believe it Sent from my SM-G970U using Tapatalk
-
That rouge super cell formed from nowhere and put down a huge tornado tearing through two towns, one 46,000 people before merging Sent from my SM-G970U using Tapatalk
-
Has anyone gone through NWS spotter training here? I signed up for the 2 hour virtual basic spotter training on May 6th, the 2 hour virtual advanced spotter training on storm science on May 7th, and the two hour virtual advanced spotter training on Radar on May 20th. Just wanted to hear others experiences Sent from my SM-G970U using Tapatalk
-
@Bubbler86 have you begun training for your summer 4am ninja lawn watering? Sent from my SM-G970U using Tapatalk
-
And we can't buy even a rumble here Sent from my SM-G970U using Tapatalk