Jns2183
-
Posts
5,838 -
Joined
-
Last visited
Content Type
Profiles
Blogs
Forums
American Weather
Media Demo
Store
Gallery
Everything posted by Jns2183
-
Did we get backdoored last night? Sent from my SM-G970U using Tapatalk
-
WhAt about his brain surgery bill? Sent from my SM-G970U using Tapatalk
-
59 cloudy. Camp Hill is 63 partly to mostly cloudy Sent from my SM-G970U using Tapatalk
-
Night and day between you and Hershey Sent from my SM-G970U using Tapatalk
-
What's with the super haze this morning Sent from my SM-G970U using Tapatalk
-
We can't buy a good thunderstorm this spring east of the mountains. Only one I've had in many months came in February Sent from my SM-G970U using Tapatalk
-
This nation tends to ignore class differences like an infection that won't go away. Unfortunately the worst you deny them the worst infection you get. I fear we will deny them and solutions too long for a good outcome Sent from my SM-G970U using Tapatalk
-
I don't even care I'm fringed. I'd pay money to see that map become reality and the freakouts Sent from my SM-G970U using Tapatalk
-
Looks like a rainy next 3-4 hours Sent from my SM-X210 using Tapatalk
-
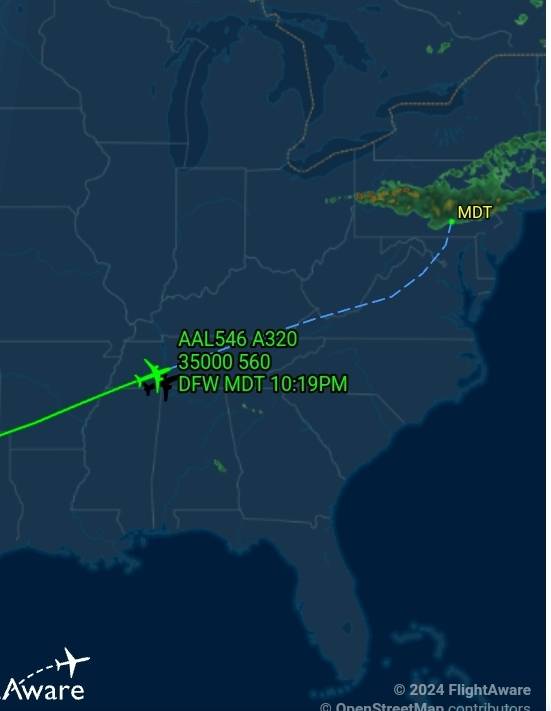
Does he land on time? Anyone want to set a line? Sent from my SM-X210 using Tapatalk
-
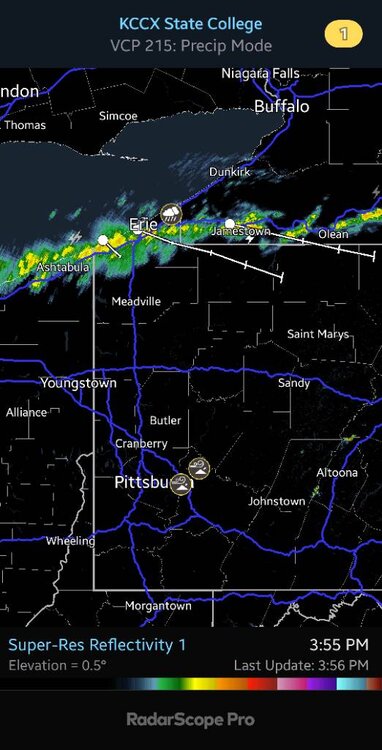
Wind has been crazy strong for radar presentation in camp hill Sent from my SM-X210 using Tapatalk
-
Nice beautiful structure on some of those bolts. No thunder yet. I fear lack of instability will rob me of a nice performance down here. Severe was never in my cards but I was hoping to hear nature's orchestra Sent from my SM-G970U using Tapatalk
-
From Ed Russo at 730 looking north from Harrisburg Sent from my SM-G970U using Tapatalk

-
Looking north from west shore it is pitch black with a few strobes of lightning Sent from my SM-G970U using Tapatalk
-
@canderson flight is scheduled to arrive 2 minutes early so far Sent from my SM-G970U using Tapatalk
-
SSW 25-40 guests. Maybe the big guests were worse yesterday but we seem to have had a 30+ guest every few minutes for hours at this point Sent from my SM-G970U using Tapatalk
-
Wind has been worse today than when we had an advisory yesterday. Especially as the afternoon has gone on. Sent from my SM-G970U using Tapatalk
-
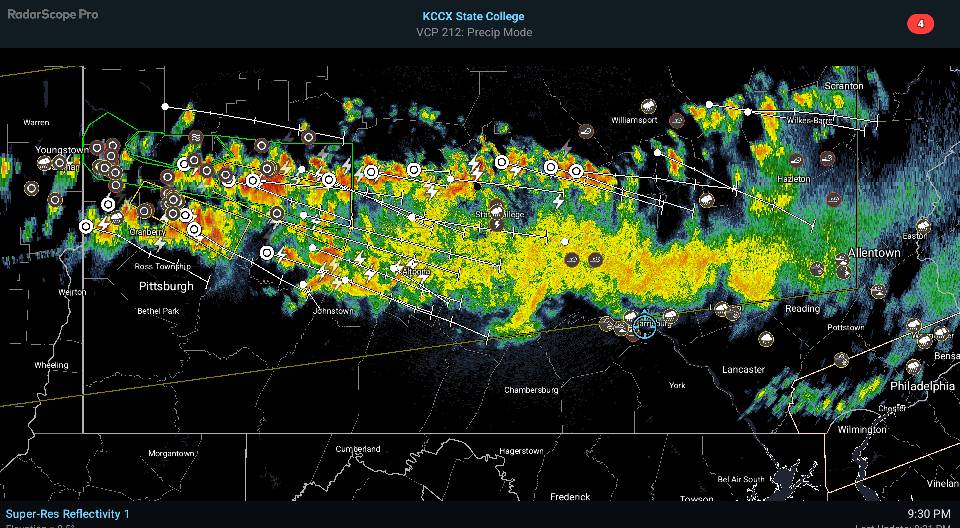
Shes not much to look at yet, but I could she her exploding close to state college Sent from my SM-G970U using Tapatalk
-
I live real close to a giant and enjoy the mix and match 19,2oz of the big IPAs Sent from my SM-G970U using Tapatalk
-
I stick with my 9.5%abv beer like God intended. Sent from my SM-G970U using Tapatalk
-
Dew points seem a bit low vs other enhanced days Sent from my SM-X210 using Tapatalk
-
What's the name Sent from my SM-G970U using Tapatalk
-
We shall see. That's a pretty strong signal for plains severe along with NE/PA severe coming over the top Sent from my SM-G970U using Tapatalk
-
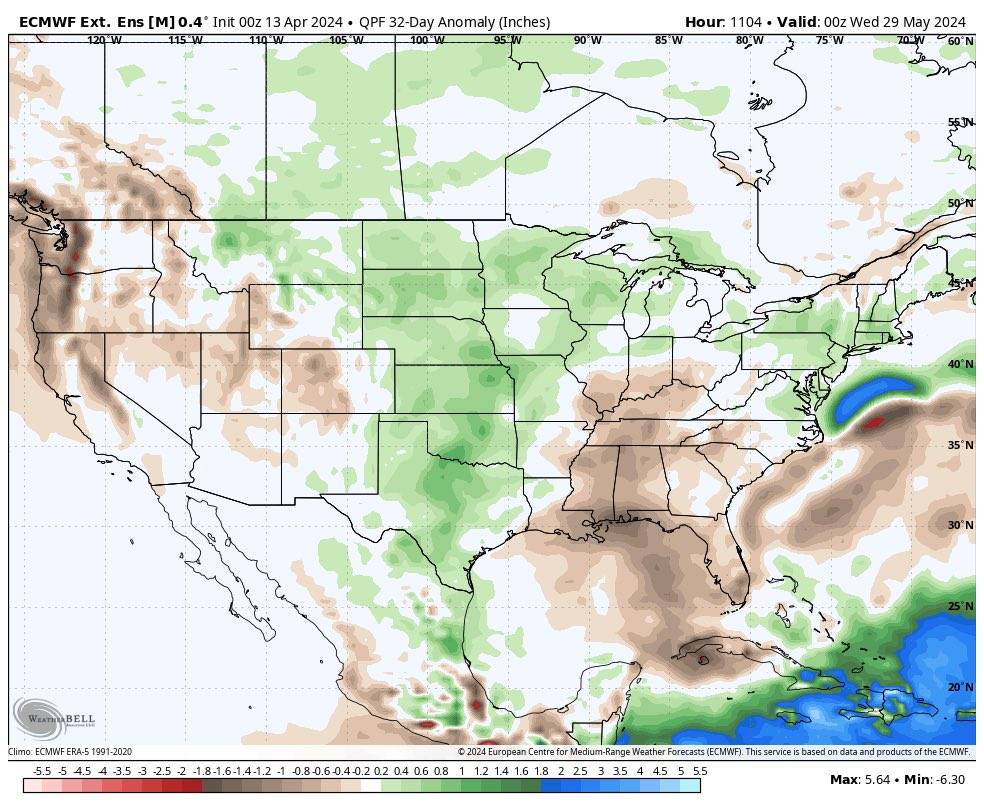
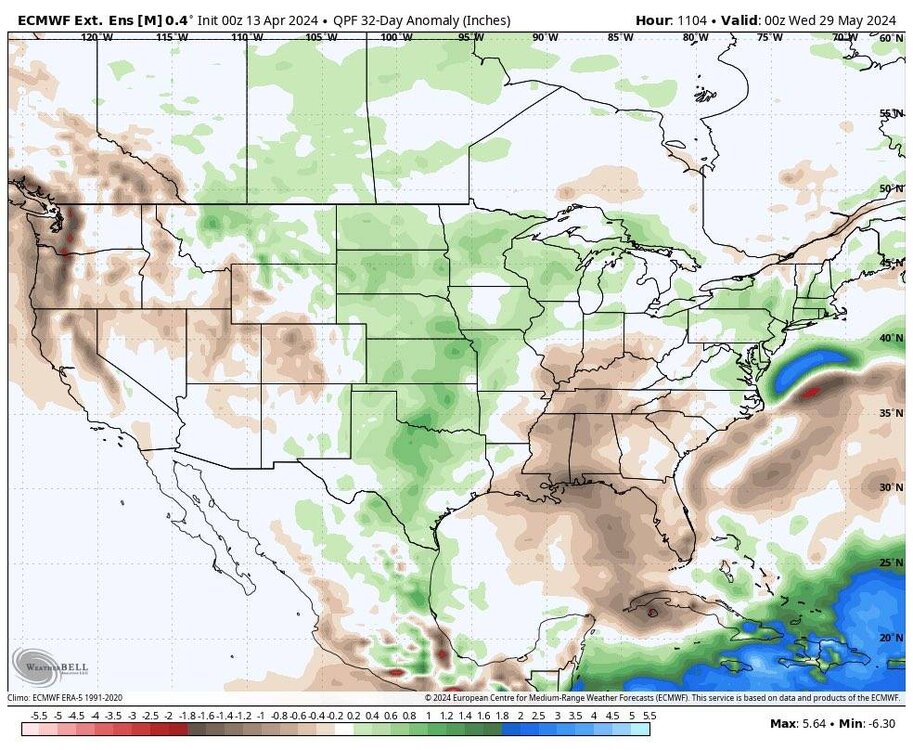
How have the Euro extended weeklies been lately? Here's through May. Sent from my SM-G970U using Tapatalk
-
We really should normalize saying kilosecond instead of 15 minutes. Sounds much cooler. Sent from my SM-G970U using Tapatalk