

Roger Smith
-
Posts
5,927 -
Joined
-
Last visited
Content Type
Profiles
Blogs
Forums
American Weather
Media Demo
Store
Gallery
Everything posted by Roger Smith
-
Predict the temperature anomalies (F deg) relative to 1991-2020 normal values ... for ___ DCA _ NYC _ BOS _ ORD _ ATL _ IAH _ DEN _ PHX _ SEA (deadline 06z Friday Oct 1st )
-
Summer 2021 maximum temperature forecast contest _ results posted
Roger Smith replied to Roger Smith's topic in Mid Atlantic
Contest now declared final, order of finish as follows ... (note rules to break ties as announced June 12th) Scoring: same as other years, the sum of your departures from final seasonal max numbers. However, I will announce in advance that in the case of a tie (for any position) the order will be determined as follows: (a) smallest maximum error (separates 3rd, 4th; 5th, 6th; 7th and 8th below, also 13th-14th from 15th-16th, then also 19th and 20th, and 21st from 22nd-23rd, finally 24th and 25th.) (b) if necessary, second smallest error (defined as smallest of three errors left to separate after (a) eliminated) _ was required to separate 9th and 10th, and 15th, 16th. (c) if still tied, earliest entry (regardless of edit times if applicable since not visible to readers) _ required to separate 13th and 14th which were identical entries, and 17th, 18th as well as 22nd, 23rd which were not identical but survived both (a) and (b) tests. CONTEST RESULTS _ ties broken as per rules above, showing which rule applied in each tiebreaker Rank __ FORECASTER _________ DCA _IAD _BWI _ RIC _______ Total error _________ Outcome ______________ 97 _ 100 __ 99 _ 96 _ 1 ___ tplbge (19) ______________ 98 _ 100 __ 99 _ 100 __________________________________ 1 ___ 0 ___ 0 ___ 4 ____________ 5 _ 2 ___ biodhokie (17) ___________ 97 _ 100 __ 99 _ 102 ___________________________________ 0 ___ 0 ___ 0 ___ 6 ___________ 6 _ 3 ___ GATech (23) _____________ 98 __ 98 __ 98 __ 99 ___________________________________ 1 ___ 2 ___ 1 ___ 3 ____________ 7 _ 4 ___ mattie g (4) ______________98 _ 100 __ 98 _ 101 __________________________________ 1 ___ 0 ___ 1 ___ 5 _____________ 7 _ 5 ___ nw baltimore wx (8) ______98 __ 97 __ 98 __ 99 ___________________________________ 1 ___ 3 ___ 1 ___ 3 ____________ 8 _ 6 ___ A777 (21) _______________ 100 _ 100 _ 100 _ 100 __________________________________ 3 ___ 0 ___ 1 ___ 4 _____________ 8 _ 7 ___ MNTransplant (19) ______ 99 __ 99 _ 101 _ 101 __________________________________ 2 ___ 1 ___ 2 ___ 5 _____________ 10 _ 8 ___ Roger Ramjet (22) ______ 99 _ 100 _ 101 _ 102 ___________________________________2 ___ 0 ___ 2 ___ 6 ____________ 10 _ 9 ___ WxWatcher007 (20) ____ 99 __ 97 _ 100 _ 101 __________________________________ 2 ___ 3 ___ 1 ___ 5 _____________ 11 _10 ___Wxdavis5784 (11) _______ 99 _ 100 _ 103 _ 101 __________________________________ 2 ___ 0 ___ 4 ___ 5 ____________ 11 _11 ___GramaxRefugee (12) ____ 101 _ 102 _ 102 _ 100 ___________________________________4 ___ 2 ___ 3 ___ 4 ____________ 13 _12 ___storm pc (9) ____________ 101 __ 99 _ 103 _ 101 __________________________________ 4 ___ 1 ___ 4 ___ 5 _____________ 14 (13) _ Consensus (mean of 26) _101 _ 101 _ 102 _ 102 ___________________________________ 4 ___ 1 ___ 3 ___ 6 ____________ 14 _13 ___CAPE (1) ________________ 102 _ 100 _ 103 _ 103 __________________________________ 5 ___ 0 ___ 4 ___ 7 ___________ 16 _14 ___WxUSAF (7) _____________102 _ 100 _ 103 _ 103 __________________________________ 5 ___ 0 ___ 4 ___ 7 ___________ 16 _15 ___NorthArlington101 (14) _ 101 _ 100 _ 103 _ 104 _________________________________ 4 ___ 0 ___ 4 ___ 8 ____________ 16 _16 ___yoda (15) _______________ 102 _ 100 _ 102 _ 104 _________________________________ 5 ___ 0 ___ 3 ___ 8 ____________ 16 _17 ___toolsheds (16) __________ 104 _ 100 _ 104 _ 101 __________________________________ 7 ___ 0 ___ 5 ___ 5 ____________ 17 _18 ___Weather53 (25) __________102 _ 101 _ 103 _ 103 ___________________________________ 5 ___ 1 ___ 4 ___ 7 ___________ 17 _19 ___Roger Smith (--) _________101 _ 102 _ 103 _ 104 __________________________________ 4 ___ 2 ___ 4 ___ 8 ___________ 18 _20 ___Rhino16 (3) _____________ 103 _ 101 _ 101 _ 105 __________________________________ 6 ___ 1 ___ 2 ___ 9 ____________ 18 _21 ___SnowenOutThere (24) ___101 _ 104 _ 103 _ 103 __________________________________ 4 ___ 4 ___ 4 ___ 7 ___________ 19 _22 ___wxdude64 (5) ___________ 103 _ 101 _ 103 _ 104 __________________________________ 6 ___ 1 ___ 4 ___ 8 ___________ 19 _23 ___Prince Frederick Wx (10)_ 102 _ 100 _ 105 _ 104 ___________________________________ 5 ___ 0 ___ 6 ___ 8 __________ 19 _24 ___H2O (13) ________________102 _ 103 _ 104 _ 103 __________________________________ 5 ___ 3 ___ 5 ___ 7 ___________ 20 _25 ___MillvilleWx (6) ___________105 _ 102 _ 102 _ 103 __________________________________ 8 ___ 2 ___ 3 ___ 7 ____________ 20 _26 ___vastateofmind (11) ______104 _ 102 _ 104 _ 103 __________________________________ 7 ___ 2 ___ 5 ___ 7 ____________ 21 _27 ___George BM (2) __________107 _ 106 _ 107 _ 108 __________________________________10 ___ 6 ___ 8 ___ 12 ___________ 36 ___________________________________________________________________ (Numbers in brackets after forecaster name indicate order of entry). ===================================================== Congrats to tplbge (or as I cannot pronounce your name and need something familiar, triple bogey). Brave try for second place biodhokie who got three of four right on. Tiebreaker required to establish third place (GA tech) and fourth (mattie g). _ until next summer, stay cool _ -
This contest is now declared final, congrats to ** wxallannj in first place (total 30 error points) ** hudsonvalley21 in second (total 32 error points) ** BKViking in third (total 33 error points) (Tom only forecaster to have two of the ten locations without error points, most of us had one).
-
2021 North Atlantic hurricane forecast contest
Roger Smith replied to Roger Smith's topic in Tropical Headquarters
Tracking actual scores as the contest approaches its end phase The scoring system was explained earlier, basically you lose only half as many points from your base score of 100 for named storm errors as you lose for hurricane and major errors. The named storm error reduction is one quarter the value of (error) + (error squared). For example, you lose 1.5 for an error of 2 ... ( 2 + 4 ) / 4 That same error for hurricanes or majors would cost you three points ( 2 + 4) / 2. To make the scoring a bit easier to follow, I will arbitrarily assign 40 to named storms and 30 each to hurricanes and majors. You can go into negative scoring territory, but no forecast is currently there. This is the same as applying all three reductions to 100 but gives us a visual comparison for the three categories. These scores are now in scoring order for the current count. Tracking the scores as we approach the end, you will see your current score from the known count (sometimes including 2-4 day forecast developments which will be tagged and adjusted if they don't come to pass). Then off to the right of your current score will be potential scores for the next two systems in whatever combination they appear -- they can only add 1 0 0, 1 1 0, 1 1 1, then 2 0 0, 2 1 0, 2 1 1, 2, 2, 0, 2 2 1 or 2 2 2 so there will be nine potential scores. And of course, there could be more than two more systems so even this won't tell you everything about final outcomes (by November it might). note: scores in the table currently based on 21/7/4 after Wanda's recent designation. ... also 21/8/4 score was retained in the table in case Wanda became a hurricane (it did not but I left the column in for your interest, or in case there's a last minute re-classification about that or any other system in the contest year) ... those would become current contest scores if so and 21/7/4 scores would be removed from table. __ __ FC = future counts (possible) for remaining 22 storm outcomes ___ ___ ___ current contest scores are in green (first total scoring column) FORECASTER __________ Predictions __ Scores (40 30 30 TOT) 2174 (2184) __ 2274 2284 2285 2294 2295 1 wxdude64 _____________19 ___ 7 ___ 4 _____ 38.5 _30 __30__ 98.5 _ (97.5)___ 97.0_ 96.0_ 95.0_ 94.0_ 93.0_ 2 J_Keith_Lee ___________ 21 ___ 9 ___ 4 ______40 __ 27 __30__ 97.0_ (99.0) ___ 96.5_ 98.5_ 97.5_ 99.5_ 98.5_ t3 IntenseWind002 _______22 ___ 9 ___ 4 _____39.5 _27 __30 __ 96.5_ (98.5) ___97.0_ 99.0_98.0_100.0_99.0 t3 WxWatcher007 _______ 20 ___ 9 ___ 4 ______39.5 _27 __30__ 96.5_ (98.5)___ 95.5_ 97.5_ 96.5_ 98.5_ 97.5_ t3 BKViking ______________ 20 ___ 9 ___ 4 _____ 39.5 _27 __30__ 96.5_ (98.5) ___ 95.5_ 97.5_ 96.5_ 98.5_ 97.5_ t5* snowlover2 ____________18 ___ 8 ___ 4 ______ 37 __29 __30__ 96.0 _ (97.0)___ 94.0_ 95.0_ 94.0_ 94.0_ 93.0_ t5* Iceresistance __________18 ___ 7 ___ 3 _______ 37 __30 __29__ 96.0 _ (95.0)___ 94.0_ 93.0_ 91.0_ 91.0_ 89.0_ 7 NCforecaster89 _______19 ___ 9 ___ 4 _______38.5 _27 __30 __ 95.5_ (97.5)___ 94.0_ 96.0_ 95.0_ 97.0_ 96.0_ 8 Tom ___________________19 ___ 9 ___ 3 _______ 38.5 _27 __29 __ 94.5_ (96.5)___ 93.0_ 95.0_ 93.0_ 96.0_ 94.0_ 9 TexMexWx ___________ 18 ___ 9 ___ 4 _______ 38.5 _27 __30 __ 94.0 _ (96.0)__ 92.0_ 94.0_ 93.0_ 95.0_ 94.0_ (t 9) _ "Expert consensus" _17 ___ 8 ___ 4 _______35 __ 29 __30 __ 94.0 _(95.0)___ 91.5_ 92.5_ 91.5_ 91.5_ 90.5_ t10 Newman _____________ 21 __ 10 ___ 5 ________40 __ 24 __29__ 93.0_ (96.0) ___ 92.5_ 95.5_ 96.5_ 97.5_ 98.5_ t10 CatLady ______________ 18 ___ 9 ___ 3 _______ 37 __ 27 __29__ 93.0 _(95.0) ___ 91.0_ 93.0_ 91.0_ 94.0_ 92.0_ t10 TARCweather _________ 17 ___ 8 ___ 3 _______ 35 __ 29 __29__ 93.0_ (94.0) ___ 90.5_ 91.5_ 89.5_ 90.5_ 88.5_ ____ NOAA median _____ 16.5 ___8 ___ 4 ________ 36.1__29 __30__ 92.8 _(93.8)___ 90.1 _ 91.1_ 90.1 _ 90.1_ 89.1_ __ consensus __________ 19.2 _ 9.8 __ 4.7 _____ 38.7_24.7 _29.4__ 92.8_(95.6)___ 91.4_ 94.2_ 94.6_ 96.0_ 96.4_ t13 RJay _________________20 __ 10 ___ 5 _______ 39.5 _24 __29 __ 92.5_ (95.5) ___ 91.5_ 94.5_ 95.5_ 96.5_ 97.5_ t13 magpiemaniac _______19 __ 10 ___ 4 _______ 38.5 _24 __30 __ 92.5_ (95.5) ___ 91.0_ 94.0_ 93.0_ 96.0_ 95.0_ 15 cptcatz ________________17 ___ 9 ___ 4 _______ 35 __ 27 __30 __ 92.0 _(94.0)___ 89.5_ 91.5_ 90.5_ 92.5_ 91.5_ 16 Looking to the skies __ 19 ___ 8 ___ 7 _______ 38.5 _ 29 __24 __ 91.5_ (92.5)___ 90.0_ 91.0_ 94.0_ 90.0_ 93.0_ 17 NorthHillsWx _________ 17 ___ 9 ___ 3 ________ 35 __ 27 __29 __ 91.0 _(93.0)___ 88.5_ 90.5_ 88.5_ 91.5_ 89.5_ 18 Rhino16 _______________ 17 __ 10 ___ 4 _______ 35 __ 24 __30 __ 89.0 _ (92.0)___ 86.5_ 89.5_ 88.5_ 91.5_ 90.5_ 19 Yoda __________________ 16 ___ 9 ___ 5 _______ 32.5 __27__29 __ 88.5 _(90.5)___ 85.5_ 87.5_ 88.5_ 88.5_ 89.5_ 20 Ldub ___________________19 __ 11 ___ 5 ________ 38.5 _ 20__29 __ 87.5_ (91.5) ___ 86.0_ 90.0_ 91.0_ 93.0_ 94.0_ 21 hudsonvalley21 _______ 21 __ 11 ___ 6 ________ 40 __ 20__ 27 __ 87.0_ (91.0) ___ 86.5_ 90.5_ 92.5_ 93.5_ 95.5_ t22 LoboLeader1 __________15 ___ 9 ___ 4 ________ 29.5__27__30 __ 86.5 _(88.5)___ 83.0_ 85.0_ 84.0_ 86.0_ 85.0_ t22 Southmdwatcher _____ 22 __ 11 ___ 6 ________ 39.5 _20 __27 __ 86.5_ (90.5) ___ 87.0_ 91.0_ 93.0_ 94.0 _96.0 24 Brian5671 _____________ 20 __ 12 ___ 2 ________ 39.5 _ 15 __27 __ 81.5_ (86.5) ___ 80.5_ 85.5_ 82.5_ 89.5_ 86.5_ 25 DonSutherland1 ________19 __ 12 ___ 6 ________ 38.5 _ 15 __27 __ 80.5_ (85.5) ___ 79.0_ 84.0_ 86.0_ 88.0_ 90.0_ 26 Roger Smith ___________ 23 __ 13 ___ 7 ________ 38.5 __ 9 __24 __ 71.5_ (77.5) ___ 72.5_ 78.5_ 81.5_ 83.5 _86.5 27 Prospero _______________14 __ 11 ___ 7 __________26___ 20 __24 __ 70.0 _(74.0)___ 66.0_ 70.0_ 73.0_ 73.0_ 76.0_ 28 Tezeta _________________ 23 __ 14 ___ 7 ________38.5 __ 2 __24 __ 64.5_ (71.5) ___ 65.5_ 72.5_ 75.5_ 78.5 _81.5 29 Macintosh _____________ 25 __ 14 __ 10 _______ 35 ___ 2 ___ 9 __ 46.0_ (53.0) ___ 48.0_ 55.0_ 61.0_ 61.0 _67.0 (scoring S H M counts) ______________________________________2174 _ (2184) _____2274_2284_2285_2294_2295_ reductions for error (H, M 30) 1 3 6 10 15 21 28 (S 40 minus 0.5 1.5 3.0 5.0 7.5 10.5 14.0) * note: ranks for non-member forecasts (NOAA, expert consensus, and consensus) do not change contest ranks. * note also ranks after t3 (three forecasts) jog by one position upward, as two of the forecasts in that group of three are identical, so as a contest entrant points out, further ranks should perhaps be for distinct forecast entries rather than numbers of people. So there are 29 ranks now for 30 forecasts. Future possible count scoring leaders in bold type. _________________________________________________________________ THIS TABLE WILL BE UPDATED AFTER EACH NEW STORM. Oct 31 update _ The count is now 21 7 4 as shown, and remaining options for 21 8 4 and five possible outcomes for 22 storms are now in the table. The situation for counts of 23 can be reviewed in another post (scroll down) at this point. -
With regard to that listing of 80 degree seasons at NYC, here's a breakdown of the 30-year averages. This shows both 1871-1900 and 1869-1900 which have the same averages within 0.1 (A), then 1901-30 (B), 1931-60 (C), 1961-90 (D) and 1991-2020 (E). The overall average of 152 seasons is also shown in bold type (F). The calendar dates shown are for non leap years, go one day earlier to apply to leap years. I derived an actual average duration (of 80 and + seasons) for all leap years and found that it was almost five days shorter (duration) than the overall data, so one would expect the actual leap year data set to have narrower extremes. However the sample size may account for that kind of internal variation in the data. 80 and + seasons ________________________________________ >80 seasons ____________________ _____________ A ______ B ____ C ____ D ____ E ____ F ________ A _____ B _____ C _____ D _____ E _____ F start date _ May 3 _ Apr 30 _ Apr 30 _ Apr 21 _ Apr 20 _ Apr 27 <<>>May 6 _ May 4 __ Apr 30 _ Apr 22 _ Apr 23 _ Apr 29 end date __ Sep 24 _Sep 30 _Oct 10 _ Oct 5 _ Sep 30 _ Oct 2 <<..>>Sep 19 _ Sep 28 _ Oct 7 __ Oct 3 __ Sep 26 _ Sep 28 duration ___ 143 __ 153 ___ 162 ___ 166 __ 162 __ 157 <<....>> _135 __ 146 ___ 159 ___ 163 __ 154 __ 151 __________________ Some interesting trends emerge from this. The season was getting longer until around the 1960s, but while the onset continued to advance or at least remain static, the end of these seasons began to pull back towards the earlier termination dates seen around the second interval 1901-30. My guess is that it won't continue to do that for 2021-50, but the phenomenon of record warmth in late autumn seems to have peaked around the 1960s while that of early spring warmth has shown a tendency to be more evenly distributed since about 1930. The differential between 80 and + and the >80 seasons was smaller when they lasted longer, and I noticed while compiling the table a tendency for quite a few years to end with a much higher reading than 80, a few actually ended their 80+ or >80 seasons with a 90 degree reading. By the way, the longest 90 deg season was way back in 1927 (first date Apr 20, 90F and last Oct 2, 90F). That was a season of 164 days. The second longest was 1939 (first May 7, 92F and last Oct 10, 91F). That season was 155 days. 2010 went from Apr 7 to Sep 9 but had an 89 deg reading on Sep 26.
-
Occasional Thoughts on Climate Change
Roger Smith replied to donsutherland1's topic in Climate Change
Is there any research on connections between the increasing greenhouse gas concentrations and the El Nino or more broadly the SOI ? Reason I ask is that a lot of the more recent warmings (since 1980) seem to be driven by strong El Nino events, so is there any reason to think that greenhouse gases can influence that cycle? Not trying to say that the recent warming is just a natural product of strong El Nino events because I can see the broader warming signal but it would be interesting to know if anyone has looked into this aspect. Also, related question, what are peoples' thoughts on air mass modification? Is the warming entirely due to a shift in air mass frequency or is it a combination of that and air mass modification? My subjective opinion on that is that air masses are being modified at a lower rate than the overall warming, which relies more on the shift in frequency. As we saw in Feb 2015, if cold arctic air can dominate a month, then it turns out almost as cold as record months of the past. But that frequency of arctic air that we "enjoyed" (perhaps the wrong word) up to around the early 1980s has definitely dropped off in recent decades. -
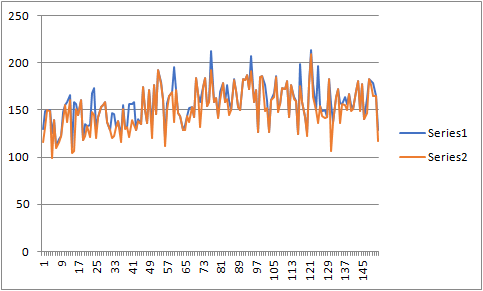
1882 is probably the winner, at NYC the first 80F reading was May 31 and the last one was Sep 20. That is 111 days using the counting method in the tables already posted by others (it works out to the number of days between the end dates so not including either of them, if you included both of the end dates, then 113 days). 1875 is probably second, at NYC the first 80F reading was May 20 and the last one was September 10. That is 112 days (or 114 counting both end dates). That latter (Sept 10) is not an extreme earliest date for termination of the 80 or + season, 1902 (Sept 2), 1876 (Sept 4) and 1871 (Sept 6) finished earlier, but 1871 had a much earlier onset with 85F on April 8 and therefore longer seasons. The extreme for latest onset appears to be June 7 (1924) followed by May 31 (1882); also later than 1875 was May 25 (in 1873) but that season terminated on Sep 29 (lasting 15 days longer than 1882), also 1898 started its season on May 20 but went into early October to reach 137 days. 1988 began its season May 23, 1904 began its season on May 24, 1916 and 1946 on May 25, 1920 and 1999 on May 28. In 1869 with some missing data but likely much cooler than 80F from maps available, the first 80 deg day is also May 13 and the first to exceed 80 was May 26. 1883 joins the group for the >80F short duration because the season ended in late August but after some very cool weather for most of the autumn an outlier 80F occurred on Oct 14 so this year did not make the first table, as I show in the following tables (80 or higher seasons shorter than 135 days in table 1, >80 seasons shorter than 125 days in table 2): (I have used the same convention for counting dates between the first and last 80 or + and (>80) as shown in other tables above, which I worked out to be the number of days between the start and end date, not counting either of them. The actual duration of the season adds two days (the end points) to my values and those in the other tables above.) Table 1: SHORTEST DURATIONS OF (80 or +)F MAX at NYC 1882 ________ 80 May 31 ___ 84 Sep 20 __________ 111d (152-262) 1875 ________ 80 May 20 ___ 80 Sep 10 ___________112d (141-252) 1887 ________ 85 May 11 ___ 85 Sep 7 ____________ 118 d (132-249) 1876 ________ 87 May 7 ____ 80 Sep 4 ____________119d (129-247)* 1924 ________80 June 7 ____ 81 Oct 6 ____________ 120d (160-279) 1877 ________ 82 May 15 ___ 81 Sep 16 ___________ 123d (136-258) 1904 ________ 86 May 24 ___ 80 Sep 25 __________ 123d (146-268)* 1984 ________ 81 May 23 __ 86 Sep 25 ___________ 124d (145-268)* 1873 ________ 80 May 25 ___ 80 Sep 29 __________ 126d (146-271) 1966 ________ 83 May 6 ____ 82 Sep 11 ___________ 127d (127-253) 1971 ________ 84 May 11 ____ 86 Sep 16 __________ 127d (132-258) (78 on Oct 29) 1988 ________ 83 May 23 ___ 80 Sep 28 __________ 127d (145-271)* 1899 ________ 84 May 1 ____ 82 Sep 8 ____________ 129d (122-250) (79 on Oct 18) 1911 _________ 83 May 18 ___ 86 Sep 25 __________ 129d (139-267) 1932 ________ 83 May 16 ___ 86 Sep 23 __________ 129d (138-266)* 2020 ________ 80 May 3 ___ 82 Sep 10 ___________ 129d (125-253)* 1869 ________ 80 May 12 ___ 86 Sep 20 __________ 130d (133-262) 1893 ________ 80 May 11 ___ 82 Sep 19 ___________ 130d (132-261) 1902 ________ 84 Apr 22 ___ 82 Sep 2 ____________ 132d (113-244) 1906 ________ 84 May 13 ___ 80 Sep 23 __________ 132d (134-265) 1907 ________ 85 May 14 ___ 83 Sep 24 __________ 132d (134-265) 1889 ________ 81 May 6 ____ 82 Sep 17 ___________ 133d (127-259) 1918 ________ 90 May 6 ____ 80 Sep 17 ___________ 133d (127-259) 1890 ________ 80 May 1 ____ 83 Sep 13 ___________ 134d (122-255) 1933 ________ 80 May 15 ___90 Sep 27 ___________ 134d (136-269) 1888 ________ 83 Apr 29 ___ 80 Sep 12 ___________ 135d (121-255)* * leap year, date count one higher for calendar dates Table 2: SHORTEST DURATIONS OF >80F MAX at NYC __ duration (dates between end points) 1873 ________ 87 May 28 ___ 87 Sep 5 ___________ 99d (149-247) 1882 ________ 83 June 7 ___ 84 Sep 20 _________ 104d (159-262) 1883 ________ 81 May 8 ____ 88 Aug 23 _________ 106d (129-234) 1999 ________ 81 May 28 ___ 81 Sep 12 _________ 106d (149-254) 1875 ________ 86 May 21 ___ 84 Sep 9 __________ 110d (142-251) 1924 _______ 81 June 15 ___ 81 Oct 6 ___________ 112d (168-279) 1876 ________ 87 May 7 ____ 87 Sep 1 ___________ 116d (129-244)* 1869 ________ 86 May 26 ___ 86 Sep 20 ________ 116d (147-262) 2020 ________84 May 15 ___ 82 Sep 10 _________ 117d (137-253)* 1887 ________ 85 May 11 ___ 85 Sep 7 ___________118d (132-249) 1893 ________ 85 May 21 ___ 82 Sep 19 _________120d (142-261) 1900 ________ 84 May 14 ___ 86 Sep 12 ________ 120d (135-254) 1918 ________ 90 May 6 ____ 81 Sep 4 __________ 120d (127-246) 1890 ________ 81 May 14 ___ 83 Sep 13 _________ 121d (135-255) 1908 ________ 81 May 12 ___ 81 Sep 11 __________ 121d (134-254)* 1888 ________ 83 Apr 29 ___ 83 Aug 30 _________ 122d (121-242)* 1901 ________ 85 May 24 ___ 81 Sep 24 _________ 122d (145-266) 1988 ________ 83 May 23 ___ 82 Sep 23 _________122d (145-266)* 1877 ________ 82 May 15 ___ 81 Sep 16 __________123d (136-258) 1984 ________ 81 May 23 __ 86 Sep 25 _________ 124d (145-268)* * leap year, date count is one higher than other years for same calendar dates ------------------------------------------------------------------------------ Earliest and Latest 80 deg max in graphical format (advance of the extremes) _________ 1871 Apr 8 ________ 1879 Oct 16 _______ 1892 Apr 4 __________1897 Oct 16 _____ 1917 Apr 1** __________ 1908 Oct 16 _____ ** 1910 Mar 30 (78) close __1921 Mar 21 ___________________ 1919 Oct 28 _ 1945 Mar 20 ___________________ 1946 Oct 31** ___ **1938 Nov 7 (78) close _ (1990 Mar 13) ___________________1950 Nov 2 (1974 Nov 1) _ 1990 Mar 13 ______________________ 1993 Nov 15 close out of season attempts to stretch the limits ... _ 79 Mar 10, 2016 ___________________ 77 Nov 20, 1985 _ 78 Feb 21, 2018 ____________________ 75 Dec 7, 1998 ============================================== List of the longest seasons for 80 or higher, in successive increases over past seasons 166d _ 1881 _ Apr 24 to Oct 8 168d _ 1891 _ Apr 19 to Oct 5 173d _ 1892 _ Apr 4 to Sep 25 174d _ 1914 _ Apr 19 to Oct 11 176d _ 1919 _ May 4 to Oct 28 192d _ 1921 _ Mar 21 to Sep 30 195d _ 1928 _ Apr 5 to Oct 18 212d _ 1945 _ Mar 20 to Oct 19 (207d)_1963 _ Apr 2 to Oct 27 214d _ 1990 _ Mar 13 to Oct 14 ________________________________________ Other seasons 180d or longer: 1985 (199); 1993 (197); 1961 (187); 1968, 1974 (186); 1967 (185); 1938, 1942 (184); 1955, 1959, 1998, 2016 (183); 1960 (182); 1979, 2011, 2017 (181); 1922 (180) To tie the record set in 1990, 2021 will need to record 80 F or higher on October 27 (first reading was 82F Mar 26). To match fourth place 1985, 2021 will need to record 80F or higher on October 12. _________________________________________ Most of the short seasons were before 1905, but a few have happened in more recent years. Oddly, some rather hot summers join this list (1901, 1966 and 1988 can all be found). Hoping this graph will copy from my excel file where I did this analysis. 1869 - 2020 Duration (days) of 80 deg seasons (blue is 80 or +, orange is >80) ... Many years have the same durations for these (if end points are >80)
-
CONTINUED REPORT ON WEEKLY EXTREMES for WEEKS ENDING IN DECEMBER Intervals _______________ Highest values 1869-2021 __ Lowest values 1869-2021 Nov 25 - Dec 1 __________ (max) 63.29 _ 2001 _____ (max) 31.71 _ 1903 (31.86 1882) Nov 25 - Dec 1 ___________ (min) 51.57 _ 2001*_____ (min) 21.14 _ 1871 (21.71 1875) _ * 47.14 _ 2011 Nov 25 - Dec 1 __________ (mean) 57.43 _ 2001 _____ (mean) 27.50 _ 1903 (28.14 1871) _ the wettest week ending Dec 1 was 1889 (3.44"). Nov 26 - Dec 2 __________ (max) 61.43 _ 2001 _____ (max) 32.57 _ 1882 (32.86 1903) Nov 26 - Dec 2 ___________ (min) 50.14 _ 2001 _____ (min) 19.00 _ 1875 (20.14 1871) Nov 26 - Dec 2 __________ (mean) 55.79 _ 2001 _____ (mean) 26.79 _ 1871 (27.57 1875) _ the wettest week ending Dec 2 was 1996 (3.80") _ included 0.1" snow. Nov 27 - Dec 3 __________ (max) 60.71 _ 1998*_____ (max) 31.71 _ 1871 _ * 60.43 _ 2001 Nov 27 - Dec 3 ___________ (min) 49.00 _ 2001 _____ (min) 16.43 _ 1875 (19.71 1871) Nov 27 - Dec 3 __________ (mean) 54.79 _ 2001 _____ (mean) 24.79 _ 1875 (25.71 1871) _ the wettest week ending Dec 3 was 1889 (3.17") _ included 0.5" snow. Nov 28 - Dec 4 __________ (max) 64.29 _ 1998*_____ (max) 30.86 _ 1871 _ * 61.57 _ 2001 Nov 28 - Dec 4 ___________ (min) 49.29 _ 1998*_____ (min) 16.00 _ 1875 (19.71 1871) _ * 49.14 _ 2001 Nov 28 - Dec 4 __________ (mean) 56.79 _ 1998* _____ (mean) 24.07 _ 1875 _ *55.36 _ 2001 _ the wettest week ending Dec 4 was 2016 (3.00"). Nov 29 - Dec 5 __________ (max) 64.29 _ 1998*_____ (max) 30.86 _ 1875 _ * 62.29 _ 2001 Nov 29 - Dec 5 ___________ (min) 51.00 _ 1998*_____ (min) 16.14 _ 1875 (19.00 1976) _ *49.43 _ 2001 Nov 29 - Dec 5 __________ (mean) 57.64 _ 1998*_____ (mean) 23.50 _ 1875 _ * 55.86 _ 2001 _ the wettest week ending Dec 5 was 2016 (3.19"). Nov 30 - Dec 6 __________ (max) 65.14 _ 1998*_____ (max) 29.57 _ 1875 _ * 64.29 _ 2001, 61.43 _ 1982 Nov 30 - Dec 6 ___________ (min) 52.43 _ 1982*_____ (min) 19.00 _ 1875 (19.29 1976) _ * 51.14 _ 1998 Nov 30 - Dec 6 __________ (mean) 58.14 _ 1998*_____ (mean) 24.29 _ 1875 _ * 56.93 _ 1982, 57.64 _ 2001 _ the wettest week ending Dec 6 was 1996 (3.12"). Dec 1 - Dec 7 ___________ (max) 67.29 _ 1998*_____ (max) 28.71 _ 1886 _ * 63.43 _ 2001, 61.57 _ 1982 Dec 1 - Dec 7 ____________ (min) 52.29 _ 1982*_____ (min) 15.43 _ 1926 _ * 51.14 _ 1998 Dec 1 - Dec 7 ___________ (mean) 59.21 _ 1998* _____ (mean) 23.50 _ 1926 _ * 56.93 _ 1982, 56.64 _ 2001 _ the wettest week ending Dec 7 was 1996 (4.48") _ this was the highest weekly total ending on any day in December. Dec 2 - Dec 8 ___________ (max) 65.86 _ 1998*_____ (max) 27.43 _ 1886 _ * 60.71_1982, 60.43_2001, 60.00_1951 Dec 2 - Dec 8 ____________ (min) 51.29 _ 1982*_____ (min) 15.43 _ 1926 (17.14 1886) _ * 50.57 _ 1998 Dec 2 - Dec 8 ___________ (mean) 58.21 _ 1998*_____ (mean) 22.29 _ 1886 (23.21 1926) _ * 56.00 _ 1982 _ the wettest week ending Dec 8 was 1996 (3.51") Dec 3 - Dec 9 ___________ (max) 63.57 _ 1998*_____ (max) 28.00 _ 1886 _ * 59.86 _ 1951 Dec 3 - Dec 9 ____________ (min) 49.71 _ 1998*_____ (min) 16.57 _ 1926 _ * 47.43 _ 1951 Dec 3 - Dec 9 ___________ (mean) 56.64 _ 1998*_____ (mean) 23.29 _ 1886 (24.07 1926) _ * 53.64 _ 1951 _ the wettest week ending Dec 9 was 2014 (4.37") Dec 4 - Dec 10 __________ (max) 60.71 _ 1998*_____ (max) 30.57 _ 1886 _ * 60.14 _ 1953 Dec 4 - Dec 10 ___________ (min) 47.86 _ 1998*_____ (min) 18.57 _ 1926 _ * 46.86 _ 1951 Dec 4 - Dec 10 __________ (mean) 54.29 _ 1998 _____ (mean) 25.36 _ 1886, 1926 _ the wettest week ending Dec 10 was 2014 (4.39") _ included 1.0" snow. Dec 5 - Dec 11 __________ (max) 58.86 _ 1953 _____ (max) 29.57 _ 1880 Dec 5 - Dec 11 ___________ (min) 45.43 _ 1951*_____ (min) 17.71 _ 1880 _ * 43.14 _ 1923 Dec 5 - Dec 11 __________ (mean) 50.93 _ 1951 _____ (mean) 23.64 _ 1880 _ the wettest week ending Dec 11 was 2014 (4.40") _ included 1.0" snow. Dec 6 - Dec 12 __________ (max) 57.29 _ 1953*_____ (max) 28.00 _ 1880 _ * 56.86 _ 2015, 55.71 _ 1966 Dec 6 - Dec 12 ___________ (min) 45.43 _ 2015*____ (min) 15.43 _ 1880 (18.71 1876) _ * 42.86 _ 1966 Dec 6 - Dec 12 __________ (mean) 51.14 _ 2015 _____ (mean) 21.71 _ 1880 (22.71 1934) _ the wettest week ending Dec 12 was 2014 (3.89") _ included 1.0" snow. Dec 7 - Dec 13 __________ (max) 59.71 _ 1946*_____ (max) 27.00 _ 1880 _ * 58.86 _ 2015, 58.43 _ 1911 Dec 7 - Dec 13 ___________ (min) 47.71 _ 2015 _____ (min) 15.86 _ 1917, 1934 Dec 7 - Dec 13 __________ (mean) 53.29 _ 2015 _____ (mean) 21.71 _ 1880 (22.21 1934) _ the wettest week ending Dec 13 was 1983 (3.62") Dec 8 - Dec 14 __________ (max) 60.71 _ 2015 _____ (max) 28.14 _ 1958 (28.57 1902) Dec 8 - Dec 14 ___________ (min) 49.29 _ 2015 _____ (min) 15.57 _ 1917 (16.57 _ 1960) Dec 8 - Dec 14 __________ (mean) 55.00 _ 2015 _____ (mean) 22.93 _ 1934 (23.50 _ 1960) _ the wettest week ending Dec 14 was 2019 (3.93") _ included 0.2" snow. Dec 9 - Dec 15 __________ (max) 63.43 _ 2015 _____ (max) 27.86 _ 1962 (28.14 _ 1917, 1958) Dec 9 - Dec 15 ___________ (min) 51.00 _ 2015 _____ (min) 14.29 _ 1917 (16.71 _ 1960) Dec 9 - Dec 15 __________ (mean) 57.21 _ 2015 _____ (mean) 21.21 _ 1917 (22.86 _ 1904) _ the wettest week ending Dec 15 was 2019 (3.93") _ included 0.2" snow. Dec 10 - Dec 16 _________ (max) 63.14 _ 2015* _____ (max) 25.00 _ 1917 _ *56.71_2021 Dec 10 - Dec 16 __________ (min) 51.86 _ 2015*_____ (min) 13.29 _ 1917 (17.43 _ 1962) _ * 43.43 _ 2006 Dec 10 - Dec 16 _________ (mean) 57.50 _ 2015*_____ (mean) 19.14 _ 1917 (22.21 _ 1962) _ * 50.00_2021, 48.50 _ 2006 _ the wettest week ending Dec 16 was 2008 (3.84") _ included 1.0" snow. Dec 11 - Dec 17 _________ (max) 63.00 _ 2015* _____ (max) 26.86 _ 1917 _*58.14_2021 Dec 11 - Dec 17 __________ (min) 51.71 _ 2015*_____ (min) 14.29 _ 1917 (15.71 _ 1943) _ * 44.71_2021, 44.43 _ 2006 Dec 11 - Dec 17 _________ (mean) 57.36 _ 1951*_____ (mean) 20.57 _ 1917 _ *51.43_2021, 49.14 _ 2006 _ the wettest week ending Dec 17 was 1992 (4.02") _ included 0.4" snow. Dec 12 - Dec 18 _________ (max) 62.43 _ 2015*_____ (max) 28.29 _ 1917 _ *_5557_202154.29 _ 1984, 54.14 _ 2006 Dec 12 - Dec 18 __________ (min) 50.00 _ 2015*_____ (min) 16.29 _ 1917 _ * 44.29 _ 2006 Dec 12 - Dec 18 _________ (mean) 56.21 _ 2015*_____ (mean) 22.29 _ 1917 _ *49.71_2021, 49.21 _ 2006 _ the wettest week ending Dec 18 was 1983 (3.75"). Dec 13 - Dec 19 _________ (max) 58.71 _ 2015 _____ (max) 29.00 _ 1945 (29.14 _ 1916) Dec 13 - Dec 19 __________ (min) 47.14 _ 2015*_____ (min) 15.00 _ 1919 _ * 43.14 _ 2006 Dec 13 - Dec 19 _________ (mean) 52.93 _ 2015*_____ (mean) 23.43 _ 1919 _ * 48.36 _ 2006 _ the wettest week ending Dec 19 was 1909 (3.23") _ included 1.0" snow. Dec 14 - Dec 20 _________ (max) 55.29 _ 2015 _____ (max) 27.14 _ 1919 (29.14 _ 1916) Dec 14 - Dec 20 __________ (min) 44.14 _ 2015 _____ (min) 11.57 _ 1919 Dec 14 - Dec 20 _________ (mean) 49.71 _ 2015 _____ (mean) 19.36 _ 1919 _ the wettest week ending Dec 20 was 1936 (2.98") Dec 15 - Dec 21 _________ (max) 53.71 _ 2015*_____ (max) 22.86 _ 1919 (27.57 _ 1963) _ * 52.14_2023 Dec 15 - Dec 21 __________ (min) 42.14 _ 2015 _____ (min) 10.43 _ 1942 Dec 15 - Dec 21 _________ (mean) 47.93 _ 2015 _____ (mean) 17.43 _ 1919 (18.64 _ 1942) _ the wettest week ending Dec 21 was 1973 (4.10") _ included 2.8" snow. Dec 16 - Dec 22 _________ (max) 53.71 _ 1984*_____ (max) 24.29 _ 1919 (26.14 _ 1945) _ * 52.86_2015 Dec 16 - Dec 22 __________ (min) 42.29 _ 1957*_____ (min) 9.29 _ 1942 (11.43 _ 1876) _ * 42.14 _ 2015 Dec 16 - Dec 22 _________ (mean) 47.50 _ 2015*_____ (mean) 18.07 _ 1942 (18.36 _ 1876) _ * 47.29 _ 1984 _ the wettest week ending Dec 22 was 1973 (4.10") _ included 2.8" snow. Dec 17 - Dec 23 _________ (max) 55.71 _ 1990*_____ (max) 23.86 _ 1876 (25.86_1945) _ * 54.43_2015, 54.00_1949 Dec 17 - Dec 23 __________ (min) 43.86 _ 1990*_____ (min) 12.86 _ 1942 (13.43 _ 1876) _ * 43.00_2015, 42.71_1957 Dec 17 - Dec 23 _________ (mean) 49.79 _ 1990*_____ (mean) 18.64 _ 1876 (20.71_1942, 20.86_1945) _ * 48.71_2015 _ the wettest week ending Dec 23 was 1973 (3.70") _ included 1.1" snow. Dec 18 - Dec 24 _________ (max) 57.71 _ 1990*_____ (max) 24.29 _ 1989 (24.86_1876) _ * 56.29_2015, 54.57_1895 Dec 18 - Dec 24 __________ (min) 44.86 _ 2015*_____ (min) 12.57 _ 1989 _ * 43.00_1895, 42.71_1957 Dec 18 - Dec 24 _________ (mean) 50.57 _ 2015*_____ (mean) 18.43 _ 1989 _ * 50.21_1990, 46.64_2013 _ the wettest week ending Dec 24 was 1973 (2.65"). Dec 19 - Dec 25 _________ (max) 57.57 _ 2015*_____ (max) 23.57 _ 1876 (24.14_1989) _ * 54.43_1895, 54.14_1931 Dec 19 - Dec 25 __________ (min) 47.57 _ 2015*_____ (min) 12.29 _ 1989 _ * 45.00_1895, 42.43_1957 Dec 19 - Dec 25 _________ (mean) 52.57 _ 2015*_____ (mean) 18.21 _ 1989 _ * 49.71_1895 _ the wettest week ending Dec 25 was 1973 (2.65"). Dec 20 - Dec 26 _________ (max) 60.29 _ 2015*_____ (max) 25.00 _ 1989 _ * 55.00_1895, 54.00_1891 Dec 20 - Dec 26 __________ (min) 49.29 _ 2015*_____ (min) 11.57 _ 1989 _ * 45.71 _ 1895 Dec 20 - Dec 26 _________ (mean) 54.79 _ 2015*_____ (mean) 18.29 _ 1989 (21.71_1980) _ * 50.36_1895 _ the wettest week ending Dec 26 was 1973 (3.68"). Dec 21 - Dec 27 _________ (max) 62.86 _ 2015*_____ (max) 22.00 _ 1872 (23.43_1989) _ * 54.43_1891, 1895 Dec 21 - Dec 27 __________ (min) 51.00 _ 2015*______ (min) 8.71 _ 1872 _ * 44.29_1895 Dec 21 - Dec 27 _________ (mean) 56.93 _ 2015*_____ (mean) 15.36 _ 1872 (16.71_1989) _ * 49.36_1895 _ the wettest week ending Dec 27 was 1973 (3.43"). Dec 22 - Dec 28 _________ (max) 61.43 _ 2015*_____ (max) 19.57 _ 1872 _ * 54.00_1982 Dec 22 - Dec 28 __________ (min) 50.29 _ 2015 ______ (min) 6.43 _ 1872 Dec 22 - Dec 28 _________ (mean) 55.86 _ 2015 _____ (mean) 13.00 _ 1872 _ the wettest week ending Dec 28 was 1983 (3.43") _ included 1.6" snow. Dec 23 - Dec 29 _________ (max) 59.14 _ 2015*_____ (max) 19.14 _ 1872 _ * 57.57_1982 Dec 23 - Dec 29 __________ (min) 47.57 _ 2015 ______ (min) 8.14 _ 1872 Dec 23 - Dec 29 _________ (mean) 53.36 _ 2015*_____ (mean) 13.64 _ 1872 _ * 49.00_1982 _ the wettest week ending Dec 29 was 1911 (3.78"). Dec 24 - Dec 30 _________ (max) 57.14 _ 1982*_____ (max) 19.57 _ 1872 _ * 56.86_2015 Dec 24 - Dec 30 __________ (min) 45.57 _ 2015 _____ (min) 9.00 _ 1872 Dec 24 - Dec 30 _________ (mean) 51.21 _ 2015*_____ (mean) 14.29 _ 1872 _ * 48.64_1982 _ the wettest week ending Dec 30 was 1911 (4.12"). Dec 25 - Dec 31 _________ (max) 54.86 _ 1982*_____ (max) 20.00 _ 1917 (23.00_1880) _ * 53.71_1936 Dec 25 - Dec 31 __________ (min) 43.57 _ 2023*______ (min) 5.29 _ 1917 _ * 42.57_ 2015 Dec 25 - Dec 31 _________ (mean) 48.00 _ 2015*_____ (mean) 12.64 _ 1917 _ the wettest week ending Dec 31 was 1911 (4.03") _ included 1.5" snow. Benchmark values follow.
-
CONTINUED REPORT ON WEEKLY EXTREMES for WEEKS ENDING IN NOVEMBER Intervals _______________ Highest values 1869-2021 __ Lowest values 1869-2021 Oct 26 - Nov 1 __________ (max) 75.29 _ 1946*_____ (max) 42.57 _ 1869 _* 72.57_1989 Oct 26 - Nov 1 ___________ (min) 60.43 _ 1946*_____ (min) 32.71 _ 1869 (34.57 1925) _ * 60.29 _ 1971 Oct 26 - Nov 1 __________ (mean) 67.86 _ 1946*_____ (mean) 37.64 _ 1869 _ *66.00 _ 1971 _ the wettest week ending Nov 1 was 1943 (4.30") _ 4.15" in 1973. __ record broken in 2021 (4.48"). Oct 27 - Nov 2 __________ (max) 74.86 _ 1946*_____ (max) 43.00 _ 1869 _* 73.00_1950 Oct 27 - Nov 2 ___________ (min) 61.14 _ 1971*_____ (min) 33.86 _ 1869 (34.00 1925) _ * 60.00 _ 1946 Oct 27 - Nov 2 __________ (mean) 67.43 _ 1946*_____ (mean) 38.43 _ 1869 (40.57 1925) _ * 66.43 _ 1971 _ the wettest week ending Nov 2 was 1973 (4.15"). Oct 28 - Nov 3 __________ (max) 73.57 _ 1946, 1950*__ (max) 44.86 _ 1869 (46.29 1925) _ * 72.14_1982, 71.86_1971 Oct 28 - Nov 3 ___________ (min) 59.71 _ 1971*_____ (min) 33.57 _ 1925 _ * 59.57 _ 1971 Oct 28 - Nov 3 __________ (mean) 66.57 _ 1946*_____ (mean) 39.93 _ 1925 (40.07 1869) _ * 65.79 _ 1971 _ the wettest week ending Nov 3 was 1973 (4.15"). Oct 29 - Nov 4 __________ (max) 74.14 _ 1950*_____ (max) 45.86 _ 1925 _ * 72.86_1982, 71.29_1961 Oct 29 - Nov 4 ___________ (min) 58.57 _ 1946*_____ (min) 34.00 _ 1925 _ * 58.43 _ 1982 Oct 29 - Nov 4 __________ (mean) 65.64 _ 1982*_____ (mean) 39.93 _ 1925 _ * 65.57_1946, 65.36_1950 _ the wettest week ending Nov 4 was 1973 (4.15"). Oct 30 - Nov 5 __________ (max) 73.29 _ 1950*_____ (max) 42.71 _ 1879 _ * 72.43_1982, 72.14_1961 Oct 30 - Nov 5 ___________ (min) 56.43 _ 1974, 1982*__ (min) 32.29 _ 1879 _ * 55.00 _ 1961 Oct 30 - Nov 5 __________ (mean) 64.43 _ 1982*_____ (mean) 37.50 _ 1879 _ * 63.07 _ 1974 _ the wettest week ending Nov 5 was 1894 (3.79"). Oct 31 - Nov 6 __________ (max) 70.00 _ 1950, 1961, 2022 __ (max) 40.14 _ 1879 Oct 31 - Nov 6 ___________ (min) 57.00 _ 2022* ____ (min) 29.71 _ 1879 _ *55.86 _ 1974 Oct 31 - Nov 6 __________ (mean) 63.50 _ 2022*____ (mean) 34.93 _ 1879 _ *62.57 _ 1974, 62.36 _ 1961 _ the wettest week ending Nov 6 was 1894 (3.78"). Nov 1 - Nov 7 ___________ (max) 71.71 _ 2022*__ (max) 40.29 _ 1879 _ * 69.57_1975, 2015, 68.71_1950, 68.29_1938 Nov 1 - Nov 7 ____________ (min) 57.43_ 2022* ___ (min) 29.00 _ 1879 _* 55.29_2015, 54.14_1974, 53.86_1938, 53.71_1975, 53.43_2003, 53.29_1948 Nov 1 - Nov 7 ___________ (mean) 64.57 _ 2022*___ (mean) 34.64 _ 1879 _ * 62.43_2015, 61.64_1975, 61.07_1938, 60.79_1974, 60.14_1961, 60.07_1994,2003 _ the wettest week ending Nov 7 was 1963 (5.04"). Nov 2 - Nov 8 ___________ (max) 72.14 _ 1975* _____ (max) 41.86 _ 1879 _ * 70.43_2022, 69.29_1938 Nov 2 - Nov 8 ____________ (min) 56.86 _ 1975*_____ (min) 29.71 _ 1879 _ * 55.71_2022, 55.00 _ 1938 Nov 2 - Nov 8 ___________ (mean) 64.50 _ 1975*_____ (mean) 35.79 _ 1879 _ * 63.07_2022, 62.14 _ 1938 _ the wettest week ending Nov 8 was 1977 (9.36"). Nov 3 - Nov 9 ___________ (max) 73.14 _ 1975 _____ (max) 43.00 _ 1878 Nov 3 - Nov 9 ____________ (min) 58.00 _ 1975 _____ (min) 32.43 _ 1878 Nov 3 - Nov 9 ___________ (mean) 65.57 _ 1975 _____ (mean) 37.71 _ 1878 _ the wettest week ending Nov 9 was 1977 (9.36"). Nov 4 - Nov 10 ___________ (max) 72.14 _ 1975*__ (max) 43.00 _ 1878 _ * 71.00 _ 2020 Nov 4 - Nov 10 ____________ (min) 58.00 _ 1975 _____ (min) 33.14 _ 1878 Nov 4 - Nov 10 ___________ (mean) 65.07 _ 1975 _____ (mean) 38.07 _ 1878 _ the wettest week ending Nov 10 was 1977 (9.66") _ the highest weekly total in November. Nov 5 - Nov 11 ___________ (max) 72.43 _ 2020*_____ (max) 41.71 _ 1894 (42.71 1933) _ * 70.00 _ 1975 Nov 5 - Nov 11 ____________ (min) 56.86 _ 2020*_____ (min) 32.14 _ 1933 _ * 56.14 _ 1975 Nov 5 - Nov 11 ___________ (mean) 64.64 _ 2020*_____ (mean) 37.43 _ 1933 _ * 63.07 _ 1975 _ the wettest week ending Nov 11 was 1977 (9.56"). Nov 6 - Nov 12 ___________ (max) 72.57 _ 2020 _____ (max) 40.00 _ 1894 Nov 6 - Nov 12 ____________ (min) 56.00 _ 2020 _____ (min) 33.00 _ 1933 Nov 6 - Nov 12 ___________ (mean) 64.29 _ 2020 _____ (mean) 36.86 _ 1894 _ the wettest week ending Nov 12 was 1977 (9.56"). Nov 7 - Nov 13 ___________ (max) 69.71 _ 2020 _____ (max) 41.43 _ 1894 (44.86 1976) Nov 7 - Nov 13 ____________ (min) 54.71 _ 2020 _____ (min) 32.71 _ 2019 (33.29 1976) Nov 7 - Nov 13 ___________ (mean) 62.21 _ 2020 _____ (mean) 37.50 _ 1894 (39.07 1976) _ the wettest week ending Nov 13 was 1977 (9.56"). Nov 8 - Nov 14 ___________ (max) 66.57 _ 2020 _____ (max) 41.86 _ 1894 (44.43 1976) Nov 8 - Nov 14 ____________ (min) 52.71 _ 2020*_____ (min) 30.86 _ 2019 (32.00 1976) _ * 52.29 _ 2006 Nov 8 - Nov 14 ___________ (mean) 59.64 _ 2020 _____ (mean) 37.64 _ 1873 (38.21 1976, 39.07 2019) _ the wettest week ending Nov 14 was 1972 (8.43"). Nov 9 - Nov 15 ___________ (max) 66.43 _ 1879 _____ (max) 40.71 _ 1873 Nov 9 - Nov 15 ____________ (min) 52.29 _ 2006*_____ (min) 30.00 _ 1873 _ * 51.57 _ 1879 Nov 9 - Nov 15 ___________ (mean) 59.00 _ 1879*_____ (mean) 35.36 _ 1873 (38.86 1976) _ * 57.57 _ 2006 _ the wettest week ending Nov 15 was 1892 (4.41"). This included 2.3" snow (the first late autumn weekly max to include snow). Nov 10 - Nov 16 __________ (max) 65.43 _ 1879 _____ (max) 40.29 _ 1873 Nov 10 - Nov 16 ___________ (min) 52.71 _ 2006 _____ (min) 29.00 _ 1933 (29.14 1873) Nov 10 - Nov 16 __________ (mean) 58.07 _ 1879*_____ (mean) 34.71 _ 1873 _ * 57.86 _ 2006 _ the wettest week ending Nov 16 was 1892 (4.50"). The snow reported in the previous interval dropped out of the total. Nov 11 - Nov 17 __________ (max) 65.43 _ 1993*_____ (max) 40.86 _ 1873 _* 64.00_1879 Nov 11 - Nov 17 ___________ (min) 52.29 _ 2006 _____ (min) 27.14 _ 1933 Nov 11 - Nov 17 __________ (mean) 57.93 _ 2006 _____ (mean) 34.29 _ 1933 _ * 56.71 _ 1909 _ the wettest week ending Nov 17 was 1930 (3.61"). Nov 12 - Nov 18 __________ (max) 65.71 _ 1993 _____ (max) 40.43 _ 1873 (40.57 1883, 40.86 1933 ) Nov 12 - Nov 18 ___________ (min) 51.43 _ 2006*_____ (min) 26.29 _ 1883 (30.14 2019) _ * 50.43 _ 1930 Nov 12 - Nov 18 __________ (mean) 57.43 _ 1993*_____ (mean) 33.43 _ 1883 _ * 56.57 _ 2006, 55.93 _ 1902 _ the wettest week ending Nov 18 was 1930 (3.98"). Nov 13 - Nov 19 ___________ (max) 64.71 _ 1993* _____ (max) 38.86 _ 1873 (40.00 1993) _ * 64.57 _ 1928 Nov 13 - Nov 19 ____________ (min) 50.57 _ 2006*_____ (min) 26.71 _ 1883 _ * 50.29 _ 1930 Nov 13 - Nov 19 ___________ (mean) 57.14 _ 1928, 1993 __ (mean) 33.64 _ 1883 (34.07 1933, 37.93 2019) _ the wettest week ending Nov 19 was 1930 (3.98"). Nov 14 - Nov 20 ___________ (max) 65.00 _ 1928 _____ (max) 38.00 _ 1873 (38.57 1933) Nov 14 - Nov 20 ____________ (min) 49.86 _ 1931 _____ (min) 27.29 _ 1883 (27.86 1924) Nov 14 - Nov 20 ___________ (mean) 57.07 _ 1928 _____ (mean) 32.79 _ 1873 (33.14 1933) _ the wettest week ending Nov 20 was 1988 (4.46"). Nov 15 - Nov 21 __________ (max) 67.14 _ 1953 _____ (max) 39.86 _ 1873 (40.43 1880) Nov 15 - Nov 21 ___________ (min) 51.29 _ 1931 _____ (min) 27.29 _ 1873 (27.57 1924) Nov 15 - Nov 21 __________ (mean) 57.07 _ 1953 _____ (mean) 33.57 _ 1873 (34.21 1933) _ the wettest week ending Nov 21 was 1988 (4.46"). Nov 16 - Nov 22 __________ (max) 67.86 _ 1953 _____ (max) 38.00 _ 1880 Nov 16 - Nov 22 ___________ (min) 52.57 _ 1931*_____ (min) 25.43 _ 1880 _ * 49.57 _ 1953 Nov 16 - Nov 22 __________ (mean) 58.71 _ 1953*_____ (mean) 31.71 _ 1880 _ * 57.71 _ 1931 _ the wettest week ending Nov 22 was 1988 (4.46"). 1985 had 3.57". Nov 17 - Nov 23 __________ (max) 68.14 _ 1953 _____ (max) 35.14 _ 1880 Nov 17 - Nov 23 ___________ (min) 53.43 _ 1931*_____ (min) 22.71 _ 1880 _ * 49.86 _ 1953, 48.71 _ 1963 Nov 17 - Nov 23 __________ (mean) 59.21 _ 1931*_____ (mean) 28.93 _ 1880 _ * 59.00 _ 1953 _ the wettest week ending Nov 23 was 1988 (4.46"). Nov 18 - Nov 24 __________ (max) 67.14 _ 1931 _____ (max) 32.43 _ 1880 Nov 18 - Nov 24 ___________ (min) 53.71 _ 1931*_____ (min) 19.57 _ 1880 _ * 49.14 _ 1953 Nov 18 - Nov 24 __________ (mean) 60.43 _ 1931 _____ (mean) 26.00 _ 1880 _ the wettest week ending Nov 24 was 1988 (3.38"). Nov 19 - Nov 25 __________ (max) 66.29 _ 1931*_____ (max) 30.14 _ 1880 _ * 65.71 _ 1979 Nov 19 - Nov 25 ___________ (min) 53.14 _ 1979*_____ (min) 19.57 _ 1880 _ * 52.14 _ 1931 Nov 19 - Nov 25 __________ (mean) 59.43 _ 1979*_____ (mean) 24.86 _ 1880 _ * 59.21 _ 1931 _ the wettest week ending Nov 25 was 1988 (3.38"). Nov 20 - Nov 26 __________ (max) 66.57 _ 1979 _____ (max) 29.43 _ 1880 Nov 20 - Nov 26 ___________ (min) 54.14 _ 1979 _____ (min) 18.86 _ 1880 Nov 20 - Nov 26 __________ (mean) 60.36 _ 1979 _____ (mean) 24.14 _ 1880 _ the wettest week ending Nov 26 was 1988 (3.37"). Nov 21 - Nov 27 __________ (max) 65.57 _ 1979 _____ (max) 28.14 _ 1880^ Nov 21 - Nov 27 ___________ (min) 54.14 _ 1979 _____ (min) 17.71 _ 1880 Nov 21 - Nov 27 __________ (mean) 59.86 _ 1979 _____ (mean) 22.93 _ 1880 _ the wettest week ending Nov 27 was 1878 (3.80"). Nov 22 - Nov 28 __________ (max) 66.14 _ 1979 _____ (max) 28.29 _ 1880 Nov 22 - Nov 28 ___________ (min) 53.71 _ 1979 _____ (min) 18.00 _ 1880 Nov 22 - Nov 28 __________ (mean) 59.93 _ 1979 _____ (mean) 23.14 _ 1880 _ the wettest week ending Nov 28 was 1878 (3.69"). Nov 23 - Nov 29 __________ (max) 64.86 _ 1979*_____ (max) 30.86 _ 1880 _ * 61.71 _ 2011 Nov 23 - Nov 29 ___________ (min) 51.14 _ 1979 _____ (min) 20.43 _ 1880 _ * 52.29 _ 2006 Nov 23 - Nov 29 __________ (mean) 57.71 _ 1979 _____ (mean) 25.64 _ 1880 _ the wettest week ending Nov 29 was 1889 (3.45"). 1971 was similar at 3.42" Nov 24 - Nov 30 __________ (max) 62.14 _ 2001*_____ (max) 32.14 _ 1880 _ * 61.57 _ 2011 Nov 24 - Nov 30 ___________ (min) 51.29 _ 2001*_____ (min) 22.57 _ 1880 _ * 47.14 _ 2011 Nov 24 - Nov 30 __________ (mean) 56.71 _ 2001*_____ (mean) 27.36 _ 1880 (29.79 1938) _ * 54.36 _ 2011 _ the wettest week ending Nov 30 was 1889 (3.45"). 1971 was similar at 3.42" _________________________________________________________________ ^ (1880 low max note: this long spell of very cold weather in late Nov 1880 dominated other years by margins seldom seen in the rest of the data, for example on this coldest weekly interval the second coldest average was nine degrees warmer (37.14 in 1903). The dominance was equally present with overnight lows, the second coldest average for the same interval was once again nine degrees warmer, this time in 1888. Therefore a slightly greater dominance applied to the weekly mean temperatures.)
-
CONTINUED REPORT ON WEEKLY EXTREMES for WEEKS ENDING IN OCTOBER Intervals _______________ Highest values 1869-2021 __ Lowest values 1869-2021 Sep 25 - Oct 1 __________ (max) 85.43 _ 1881 ____ (max) 59.57 _ 1928 Sep 25 - Oct 1 ___________ (min) 70.00 _ 1881*______ (min) 43.57 _ 1947 _ * 67.14 _ 1959 Sep 25 - Oct 1 __________ (mean) 77.71 _ 1881 ____ (mean) 52.79 _ 1947 (52.86 1928) _ the wettest week ending Oct 1 was 2023 (6.65") _ 2010 (5.22") Sep 26 - Oct 2 __________ (max) 83.43 _ 1881 ____ (max) 60.14 _ 1928 Sep 26 - Oct 2 ___________ (min) 68.86 _ 1881 ______ (min) 43.29 _ 1947 Sep 26 - Oct 2 __________ (mean) 76.14 _ 1881 ____ (mean) 53.00 _ 1947 (53.50 1928) _ the wettest week ending Oct 2 was 2023 (6..06") _ 1913 (5.28") Sep 27 - Oct 3 __________ (max) 82.14 _ 1881 ____ (max) 57.71 _ 1888 Sep 27 - Oct 3 ___________ (min) 67.43 _ 1881 ______ (min) 43.86 _ 1947 Sep 27 - Oct 3 __________ (mean) 74.79 _ 1881 ____ (mean) 51.14 _ 1888 _ the wettest week ending Oct 3 was 2023 (5.86") _ 1913 (5.28") Sep 28 - Oct 4 __________ (max) 82.57 _ 1954 ____ (max) 55.57 _ 1888 Sep 28 - Oct 4 ___________ (min) 66.86 _ 1954 ______ (min) 41.71 _ 1888 Sep 28 - Oct 4 __________ (mean) 74.71 _ 1954*____ (mean) 48.64 _ 1888 _ * 72.50 _ 1959 _ the wettest week ending Oct 4 was 2023 (5.86") _ 1913 (5.28") Sep 29 - Oct 5 __________ (max) 82.71 _ 1922*____ (max) 56.57 _ 1888 _ * 81.43 _ 1927 Sep 29 - Oct 5 ___________ (min) 67.57 _ 1954*______ (min) 42.00 _ 1947 (45.00 1899) _ * 66.29_1898 Sep 29 - Oct 5 __________ (mean) 74.71 _ 1954 ____ (mean) 49.29 _ 1888 _ the wettest week ending Oct 5 was 2023 (5.48") _ 1913 (5.28") Sep 30 - Oct 6 __________ (max) 82.14 _ 1922 ____ (max) 57.57 _ 1899 (57.86 1888) _ * 81.29 _ 1927 Sep 30 - Oct 6 ___________ (min) 66.00 _ 1898 ______ (min) 43.86 _ 1888 (45.00 1899) _ * 65.43 _ 1954 Sep 30 - Oct 6 __________ (mean) 72.64 _ 1954 ____ (mean) 50.86 _ 1888 _ the wettest week ending Oct 6 was 1913 (5.28") Oct 1 - Oct 7 __________ (max) 82.29 _ 1941 ____ (max) 58.00 _ 1899 (59.29 1888) Oct 1 - Oct 7 ___________ (min) 64.71 _ 1898*______ (min) 43.43 _ 1892 _ * 64.29 _ 1941 Oct 1 - Oct 7 __________ (mean) 73.29 _ 1941 ____ (mean) 51.21 _ 1883 (52.07 1888) _ the wettest week ending Oct 7 was 1913 (5.28") Oct 2 - Oct 8 __________ (max) 81.71 _ 1941, 2007 __ (max) 58.29 _ 1889 (58.71 1888) Oct 2 - Oct 8 ___________ (min) 65.57 _ 2007*______ (min) 43.14 _ 1889 _ * 64.29 _ 1898 Oct 2 - Oct 8 __________ (mean) 73.64 _ 2007* ____ (mean) 50.71 _ 1889 (51.36 1883) _ * 72.36 _ 1941 _ the wettest week ending Oct 8 was 1903 (4.78") Oct 3 - Oct 9 __________ (max) 82.29 _ 2007*____ (max) 55.86 _ 1888 _ * 80.86 _ 1941 Oct 3 - Oct 9 ___________ (min) 65.86 _ 2007 ______ (min) 42.29 _ 1889 Oct 3 - Oct 9 __________ (mean) 74.07 _ 2007*____ (mean) 49.57 _ 1888 (50.21 1889) _ * 72.50 _ 1959 _ the wettest week ending Oct 9 was 1903 (11.64") Oct 4 - Oct 10 _________ (max) 81.00 _ 1959, 2007 __ (max) 56.57 _ 1888 Oct 4 - Oct 10 __________ (min) 66.29 _ 2007 ______ (min) 42.71 _ 1889 Oct 4 - Oct 10 _________ (mean) 73.14 _ 1959, 2007*____ (mean) 49.71 _ 1888 (50.21 1889) _ * 72.86 _ 2017 _ the wettest week ending Oct 10 was 1903 (11.81") Oct 5 - Oct 11 _________ (max) 80.43 _ 1990 _____ (max) 55.71 _ 1888 Oct 5 - Oct 11 __________ (min) 66.86 _ 2007 _____ (min) 40.43 _ 1964 Oct 5 - Oct 11 _________ (mean) 73.29 _ 2017*____ (mean) 49.21 _ 1888 (49.29 1964) _ * 72.14 _ 1959 _ the wettest week ending Oct 11 was 1903 (11.94") Oct 6 - Oct 12 _________ (max) 80.86 _ 1990 ______ (max) 54.14 _ 1888 Oct 6 - Oct 12 __________ (min) 65.57 _ 1990*______ (min) 39.57 _ 1964 _ * 65.43 _ 2017 Oct 6 - Oct 12 _________ (mean) 73.21 _ 1990 ____ (mean) 48.43 _ 1888 (49.21 1964) _ the wettest week ending Oct 12 was 1903 (11.96") Oct 7 - Oct 13 _________ (max) 80.29 _ 1949* _____ (max) 53.43 _ 1888 _ * 78.86 _ 1961 Oct 7 - Oct 13 __________ (min) 66.71*_ 1990 ______ (min) 40.71 _ 1876 _ * 64.43 _ 1949 Oct 7 - Oct 13 _________ (mean) 73.07 _ 1990*____ (mean) 47.43 _ 1888 (49.43 1988) _ * 72.36 _ 1949 _ the wettest week ending Oct 13 was 1903 (11.96") _ 11.71" in 2005 Oct 8 - Oct 14 _________ (max) 80.43 _ 1949 _____ (max) 51.57 _ 1888 Oct 8 - Oct 14 __________ (min) 67.57 _ 1990 ______ (min) 40.43 _ 1875 (40.86 1876, 41.57 1925) Oct 8 - Oct 14 _________ (mean) 73.36 _ 1990 ____ (mean) 46.29 _ 1888 (48.86 1925, 49.29 1988) _ the wettest week ending Oct 14 was 2005 (13.02") _ 11.95" in 1903 _ _ The 2005 amount was the highest weekly total in October and also in the entire calendar year. Oct 9 - Oct 15 _________ (max) 80.29 _ 1954 ______ (max) 51.29 _ 1888 Oct 9 - Oct 15 __________ (min) 66.29 _ 1990 ______ (min) 39.57 _ 1876 Oct 9 - Oct 15 _________ (mean) 72.43 _ 1990*____ (mean) 46.00 _ 1888 _ * 71.29 _ 1954 _ the wettest week ending Oct 15 was 2005 (8.76") _ 7.65" in 1903 Oct 10 - Oct 16 ________ (max) 80.14 _ 1954 ______ (max) 53.57 _ 1888 Oct 10 - Oct 16 _________ (min) 64.00 _ 1990 ______ (min) 39.00 _ 1876 Oct 10 - Oct 16 ________ (mean) 71.36 _ 1954 ____ (mean) 47.50 _ 1876 _ the wettest week ending Oct 16 was 2005 (8.75") _ 5.83" in 2002 Oct 11 - Oct 17 ________ (max) 78.29 _ 1938 ______ (max) 53.57 _ 1875, 2009 Oct 11 - Oct 17 _________ (min) 61.71 _ 1990 ______ (min) 38.43 _ 1876 Oct 11 - Oct 17 ________ (mean) 69.36 _ 1954*____ (mean) 46.50 _ 1876 _ * 68.57_1938 _ the wettest week ending Oct 17 was 2005 (8.68") _ 5.68" in 2002 Oct 12 - Oct 18 ________ (max) 77.29 _ 1938*______ (max) 50.86 _ 2009 _ * 76.43_1947, 75.71 _ 1928, 63 Oct 12 - Oct 18 _________ (min) 61.71 _ 1899 ______ (min) 38.29 _ 1876 Oct 12 - Oct 18 ________ (mean) 68.57 _ 1938 ____ (mean) 45.93 _ 2009 _ the wettest week ending Oct 18 was 2005 (8.55") Oct 13 - Oct 19 ________ (max) 78.00 _ 1963*______ (max) 51.14 _ 2009 _ * 76.29_1938, 76.14_1947, 75.21_1968 Oct 13 - Oct 19 _________ (min) 62.00 _ 1899 ______ (min) 39.14 _ 1876 (40.14 2009) Oct 13 - Oct 19 ________ (mean) 68.29 _ 1947*____ (mean) 45.64 _ 2009 _ * 68.00 _ 1938 _ the wettest week ending Oct 19 was 1927 (5.76") Oct 14 - Oct 20 ________ (max) 78.86 _ 1963*______ (max) 51.29 _ 2009 _ * 77.57_1947, 77.00_1938 Oct 14 - Oct 20 _________ (min) 61.00 _ 1947 ______ (min) 40.00 _ 2009 Oct 14 - Oct 20 ________ (mean) 69.29 _ 1947*____ (mean) 45.64 _ 2009 _ * 68.14 _ 1938 _ the wettest week ending Oct 20 was 1989 (5.34") Oct 15 - Oct 21 ________ (max) 79.43 _ 1963*______ (max) 53.43 _ 2009 _ * 78.14 _ 1947 Oct 15 - Oct 21 _________ (min) 61.86 _ 1947 ______ (min) 38.00 _ 1940 (38.86 1972) Oct 15 - Oct 21 ________ (mean) 70.00 _ 1947 ____ (mean) 46.50 _ 1940 (46.71 1972) _ the wettest week ending Oct 21 was 1989 (5.34") Oct 16 - Oct 22 ________ (max) 77.71 _ 1947*______ (max) 51.00 _ 1940 (53.86 1974, 54.14 1972) _ * 76.71 _ 1963^ Oct 16 - Oct 22 _________ (min) 62.14 _ 1947*______ (min) 35.43 _ 1940 (37.29 1974) _ * 59.43 _ 1984 Oct 16 - Oct 22 ________ (mean) 69.93 _ 1947 ____ (mean) 43.21 _ 1940 (45.57 1974) _ the wettest week ending Oct 22 was 1989 (5.34") __ __ __ ^ see note end of table (re 1963 high minima) Oct 17 - Oct 23 ________ (max) 78.14 _ 1947 ______ (max) 51.71 _ 1888 Oct 17 - Oct 23 _________ (min) 61.71 _ 1947*______ (min) 35.14 _ 1940 (37.29 1974) _ * 61.00 _ 2007 Oct 17 - Oct 23 ________ (mean) 69.93 _ 1947 ____ (mean) 44.07 _ 1940 (45.79 1888, 47.64 1976) _ the wettest week ending Oct 23 was 1989 (5.34") Oct 18 - Oct 24 ________ (max) 76.00 _ 1947 ______ (max) 51.86 _ 1888 Oct 18 - Oct 24 _________ (min) 60.14 _ 2007 ______ (min) 36.86 _ 1940 (37.14 1974) Oct 18 - Oct 24 ________ (mean) 67.71 _ 1979*____ (mean) 45.79 _ 1888, 1930 _ * 67.36 _ 1947 _ the wettest week ending Oct 24 was 1911 (4.95") Oct 19 - Oct 25 ________ (max) 74.43 _ 1947*______ (max) 51.86 _ 1930 _ * 74.00_1963 ^ Oct 19 - Oct 25 _________ (min) 58.71 _ 2017 ______ (min) 38.14 _ 1930 _ Oct 19 - Oct 25 ________ (mean) 66.00 _ 2017*____ (mean) 45.00 _ 1930 _ * 65.71 _ 1979 _ the wettest week ending Oct 25 was 1913 (5.36") Oct 20 - Oct 26 ________ (max) 75.29 _ 1947 ______ (max) 50.57 _ 1883 Oct 20 - Oct 26 _________ (min) 58.00 _ 1984 ______ (min) 38.14 _ 1869 Oct 20 - Oct 26 ________ (mean) 64.86 _ 1947 ____ (mean) 45.07 _ 1887 _ the wettest week ending Oct 26 was 1913 (5.20") Oct 21 - Oct 27 ________ (max) 75.00 _ 1947*______ (max) 49.14 _ 1883 (50.43 1889) _ * 74.71_1963 ^ Oct 21 - Oct 27 _________ (min) 59.57 _ 1908 ______ (min) 37.14 _ 1869 Oct 21 - Oct 27 ________ (mean) 64.86 _ 1920, 1963 _ (mean) 44.50 _ 1869 (44.64 1887) _ the wettest week ending Oct 27 was 1958 (4.30") Oct 22 - Oct 28 ________ (max) 74.14 _ 1947 ______ (max) 50.00 _ 1883 (50.57 1976) Oct 22 - Oct 28 _________ (min) 61.14 _ 1908*______ (min) 36.71 _ 1869 (37.71 1969) _ * 58.71 _ 1971 Oct 22 - Oct 28 ________ (mean) 64.86 _ 1908 ____ (mean) 43.71 _ 1869 (44.36 1976) _ the wettest week ending Oct 28 was 1943 (4.45") Oct 23 - Oct 29 ________ (max) 73.86 _ 1947*______ (max) 49.00 _ 1869 _ * 73.43_1946 Oct 23 - Oct 29 _________ (min) 61.86 _ 1908*______ (min) 36.71 _ 1869 (37.86 1969) _ * 59.71 _ 1900, 1971 Oct 23 - Oct 29 ________ (mean) 65.29 _ 1946*____ (mean) 42.86 _ 1869 (44.71 1976, 46.14 1969) _ * 65.07 _ 1908 _ the wettest week ending Oct 29 was 1943 (4.33") Oct 24 - Oct 30 ________ (max) 75.14 _ 1946*______ (max) 45.86 _ 1869 _ * 74.29_1989 Oct 24 - Oct 30 _________ (min) 59.71 _ 1908*______ (min) 34.86 _ 1869 _ * 59.43 _ 1946 Oct 24 - Oct 30 ________ (mean) 67.29 _ 1946 ____ (mean) 40.36 _ 1869 _ the wettest week ending Oct 30 was 1917 (4.62") __ record broken in 2021 (4.70"). Oct 25 - Oct 31 ________ (max) 75.71 _ 1946*______ (max) 43.14 _ 1869 _ * 74.00_1989 Oct 25 - Oct 31 _________ (min) 60.57 _ 1946*______ (min) 33.57 _ 1869 _ * 59.57 _ 1971 Oct 25 - Oct 31 ________ (mean) 68.14 _ 1946 ____ (mean) 38.36 _ 1869 _ the wettest week ending Oct 31 was 1943 (4.43") __ record broken in 2021 (4.71"). _ 1973 had 3.89", 4.15" by Nov 1 which became top values ending Nov 2-4 ... ... the records for 1973 will show up in weeks ending in November but all the rain fell in October. _________________________________________ ^ Despite a number of warm daytime averages in late October 1963, clear skies meant that the average minima were in the 54-55 range below several other years not shown as secondary high minima. The 1947 warm spell had very similar daytime readings but was a few degrees warmer at night. A warm spell in October 1879 was often in the range of 74 to 76 degrees during mid-October.
-
Current GFS shows it moving gradually west along 12N to 50W as a weak TD at most, then slowly intensifying as it curves NNW past all of the Caribbean islands heading towards Bermuda where it might be a cat-1 hurricane in about ten or eleven days, then a landfall over western Newfoundland near day 12-13. It might be the 16th named storm because the invest east of Florida seems to acquire TD to weak TS intensity off the Carolinas towards Nova Scotia within 3-5 days, no landfall predicted at this point with that one (which might get the 15th name, Omar possibly? ). This GFS scenario could easily change to something more impactful further west though.
-
2021 North Atlantic hurricane forecast contest
Roger Smith replied to Roger Smith's topic in Tropical Headquarters
Nicholas did reach hurricane status around landfall last night, so the new count is 14/6/3. Here's a copy of the table edited above for the number of storms each forecaster now requires to meet their predictions. That table will be locked and this new one will see the next round of edits. Odette, Peter and Rose have changed the count to 17/6/3 with just slight chances of any of them becoming hurricanes (Odette is not necessarily done because part of its circulation may redevelop tropical status, but even so that looks only tropical storm at most which would change nothing). ... Required future tropical counts for seasonal predictions to verify _ This table will be updated as new data change the seasonal count _ _ Sep 14 count is 14/6/3 (see previous version for earlier counts) _ Sep 18 count is 15/6/3 (Odette came and went although there's some chance of a part two). _ Sep 20 count is 17/6/3 (Peter and Rose both tropical storms, little chance of hurricane status apparently). _ Sep 24 count is 18/6/3 forecast to become 18/7/4 within days (this has now verified). _ Sep 25 count is 19/7/4 after the brief non-rampage of Teresa. _ Oct 2 count is 20/7/4 as Victor remained only at tropical storm intensity at its peak. FORECASTER _________________ named __ 'canes __ Major _____ additional named, H and M required Macintosh ______________________ 25 __ 14 __ 10 ___________ 5 ___ 7 __ 6 (best outcome 7 7 6) Tezeta __________________________ 23 __ 14 ___ 7 ___________ 3 ___ 7 __ 3 (best outcome 6 6 3) Roger Smith _____________________23 __ 13 ___ 7 ___________ 3 ___ 6 __ 3 (best outcome 6 6 3) Southmdwatcher ________________22 __ 11 ___ 6 ___________ 2 ___ 4 __ 2 (best outcome 4 4 2) IntenseWind002 ________________ 22 ___ 9 ___ 4 ___________ 2 ___ 2 __ 0 hudsonvalley21 __________________21 __ 11 ___ 6 ____________1 ___ 4 __ 2 (best outcome 3 3 2) Newman ________________________ 21 __ 10 ___ 5 ___________ 1 ___ 3 __ 1 (best outcome 3 3 1) J_Keith_Lee _____________________ 21 ___ 9 ___ 4 ___________ 1 ___ 2 __ 0 (best outcome 2 2 0) Brian5671 _______________________ 20 __ 12 ___ 2 ___________ 0 ___ 5 __(-2) (4 4 0 best outcome) RJay ____________________________ 20 __ 10 ___ 5 ___________ 0 ___ 3 __ 1 (2 2 1 best outcome) WxWatcher007 __________________20 ___ 9 ___ 4 ___________ 0 ___ 2 __ 0 (2 2 0 best outcome) BKViking ________________________ 20 ___ 9 ___ 4 ___________ 0 ___ 2 __ 0 (2 2 0 best outcome) ___ consensus __________________19.2 _ 9.8 __ 4.7 _________- 0.8_2.8 _0.7 (3 3 1 best outcome) DonSutherland1 _________________ 19 __ 12 ___ 6 ___________-1 ___ 5 __ 2 (4 4 2 best outcome) Ldub _____________________________19 __ 11 ___ 5 ___________ -1 ___ 4 __ 1 (3 3 1 best outcome) magpiemaniac ___________________ 19 __ 10 ___ 4 __________ -1 ___ 3 __ 0 (2 2 0 best outcome) NCforecaster89 _________________ 19 ___ 9 ___ 4 ___________ -1 ___ 2 __ 0 (2 2 0 best outcome) Tom _____________________________ 19 ___ 9 ___ 3 ___________ -1 ___ 2 __-1 (2 2 0 best outcome) Looking to the skies _____________ 19 ___ 8 ___ 7 ___________ -1 ___ 1 __ 2 (1 1 1 best outcome) wxdude64 _______________________ 19 ___ 7 ___ 4 ___________ -1 ___ 0 __ 0 (0 0 0 best outcome) TexMexWx _______________________ 18 ___ 9 ___ 4 ____________-2 ___ 2 __ 0 (0 0 0 best outcome) Cat Lady _________________________ 18 ___ 9 ___ 3 ____________ -2 ___ 2 __-1 (0 0 0 best outcome) snowlover2 ______________________ 18 ___ 8 ___ 4 ____________ -2 ___ 1 __ 0 (0 0 0 best outcomes) Iceresistance ____________________ 18 ___ 7 ___ 3 _____________-2 ___ 0 __-1 (0 0 0 best outcome) Rhino16 __________________________ 17 __ 10 ___ 4 _____________-3 ___ 3 __ 0 (2 2 0 best outcome) cptcatz ___________________________17 ___ 9 ___ 4 _____________-3 ___ 2 __ 0 (1 1 0 best outcome) NorthHillsWx ____________________ 17 ___ 9 ___ 3 ______________-3 ___ 2 __-1 (1 1 0 best outcome) ____ "Expert consensus" _________ 17 ___ 8 ___ 4 ______________-3 ___ 1 __ 0 (1 1 0 best outcome) TARCweather ____________________ 17 ___ 8 ___ 3 _____________ -3 ___ 1 __-1 (1 1 0 best outcome) ____ NOAA median _____________ 16.5 ___ 8 ___ 4 ____________-3.5 __ 1 __ 0 (0 0 0 best outcome) Yoda _____________________________ 16 ___ 9 ___ 5 _____________-4 ___ 2 __ 1 (best outcome 0 0 0) LoboLeader1 _____________________ 15 ___ 9 ___ 4 _____________-5 ___ 2 __ 0 (0 0 0 best outcome) Prospero _________________________ 14 __ 11 ___ 7 ______________-6 ___ 4 __ 3 (best outcome 2 2 2) ____________________________________________________________________ As of Kate (Aug 30) three forecasts were impossible to verify but those three could still win the contest by hitting their best possibles. With Larry a major hurricane in early September, a fourth forecast fell into this category. And with Mindy's arrival three more drifted into the Cannot Fully Verify Narrows. Most can still win the contest though if they hit their best possible outcomes as shown. Nicholas did not add any new members to the "cannot fully verify" category but drew even with our lowest prediction of number of storms. We are still one short of the lowest number of hurricanes predicted (7 by wxdude64 and Iceresistance), and had already seen one forecast passed by the number of majors (Brian5671, 2) with five others now level at 3. Various projections were made in the previous version of the table. Assuming the season is now 60% complete and that the second portion will match that for relative intensity, the projected end point would be (rounded off) 24 10 5 which implies a further count of 10 4 2. An assumption of higher intensity by one third would yield 24 12 6, a further count of 10 6 3. My subjective estimate is that the season may end around 24 13 5. (10 7 2 yet to come) ... the bottom three forecasts are just about eliminated from any chance to win at this point by the progression of possible outcomes that match their seasonal count, or beyond. By 16 the highest possible count is 16 8 5 so Yoda could win if that happened and then nothing else happened later. That would require storms 15 and 16 to be major hurricanes. By the time we reach 17 with any combination of possible H and M, the three forecasts at 14-16 are eliminated as each outcome would have a lower total error count with a higher-storm-number forecast. (by 17 the possible outcomes are these: The possible outcomes now from 19 7 4 would be then 20 7 4, 20 8 4, 20 8 5. and 21 7 4, 21 8 4, 21 8 5, 21 9 4, 21 9 5, 21 9 6 _________________ With the brief existence of TS Odette, three more forecasters have drifted into the shallows where their numbers cannot verify, but probably none of them are yet eliminated from any chance of winning the contest. After Peter and Rose, many more (most of the contest field) found themselves in the same shallows, so it's beginning to look like a few who still have possible verifying numbers are moving into the lead now. As the projected additional values for Sam are 1 1 1 there were no new forecasts pushed into the cannot verify shallows. (there could have been if anyone had been sitting at 110 required, or 100 required, but nobody was there). Teresa however has finished the search for perfection for six more forecasts, and there are now only three forecasts left standing (although they are not the only three that could win the contest) -- wxdude64 is currently at his predicted numbers of 19 7 4. Note: new feature below is current and projected scoring for today's count and any possible future counts for the next two storms (if there are two more). -
September 2021 temperature forecast contest
Roger Smith replied to Roger Smith's topic in Weather Forecasting and Discussion
First report on anomalies and projections ... ____________________ DCA _ NYC _ BOS __ ORD _ ATL _ IAH __ DEN _ PHX _ SEA 11th (anom 10d) ___--1.9 _--1.6 _ +2.3 __ +0.2 _--1.5 _ +1.0 __ +4.6 _+0.1 _ +1.3 21st (anom 20d) ___ +1.2 _ +0.9 _+3.3 __+4.1 _--1.6 _--0.4 __ +4.6 _+1.3 _ --0.8 29th (anom 28d) ___ +1.0_ +1.4 _ +4.4 __ +3.6 _--1.3 _--1.2 __ +4.6 _+0.2 _-0.6 11th (p anom 20d)_ +2.0_ +2.5 _ +3.0 __ +2.0 __ 0.0 __ 0.0 __ +3.0 _+1.0 _ +0.5 11th (p anom 27d)_ +2.0_ +2.5 _ +3.0 __ +2.5 _ +0.5 _ +0.5 __ +2.0 _+0.5 __ 0.0 21st (p anom 30d) _+1.0_ +1.0 _ +2.0 __ +2.5 _--1.0 _--0.5 __ +2.0 _+1.5 __ 0.0 29th (p anom 30d)_+0.8_ +1.0 _ +3.5 __ +3.0 _--1.5 _--1.2 __ +4.0 __ 0.0 _-0.7 confirmed anoms __+0.8_ +1.1 _ +4.1 __ +3.9 _--1.0 _--1.0 __ +4.0 __ 0.0 _ -0.7 (21st) _ Warmth has been more focused on the Midwest than further east, although Boston has remained well above normal. Recent rather cool weather in SEA is giving way to a somewhat warmer end of the month and DEN and PHX look set to finish the month above normal. The next 7-10 days in the east appear rather close to average if perhaps slightly cool at first. (29th) Final anomaly projections being updated for provisional scoring. (Oct 1st) Confirmed anomalies posted and scoring adjusted if necessary. -
2021 North Atlantic hurricane forecast contest
Roger Smith replied to Roger Smith's topic in Tropical Headquarters
I have updated the "storms now required" post a few posts back in the thread, for Mindy's brief appearance. A growing number of forecasts are now somewhat adrift as their numbers cannot fully verify, but I don't think very many forecasts are eliminated despite that, and it's going to be a very competitive end to the contest. I mentioned in that post that with a rather lackluster tropical outlook in the current models at this peak time of the season, perhaps 21 11 5 is the most likely finish we might expect (but it's just speculation). Count is now 13/5/3. (edit Sept 12) With the appearance of Nicholas, the count is 14/5/3 -- will wait to see if Nicholas happens to become a hurricane before updating the table of "storms required to verify." -
The meteorological season of summer is in the books, for Toronto it ranked tied tenth warmest with 2011, and it reminds me that I have not generated tables for seasonal ranks at NYC but it was probably closer to 30th there as all three months ranked lower than Toronto. Have already mentioned June in a previous post, so July 2021 was a rather average temperature month at both locations, then August went back to being very warm, in fact it was third warmest on record at Toronto, closer to 15th at New York City. Both locations set some new high minimum readings mostly in the last third of the month. While August 2021 was very dry at Toronto, both July and August were very wet in New York City which received several tropical remnants and after one rather weak daily rainfall record on May 29th, added five more by September 1st. I usually don't put any early new season data in the files, but as NYC had a daily rainfall record on Sept 1 (7.13") I have the first few days of the month in the updated file. So you'll find the links to the updated excel files in this post, if you would like to get the new information this past season, plus some new features that I have worked on in the NYC file, for average temperatures on a weekly time scale, together with extremes identified. There are also expansions of previous record temperature summaries. (updated excel files of data are attached to this post on net-weather, follow the link in the original post to find them)
-
June 2021 was fourth warmest in 182 tries at Toronto, and ninth warmest in 153 at NYC. For Toronto, only 2005, 1919 and 1949 were warmer. Even when the urban heat island was factored in, Toronto remained in fourth place, as most of the years ranked 5-20 are quite recent so they didn't gain much advantage over 2021. Generally speaking 1919 and 1949 had warmer daytime readings than 2005 or 2021, and June 1949 was also the driest month on record. Meanwhile, I have worked out the longest dry spells for NYC in similar fashion to the Toronto dry spells that are listed near the end of page one of this thread and summarized in the first post of page two. This is the list of all dry spells of 15 days (absolute, zero precip) or 20 days (small amounts allowed up to .01" per two days) Longest Dry Spells at NYC These lists rank the longest absolute dry spells (no precip over a trace amount), and extended dry spells (low precip totals that do not exceed .01" for every two consecutive days in the EDS). ____ ABSOLUTE DRY SPELLS ________________ EXTENDED DRY SPELLS _______ Rank _ Year ___ Days ___ Duration __________ Rank _ Year ___ Days, amt ___ Duration (longest ADS) _01 ___ 1924 ___ 36 ___ Oct 9 to Nov 13 _____ 01 ___ 2024 ___ 52 (.19") __ Sep 30 to Nov 20 (29, 11, 9) _02 ___ 2024 ___ 29 ___ Sep 30 to Oct 28 ____02 ___ 1995 ___ 46 (.18") __ July 29 to Sep 12 (24, 12)1 _03 ___ 1941 ___ 28 ___ Sep 5 to Oct 2 ______ 03 ___ 1924 ___ 44 (.01") __ Oct 9 to Nov 21 (36) t04 ___ 1884 ___ 27 ___ Sep 1 to 27 __________04 ___ 1952 ___ 43 (.21") __ Oct 3 to Nov 14 (8, 8.) t04 ___ 1910 ____27 ___ Sep 10 to Oct 6 _____t05___ 1901 ___ 40 (.20") __ Oct 15 to Nov 23 (16, 11) t06 ___ 1939 ___ 26 ___ Nov 6 to Dec 1 _____ t05___ 1949 ___ 40 (.12") __ May 27 to July 5 (19, 14) t06 ___ 1973 ___ 26 ___ Oct 3 to 28 _________ t07 ___ 1874 ___ 38 (.14") __ Oct 11 to Nov 17 (10, 9) t06 ___ 2001 ___ 26 ___ Apr 22 to May 17 ___ t07 ___ 1905 ___ 38 (.19") __ Oct 21 to Nov 27 (12) t09 ___ 1942 ___ 25 ___ Apr 11 to May 5 ____ t07 ___ 1910 ____ 38 (.19") __ Sep 7 to Oct 14 (27) t09 ___ 1968 ___ 25 ___ Feb 4 to 28 _________ t07 ___ 2001 ___ 38 (.17") __ Oct 17 to Nov 23 (17, 15) t 11 ___ 1922 ___ 24 ___ Sep 13 to Oct 6 _____t11 ___ 1882 ___ 34 (.08") __ July 20 to Aug 22 (13) t 11 ___ 1980 ___ 24 ___ Jan 23 to Feb 15 ___ t11 ___ 1899 ___ 34 (.17") __ May 12 to Jun 14 (15) t 11 ___ 1963 ___ 24 ___ Oct 4 to 27 _________t13 ___ 1881 ___ 33 (.10") __ Aug 8 to Sep 9 (11) t 11 ___ 1995 ___ 24 ___ Aug 7 to 30 _________t13 ___ 1943 ___ 33 (.13") __ Nov 23 to Dec 25 (13,19) t 15 ___ 1877 ___ 23 ___ Dec 7 to 29 _________t13 ___ 1999 ___ 33 (.16") __ July 3 to Aug 4 (9) t 15 ___ 1991 ___ 23 ___ Oct 18 to Nov 9 _____t16 ___ 1886 ___ 32 (.13") __ Aug 8 to Sep 8 (14) t_15 ___ 2015 ___ 23 ___ Apr 23 to May 15 ___t16 ___ 1886 ___ 32 (.06") __ Sep 24 to Oct 25 (20) _ 18 ___ 1988 ___ 22 ___ Nov 29 to Dec 20 ___t16 ___ 1947 ___ 32 (.11") __ Sep 27 to Oct 28 (12, 9) t 19 ___ 1870 ___ 21 ___ Aug 27 to Sep 16 ____t16 ___ 1963 ___ 32 (.14") __ Sep 30 to Oct 31 (24) t 19 ___ 1895 ___ 21 ___ Feb 9 to Mar 1 ______ t20 ___ 1903 ___ 31 (.11") __ May 7 to June 6 (12,15) t 19 ___ 1904 ___ 21 ___ Aug 23 to Sep 12 ____t20 ___ 1955 ___ 31 (.12") __ Nov 21 to Dec 21 (14) t 19 ___ 1908 ___ 21 ___ Sep 7 to Sep 27 _____t20 ___ 1966 ___ 31 (.09") __ June 18 to July 18 (11) t 19 ___ 1917 ____21 ___ Oct 31 to Nov 20 ____t20 ___ 1989 ___ 31 (.16") __ Nov 29 to Dec 29 (14, 14) t 19 ___ 1962 ___ 21 ___ June 27 to July 17 ___ 24 ___ 1909 ___ 30 (.14") __ Oct 24 to Nov 22 (12) t 25 ___ 1886 ___ 20 ___ Sep 24 to Oct 13 ___ t25 ___ 1877-78_29 (.04") __ Dec 6 to Jan 3 (23) t 25 ___ 1944 ___ 20 ___ Aug 23 to Sep 11 ___ t25 ___ 1880 ___ 29 (.11") __ May 1 to 29 (17) t 25 ___ 1999 ___ 20 ___ May 25 to June 13 __ t25 ___ 1884 ___ 29 (.08") __ Aug 31 to Sep 28 (27) t 28 ___ 1914 ___ 19 ___ Sep 26 to Oct 14 ____t25 ___ 1973 ___ 29 (.03") Sep 30 to Oct 28 (26) t 28 ___ 1917 ___ 19 ___ Sep 9 to 27 _________ t25 ___ 1985 ___ 29 (.14") __ Oct 6 to Nov 3 (10) t 28 ___ 1938 ___ 19 ___ Aug 12 to 30 ________t25 ___ 2001 ___ 29 (.07") Apr 22 to May 20 (26) t 28 ___ 1943 ___ 19 ___ Dec 7 to 25 _________ t31 ___ 1910 ___ 28 (.11") __ June 19 to July 16 (9) t 28 ___ 1949 ___ 19 ___ May 30 to Jun 17 ____t31 ___ 1941 ___ 28 (.00") __ Sep 5 to Oct 2 (28) t 28 ___ 1976 ___ 19 ___ Apr 3 to 21 __________t31 ___ 1964 ___ 28 (.11") __ Oct 22 to Nov 18 (14,10) t 28 ___ 1978 ___ 19 ___ Oct 28 to Nov 15 ____t31 ___ 1976 ___ 28 (.02") __ Nov 1 to 28 (9, 18) t 28 ___ 2007 ___ 19 ___ Aug 22 to Sep 9 ____ t31 ___ 2003 ___28 (.14") __ Jan 7 to Feb 3 (8) t 36 ___ 1894 ___ 18 ___ Aug 21 to Sep 7 ____ t36 ___ 1908 ___ 27 (.09") __ June 17 to July 13 (9,9) t 36 ___ 1903 ___ 18 ___ Apr 16 to May 3 ____ t36 ___ 1955 ___ 27 (.05") __ July 11 to Aug 6 (13, 10) t 36 ___ 1976 ___ 18 ___ Nov 11 to 28 ________t36 ___ 1980 ___ 27 (.08") __ Jan 20 to Feb 15 (24) t 36 ___ 1977 ___ 18 ___ Apr 6 to 23 _________ t36 ___ 2005 ___ 27 (.09") __ July 18 to Aug 13 (11) t 36 ___ 1980 ___ 18 ___ June 11 to 28 _______ t40 ___ 1902 ___ 26 (.09") __ Oct 29 to Nov 22 (14, 9) t 36 ___ 2017 ___ 18 ___ Sep 20 to Oct 7 _____ t40 ___ 1915 ___ 26 (.02") __ Mar 8 to Apr 2 (15, 10) t 42 ___ 1875 ___ 17 ___ Aug 24 to Sep 9 _____ t40 ___ 1916 ___ 26 (.12") __ Aug 12 to Sep 6 (10) t 42 ___ 1880 ___ 17 ___ May 1 to 17 __________t40 ___ 1931 ___ 26 (.08") __ Nov 1 to 26 (13) t 42 ___ 1887 ___ 17 ___ May 8 to 24 _________ t40 ___ 1939 ___ 26 (.00") __ Nov 6 to Dec 1 (26) t 42 ___ 1908 ___ 17 ___ Nov 19 to Dec 5 _____t40 ___ 1950 ___ 26 (.09") __ Sep 14 to Oct 9 (16) t 42 ___ 1939 ___ 17 ___ Oct 4 to 20 __________t46 ___ 1900 ___ 25 (.06") __ Dec 5 to 29 (16) t 42 ___ 1945 ___ 17 ___ Aug 7 to 23 _________ t46 ___ 1914 ___ 25 (.03") __ Aug 30 to Sep 23 (15) t 42 ___ 1946 ___ 17 ___ Sep 4 to 20 _________ t46 ___ 1942 ___ 25 (.00") __ Apr 11 to May 5 (25) t 42 ___ 1948 ___ 17 ___ Aug 23 to Sep 8 _____ t46 ___ 1981 ___ 25 (.09") __ Jan 8 to Feb 1 (15) t 42 ___ 1961 ___ 17 ___ Aug 28 to Sep 13 ____t46 ___ 2004 ___ 25 (.11") __ Feb 8 to Mar 3 (13) t 42 ___ 1986 ___ 17 ___ Feb 22 to Mar 10 ____ t46 ___ 2005 ___ 25 (.08") __ Aug 20 to Sep 13 (13) t 42 ___ 1999 ___ 17 ___ Nov 3 to 19 __________t52 ___ 1869 ___ 24 (.06") __ Oct 24 to Nov 16 (11) t 42 ___ 2001 ___ 17 ___ Oct 17 to Nov 2 ______t52 ___ 1874 ___ 24 (.02") __ Aug 23 to Sep 15 (12,11) t 42 ___ 2010 ___ 17 ___ Aug 26 to Sep 11 ____ t52 ___ 1904 ___ 24 (.06") __ Aug 21 to Sep 13 (21) t 55 ___ 1877 ___ 16 ___ Sep 18 to Oct 3 ______t52 ___1909 ___ 24 (.06") __ June 29 to July 22 (8) t 55 ___ 1881 ___ 16 ___ July 14 to 29 _________t52 ___ 1922 ___ 24 (.00") __ Sep 13 to Oct 6 (24) t 55 ___ 1895 ___ 16 ___ June 7 to 22 _________ t52 ___ 1959 ___ 24 (.04") __ Sep 4 to 27 (16) t 55 ___ 1900 ___ 16 ___ Dec 12 to 27 _________t52 ___ 1968 ___ 24 (.07") __ Sep 12 to Oct 5 (12) t 55 ___ 1901 ___ 16 ___ Oct 20 to Nov 4 ______t52 ___ 1972 ___ 24 (.12") __ July 22 to Aug 14 (11) t 55 ___ 1902 ___ 16 ___ Apr 10 to 25 _________t52 ___ 2013 ___ 24 (.11") __ Oct 8 to 31 (11) t 55 ___ 1923 ___ 16 ___ Sep 24 to Oct 9 ______t52___ 2015 ___ 24 (.05") __ Apr 22 to May 15 (23) t 55 ___ 1950 ___ 16 ___ Sep 23 to Oct 8 ______t62 ___ 1872 ___ 23 (.10") __ Feb 15 to Mar 8 (10) t 55 ___ 1959 ___ 16 ___ Sep 12 to 27 _________t62 ___ 1885 ___ 23 (.07") __ Sep 10 to Oct 2 (12) t 55 ___ 1964 ___ 16 ___ May 16 to 31 ________ t62 ___ 1894 ___ 23 (.08") __ Aug 16 to Sep 7 (18) t 55 ___ 1967 ___ 16 ___ May 30 to June 14 ___ t62 ___ 1896 ___ 23 (.11") __ Jan 1 to 23 (9) t 55 ___ 1970 ___ 16 ___ Feb 16 to Mar 3 _____ t62 ___ 1964 ___ 23 (.09") __ Aug 19 to Sep 10 (12) t 55 ___ 1987 ___ 16 ___ Aug 11 to 26 _________t62 ___ 1991 ___ 23 (.00") __ Oct 18 to Nov 9 (23) t 55 ___ 1988 ___ 16 ___ Aug 1 to 16 __________t62 ___ 1999 ___ 23 (.08") May 25 to June 16 (20) t 55 ___ 2020 ___ 16 ___ Sep 11 to 26 ________ t69 ___ 1870 ___ 22 (.03") __ Aug 26 to Sep 16 (21) t 55 ___ 2021 ___ 16 ___ Mar 2 to 17 _________ t69 ___ 1899 ___ 22 (.10") __ Nov 20 to Dec 11 (11) t 71 ___ 1876 ___ 15 ___ June 25 to July 9 _____t69 ___ 1917 ___ 22 (.01") __ Oct 31 to Nov 21 (21) t 71 ___ 1876 ___ 15 ___ Aug 18 to Sep 1 _____ t69 ___ 1968 __ 22 (.08") Apr 2 to 23 (13) t 71 ___ 1886 ___ 15 ___ June 25 to July 9 _____t69 ___ 1973 ___ 22 (.11") __ Nov 2 to 23 (14) t 71 ___ 1895 ___ 15 ___ Oct 16 to 30 _________t69 ___ 1981 ___ 22 (.11") Aug 17 to Sep 7 (14) t 71 ___ 1899 ___ 15 ___ Apr 18 to May 1 _____t69 ___ 1988 ___ 22 (.00") __ Nov 29 to Dec 20 (22) t 71 ___ 1899 ___ 15 ___ May 30 to June 13 ___t69 ___ 1999 ___ 22 (.10") __ Nov 3 to 24 (17) t 71 ___ 1903 ___ 15 ___ May 23 to June 6 ____t77 ___ 1877 ___ 21 (.06") __ Feb 3 to 23 (15) t 71 ___ 1908 ___ 15 ___ May 31 to June 14 ___t77 ___ 1895 ___ 21 (.00") __ Feb 9 to Mar 1 (21) t 71 ___ 1908 ___ 15 ___ Oct 11 to 25 _________t77 ___ 1904 ___ 21 (.05") __ Nov 14 to Dec 4 (12) t 71 ___ 1909 ___ 15 ___ Aug 21 to Sep 4 ______t77 ___ 1908 ___ 21 (.00") __ Sept 7 to 27 (21) t 71 ___ 1912 ___ 15 ___ June 26 to July 10 ____t77 ___ 1908 ___ 21 (.10") __ Nov 16 to Dec 6 (17) t 71 ___ 1913 ___ 15 ___ May 1 to 15 __________t77 ___ 1923 ___ 21 (.04") __ Sep 24 to Oct 14 (16) t 71 ___ 1914 ___ 15 ___ Sep 9 to 23 __________ t77 ___ 1935 ___ 21 (.05") __ May 8 to 28 (14) t 71 ___ 1915 ___ 15 ___ Mar 8 to 22 __________t77 ___ 1940 ___ 21 (.09") __ Oct 9 to 29 (13) t 71 ___ 1925 ___ 15 ___ Aug 22 to Sep 5 ______t77 ___ 1962 ___ 21 (.00") __ June 27 to July 17 (21) t 71 ___ 1930 ___ 15 ___ July 30 to Aug 13 _____t77 ___ 2000 ___ 21 (.01") __ Oct 19 to Nov 8 (10, 10) t 71 ___ 1932 ___ 15 ___ July 5 to 19 ___________t77 ___ 2006 ___ 21 (.05") __ Mar 13 to Apr 2 (11) t 71 ___ 1953 ___ 15 ___ Aug 18 to Sep 1 ______t77 ___ 2010 ___ 21 (.11") __ May 19 to June 8 (9) t 71 ___ 1964 ___ 15 ___ June 22 to July 7 ______t77 ___ 2012 ___ 21 (.10") __ Mar 4 to 24 (7) t 71 ___ 1968 ___ 15 ___ July 4 to 18 ___________t77 ___ 2023 ___ 21 (.07") __ Oct 31 to Nov 21 (13) t 71 ___ 1974 ___ 15 ___ Sep 30 to Oct 14 ______t91 ___ 1879 ___ 20 (.02") __ Sep 29 to Oct 18 (13) t 71 ___ 1978 ___ 15 ___ Aug 13 to 27 __________t91 ___ 1886 ___ 20 (.07") __ Feb 27 to Mar 18 (13) t 71 ___ 1979 ___ 15 ___ Oct 13 to 27 __________t91 ___ 1887 ___ 20 (.01") __ May 8 to 27 (17) t 71 ___ 1980 ___ 15 ___ Aug 16 to 30 __________t91 ___ 1892 ___ 20 (.05") __ Sep 15 to Oct 4 (12) t 71 ___ 1981 ___ 15 ___ Jan 17 to 31 ___________t91 ___ 1897 ___ 20 (.02") __ Sep 3 to 22 (10) t 71 ___ 2001 ___ 15 ___ Nov 5 to 19 ___________t91 ___ 1901 ___ 20 (.10") __ Feb 10 to Mar 1 (8) t 71 ___ 2012 ___ 15 ___ Apr 3 to 17 ___________t91 ___ 1910 ___ 20 (.09") __ Nov 5 to 24 (7) t 71 ___ 2015 ___ 15 ___ Sep 14 to 28 __________t91 ___ 1914 ___ 20 (.06") __ Sep 26 to Oct 15 (19) t 71 ___ 2020 ___ 15 ___ June 12 to 26 _________t91 ___ 1944 ___ 20 (.00") __ Aug 23 to Sep 11 (20) t71 ___ 2024 ___ 15 ___ July 18 to Aug 1 _______t91 ___ 1946 ___ 20 (.09") __ Nov 27 to Dec 16 (14) t71 ___ 2024 ___ 15 ___ Sep 8 to 22 ___________t91 ___ 1963 ___ 20 (.10") __ Mar 27 to Apr 15 (7) t102___1871 ___ 14 ___ May 17 to 30 _________t91 ___ 1968 ___ 20 (.04") __ June 29 to July 18 (15) t102___1886 ___ 14 ___ Aug 17 to 30__________t91 ___ 1971 ___ 20 (.09") __ Apr 8 to 27 (13) t102___1890 ___ 14 ___ Nov 19 to Dec 2 ______t91 ___ 1976 ___ 20 (.03") __ Apr 2 to 21 (19) t102___1891 ___ 14 ___ Oct 27 to Nov 8 ______ t91 ___ 1978 ___ 20 (.05") __ Oct 28 to Nov 16 (19) t102___1902 ___ 14 ___ Oct 29 to Nov 10______t91 ___1985-86_ 20 (.07") __ Dec 14 to Jan 2 (6) t102___1904 ___ 14 ___ Oct 22 to Nov 4 _______t91 ___ 1986 ___ 20 (.08") __ Mar 16 to Apr 4 (7, 7) t102___1906 ___ 14 ___ Jan 25 to Feb 7 ________t91 ___ 2010 ___ 20 (.03") __ June 23 to July 12 (10) t102___1908 ___ 14 ___ Oct 31 to Nov 13 ______t91 ___ 2020 ___ 20 (.05") __ June 7 to 26 (15) t102___1910 ___ 14 ___ Mar 21 to Apr 3 _______t91 ___ 2023 ___ 20 (.02") __ Apr 2 to 21 (13) t102___1912 ___ 14 ___ Feb 5 to 18 ___________t111 ___ 1895 ___ 19 (.03") __ Dec 3 to 21 (12) t102___1914 ___ 14 ___ Nov 21 to Dec 4 ______t111 ___ 1902 ___ 19 (.06") __ Apr 10 to 28 (16) t102___1918 ___ 14 ___ Aug 15 to 28 _________ t111 ___ 1905 ___ 19 (.09") __ Feb 13 to Mar 3 (11) t102___1921 ___ 14 ___ Aug 19 to Sep 1 ______ t111 ___ 1915 ___ 19 (.06") __ Aug 31 to Sep 16 ( 9 ) t102___1923 ___ 14 ___ Nov 8 to 21 ___________t111 ___ 1917 ___ 19 (.00") __ Sep 9 to 27 (19) t102___1926 ___ 14 ___ Apr 10 to 23 __________t111 ___ 1918 ___ 19 (.10") __ Mar 15 to Apr 2 (11) t102___1933 ___ 14 ___ Apr 19 to May 2 ______t111 ___ 1938 ___ 19 (.00") __ Aug 12 to 30 (19) t102___1935 ___ 14 ___ May 15 to 28 _________ t111 ___ 1944 ___ 19 (.05:) __ Oct 21 to Nov 8 (13) t102___1944 ___ 14 ___ Sep 29 to Oct 12 _____ t111 ___ 1048 ___ 19 (.09") __ Aug 21 to Sep 8 (17) t102___1946 ___ 14 ___ Nov 28 to Dec 11 _____t111 ___ 1948 ___ 19 (.10") __ Sep 11 to 29 (11) t102___1949 ___ 14 ___ June 20 to July 3 ______t111 ___ 1964 ___ 19 (.03") __ July 30 to Aug 17 ( 9 ) t102___1953 ___ 14 ___ Nov 8 to 21 ___________t111 ___ 1967 ___ 19 (.08") __ May 30 to June 17 (16) t102___1955 ___ 14 ___ Dec 5 to 18 ___________t111 ___ 1980 ___ 19 (.01") __ June 10 to 28 (18) t102___1961 ___ 14 ___ Nov 25 to Dec 8 ______t111 ___ 1980 ___ 19 (.07") __ Aug 12 to 30 (15) t102___1962 ___ 14 ___ July 24 to Aug 6_______t111 ___ 1985 ___ 19 (.03") __ Feb 13 to Mar 3 (10) t102___1964 ___ 14 ___ Oct 22 to Nov 4 ______ t111 ___1986 ___ 19 (.09") ___ Feb 22 to Mar 12 (17) t102___1973 ___ 14 ___ Jan 5 to 18 ____________t111 ___ 1988 ___ 19 (.01") ___ July 29 to Aug 16 (16) _ t102___1973 ___ 14 ___ Feb 17 to Mar 2 ______ t111 ___ 2007 ___ 19 (.00") ___ Aug 22 to Sep 9 (19) t102___1973 ___ 14 ___ Nov 2 to 15 ___________t 111 ___ 2012 ___ 19 (.07") ___ Apr 2 to 20 (15) _ 129 EDS t102___1981 ___ 14 ___ Aug 17 to 30 __________t130 ___ 18 day EDS t102___1988 ___ 14 ___ Sep 18 - Oct 1 t102___1989 ___ 14 ___ Nov 29 to Dec 12 t102___1989 ___ 14 ___ Dec 16 to 29 ___ t102___1997 ___ 14 ___ Sep 30 to Oct 13 t102___2001 ___ 14 ___ July 27 to Aug 9 t102___2008 ___ 14 ___ Aug 16 to 29 ___ t102___2013 ___ 14 ___ Sep 23 to Oct 6 ___ 137 total Most of the EDS entries, if not extensions of the first list of absolute dry spells, contain 9-15 day ADS intervals, and a few entries such as Aug 23 to Sep 11 1944 add no days at either end of a long ADS, so the EDS is the original ADS. A few EDS have two ADS in their duration, for example 24d EDS in 1874 had 12d and 11d ADS separated by .02" 21 days from Oct 19 to Nov 8 2000 had only .01" (on Oct 29, dividing this into two ten-day dry spells). Two long dry spells in Sep-Oct 1914 were separated by only .28" in two days, and narrowly missed combining for an eligible 49-day EDS. The average year has 6.4 EDS (10d or longer) which include 3.6 ADS. The average EDS is 15 days long. Those associated with an ADS are on average about 14 days long. As the amount of precipitation varies from nil to .10" per 20 days, the total precipitation in all these dry spells is probably around 50" (two fairly dry years, but the total length of these dry spells is about 40 years). The average year has 88.7 days within the various dry spells, the range is 30 (2014) (31 2022) to 159 (1909) followed by 155 in 1885 and 154 in driest year 1965. ... 2024 is already closing in on 120. 2014, 2022, 1996, 2018 and 1945 had the fewest days in qualifying dry spells, however, they were not wettest years, their cycle of wet and dry seemed to be closer to 7-8 days. Considering how much rain fell in 1983, the year managed an almost average output of dry spells, mainly in February and the late autumn. This is a frequency distribution of the months involved in the 137 longest absolute dry spells of 14 or more days, frequency assigned by nearest 0.1 portions when the dry spell overlaps two months. JAN _ FEB _ MAR _ APR _ MAY _ JUN _ JUL _ AUG _ SEP _ OCT _ NOV _ DEC 2.8 ___ 6.2 __ 3.8 ___ 8.4 __ 9.1 __10.1 __ 8.7 __21.9 __22.0 _ 19.4 __16.0 __ 9.6 This frequency distribution shows that late summer into autumn is favored for long dry spells, winter and early spring least favored, with a slight secondary peak around late May through June. About half of the dry spell frequency is in the period August to October. The following is a graph of the number of days each year (1869-2020) within qualifying dry spells. There are peaks around the 1880s, 1900s, 1960s and (early) 1980s. Peak years from graph: ___ 1885 _ 1909 _____ 1965_1980 _ (2010)
-
(posted June 7, 2021) All updates have been completed now for May 2021 and spring 2021 data, in the tables through this thread, and also in the excel files that support them. May 2021 was running very warm at both locations but cooled down significantly near the end of the month, ending up just above long term averages as a result. The depth of cold at the end was considerable and some daily records were set, notably two low maxima for NYC with one being a "benchmark" low maximum (latest so cold in the season). Toronto managed to break some rather weak high max and min records before the cold arrived and the most notable record there was a trace of snow on May 28th, fourth latest on record. The nearby airport weather station (CYYZ) had a measurable amount of 0.2 cm which represents their latest measurable snowfall in any spring season (but their records go back only about 80 years). The updated excel files have all the data since the last posting of them, and some new features that weren't available in the previous editions. There are now logs of NYC record highs and lows giving an overview of historical trends, and making it possible to calculate easily what the records looked like at various points in the past. The data files are attached. (once again, American Weather Forum readers should follow the link in the original post to net-weather to download, but go to the last post rather than this one. That has not been posted yet on Net-weather, but I plan to post it within the next few hours. It will contain the updated files through August (and it has the Sept 1 2021 rainfall record for NYC in the tables).
-
_________________ ________________ The decade of 1961-70 slowed the pace of record setting (for high maxima) with a total count of 51.67 which resulted in 26.66 eventual records (counting ties). This was still a bit ahead of random expectation (38 and 24.2), indicating that the climate had not cooled back to the levels of the early decades. A total of 60 records were set on 57 days of the year but 16 were only ties of previous records for a count of 49.33 (the extra 2.33 is because of two cases where two years from the decade took turns setting a record on the same date in addition to one three-way tie being replaced by an exclusive record within the decade). We are at the point of approaching a hundred years of records (1968) where years at random would be setting 3.7 new records (and retaining 2.4 to the end of the data). In this decade, August was noticeably cooler than in previous decades and set very few top ten calibre temperatures, with only one record. July 1966 had prolific heat but the other nine years of this decade didn't contribute much to that month's record totals either, it was probably autumn that kept this decade productive relative to previous decades. This decade produced about twice as many sustained record low minima as the previous decade (22 vs 11 in rounded terms). Winters turning colder was one of the main reasons for this. 1961 __ This year started out quite cold but February warmed to above normal temperatures which lasted into early March. The rest of the spring and most of the summer were cool to near average, then the autumn was quite warm with several records set. The year set nine records, two being ties so that the count is 8.00. Of those, four have survived with a count of 3.50, so the survival rate is 43.3%. These 1961 records broke previous values by an average of 1.7 F deg. The average year breaking five of them is 1987, which becomes 2002 if the four surviving records fall later this year. The average surplus of eventual record highs is 3.8 F deg which reduces to 2.1 F deg counting the surviving records. On the low maximum side of the ledger, no records were set in a cold spell in late January and early February but the temperature stayed below freezing from Jan 19th to Feb 3rd with most days not far from 20F. A record was set on May 27th (47F) which was a late season benchmark. The winter cold spell came within one degree (Feb 2nd -2F) of setting a daily minimum record (1881 had -3F). That was one of five occasions when 1961 recorded the coldest value after an earlier record. The low on May 27th was a benchmark record (41F) and the next day added a tie (43F) with 1907 (count 1.50). This was most of the year's production, another tied record (September 16th tied 1913 at 49F) brought the year's count to 2.0 but that tie was soon broken first in 1964 and later by 1966. (survival rate 75%). There are also two surviving record high minima in 1961 from an original count of 3.5, both are tied for a count of 1.00. Aug 25th (76F) tied with 1998 and Oct 31 (62F) with 1881. Several other days were within 1 or 2 deg of eventual or already set record high minima in the autumn months including 61F on Nov 4th and 62F on Nov 5th. Temp ___ date ___ replaces _ ties ______ broken ___ eventual end of data record max, recent max _63F ___ Feb 19 ___ 1948,49,54 (59F) ___ 1997 (66F) __ 1997 (66F) __ (2017 2nd (65F), 1961 3rd (63F), 1994 4th (61F), 1948,49,54.81 t5th (59F)). _65F ___ Feb 24 ____________ 1930 (65F) _1985 (75F) __ 1985 (75F) __ (2017 2nd (70F), 1930,61 t-3rd (65F), 2000 5th (64F), 1984 6th (63F)). _64F ___ Mar 3 ___ 1871,1923 (63F) ____ 1991 (65F) __ 2024 (68F) __ (1961,67 t-3rd (64F), 1871,1923,72 t-5th (63F), 2002 8th (61F), 2004,07,20 t-9th (59F)). _96F ___ June 13 __ eventual record .. (1892 2nd (95F), 1984,2017 t-3rd (94F), 1940,83,88 t-5th (93F), 1956 8th (91F)). _93F ___ Sep 5 ___ 1884,98,1944,59 (90F) _ 1985 (94F) __ 1985 (94F) __ (1961 2nd (93F), 1983 3rd (91F), 1884,98,1944,59,70,71 t-3rd (90F)). _94F ___ Sep 12 ___ eventual record .. (1895 2nd (93F), 1952,2005 t-3rd (90F), 1936,1981 t-5th (89F), 1920,32,47,82 t-7th (88F)). _82F ___ Oct 30 ___ eventual record tied by 1946 .. (1950 3rd (79F), 2016 4th (76F), 1918,94 t5th (75F), 1971 7th (74F)). _77F ___ Nov 4 ___ 1914 (76F) __________1975 (78F) __ 1975 (78F) __ (1961,87 t-2nd (77F), 1914,74,94 t-4th (76F), 1990 7th (73F)). _78F ___ Nov 5 ___ eventual record .. (1938 2nd (74F), 1935,75,94 t-3rd (73F), 1959, 2005 t-6th (72F), 2015 8th (71F), __ __ __ __ __ __ 1984 9th (69F), 1948 10th (68F), 1900,34,2020 t-11th (67F)). Record high minima (3.5), end of data 1.0 have survived _75F ___ June 13 ___ 1898 (74F) _________ 2017 (77F) __ 2017 (77F) __ 1961 later tied by 2005 (75F) _76F ___ Aug 25 ___ eventual record high minimum later tied by 1998 __ broke 1891,98 (75F), also 1979 (75F) _75F ___ Sep 13 ___ not a record in 1961 (1890 _76F is record), remains tied second highest with 1906, 1947 _70F ___ Sep 25 ___ not a record in 1961 (1881, later 1970 _71F record), remains tied third highest with 1945,2011,2017. _62F ___ Oct 31 ___ eventual record high minimum tied 1881 __ 1946, 1989, 2019 (60F) _61F ___ Nov 4 ____ 1948 (59F) __________ 1982 (62F) __ 1982 (62F) __ 1961 later tied by 1975 (61F) _62F ___ Nov 5 ___ not a record in 1961 (1938 _63F is record), remains second highest _57F ___ Nov 14 __ not a record in 1961 (1951 _58F is record), remains tied second highest with 2008 ________________________________________ 1962 __ This year had a very warm spring after quite a cold winter, and set several records including the all-time May record (19th) of 99F, but one potential record was lost to an earlier high reading: 91F Apr 27th was not a record (92F 1915). The summer became rather cool and autumn was near normal with a few warmer days. December turned quite cold again. The year set five records, with two ties reducing the count to 4.00. The monthly maximum for May (99F on 19th) was the most notable. Of these, two have survived but one has been tied twice since, giving a count of 1.33 and a survival rate of 33.3%. These 1962 records increased former values by an average of 2.0 F deg. The average year breaking three of them was 1996 which would become 2006 if the two surviving records fell at the next opportunity. The three broken 1962 records were eventually surpassed by an average of 2.0 F deg which reduces to 1.2 F if the two surviving marks are included. Two low maxima occurred between the Apr 28 and May 19 record highs, 45F on May 2nd and 49F on May 8th. July 18th had a record low maximum of 66F, August 10th only 60F (a benchmark as July's minimum was 61F), and the 11th at 68F tied 1931 and 1933. Oct 26th was another benchmark low maximum (39F). The final day of the year had a high of 13F but that had been beaten in 1917 (6F). The total for the year was five and the count 5.33. There was just a one-sixth share in the March 3rd minimum record (11F) and a record of 56F on Aug 11th, for a count of 1.17 ... this was the year's actual production of record low minima but the tie was fifth of an eventual six, so within the year the count was 1.2, which makes the survival rate 97.3%. In addition, there were five occasions when 1962 at least tied for coldest after an earlier record (count 3.7), most of those in July which often ran within 2-3 degrees of earlier record lows. There were no surviving high minima; the May heat wave came with relatively moderate overnight lows that were not close to records (Toronto seemed to have a longer heat wave and did set some high minimum values near 70F, as well as matching the monthly maximum, in their case 94F later tied by May 29, 1969 which was 97F at NYC). The year set two record high minima that were later eclipsed, and the extinction date was Apr 28, 1990. Temp ___ date ___ replaces _ ties ______ broken ___ eventual end of data record max, recent max _79F ___ Mar 30 __ 1910 (78F) _________ 1998 (82F) __ 1998 (82F) __ (1962,77 t-2nd (79F), 1910,86 t-4th (78F), 1979 6th (76F), 1945 7th (74F)). _86F ___ Apr 22 __ eventual record later tied by 1973, 2001 .. (1977,85 t-4th (85F), 1902 6th (84F), 1926,2004 t-7th (82F)). _89F ___ Apr 28 ___________ 1938 (89F) _ 1990 (90F)__1990,2009 (90F) __ (1938,62 t3rd (89F), 1969 5th (86F), 1983,2017 t6 (85F)). _99F ___ May 19 __ eventual record .. (2017 2nd (91F), 1964,96 t-3rd (89F), 1903 (88F), 1885,1906,98 t-6th (87F)) [May monthly max] _68F ___ Dec 1 ____________ 1927 (68F) _ 2001 (69F) ___2006 (70F) ___ (1927,62 t-3rd (68F), 1991 6th (66F), 2014 7th (65F)). Record high minima (1.5), end of data none have survived, extinction date Apr 28, 1990 _57F ___ Mar 31 ___ 1945,60 (51F) _____ 1986 (60F) __ 1998 (60F) __ 1962 later tied by 1981 (57F) _62F ___ Apr 28 ___________ 1935 (62F) __ 1990, 2009 (69F) _ 1990, 2009 (69F) __ 1935,62 later tied by 1983 (62F) __________________________________________________________________ 1963 __ The winter was cold as in Britain and Ireland, then the spring warmed rapidly with quite a variable regime, followed by a rather hot summer although August turned cool, as was September. October became very warm and rivalled 1947 for top spot even by the end of the data series. Both months produced average maximum values of 72F. There were numerous days in the low 80s some of which did not reach record status (these include 83F 7th, 16th and 17th). This warmth persisted into most of November but December turned very cold. There were ten record highs set, one being an ordinary tie and two with two previous ties, for a count of 8.17. Of those, five have survived, two becoming or already tied for a count of 4.00, and a survival rate of 49.0%. These 1963 records broke previous marks by an average of 1.9 F deg. The average year breaking five records from 1963 was 1983, which changes to 2002 if the five surviving records fall in the next ten months. The average surplus of eventual records to the five broken from 1963 was 2.6 F deg which drops to 1.3 F if the five surviving records are included. There were also four record low maxima, 21F on Feb 22nd, a one-quarter share of 73F on July 14th (count 1.25), a benchmark 56F on Sep 6th and then 57F on Sep 23rd -- like 1947, this autumn started very cool before turning record warm. The count was 3.25. There were seven record low minima, 8F on Feb 22nd (tied 1918). Earlier, -2F on Feb 8th had lost out to 1934. May 23-24 had 43F and a benchmark low 39F. July 9th had 54F. September 5th had 51F and the 13th 46F with 40F on the 24th. The count was 6.50 making 1963 one of the most variable years in terms of exceeding random expectation on both sides of normal. Within the year, the count was 7.5, which is higher than all later years as was the count of surviving records (1976 had 6 in both categories). With a ratio of 1.95 actual to expected record low minima, the surplus was greater than any later year and most previous years except for 1940 (2.07), 1888 (3.26) and 1875 (2.35). Even 1914 with its 15.0 count had a slightly lower ratio to expected (1.89). 1963 also had seven days with minima that were lowest since records set, in years as far back as 1880. With one tie for any of those, the count was 6.33, in the top ten of all years (1967 and 1976 both had 9.58, 1940 had 7.25, 2000 and 2018 had 6.83, 1933 had 6.53 and several others had similar counts to 1963). There were no record high minima set during the year, the third such occasion after 1924 and 1958; the warm spell in October had clear skies and low humidities and it seems that in later autumn, cloud cover is necessary for record high minima to be set. Overall, there is also some question about whether Central Park is a more effective cooling location in warm weather than wherever the temperatures were recorded before the move into the park around 1920. The year 1908 in particular had a lot of record high minima, something perhaps worth checking, as it had few record high maxima. 1963 also followed closely the timing of major warmth of its rival, 1947, which also did better with the production of record high minima. As with 1924 and 1958, the minima were compared to starter era records, had 1963 been in that period (1869 to 1900) it would have set 10.0, a count well in excess of 1924 (1.0) and 1958 (3.5) and close to the average for that era. The extinction date would have been March 26, 1946 (51F). The March 26 minimum of 50F is now the closest to any eventual record high minimum, which was 52F in 1986 tied 2021. A low of 75F on July 27th was not a starter era record but is now second closest at 3F to the 78F date record. Temp ___ date ___ replaces _ ties ______ broken ___ eventual end of data record max, recent max _79F ___ Mar 25 __ eventual record .. (1913 2nd (77F), 1910,64 t-3rd (75F), 2016 5th (72F), 1921 6th (71F), 1920,87,88 t-7th (70F)). _80F ___ Apr 2 ____ 1918 (78F) __________ 1967 (81F) __ 1967 (81F) __ (1963 2nd (80F), 1918 3rd (78F), 1934 4th (77F), 1946 5th (75F)). 2006,10 (68F). _86F ___ May 4 ___ 1944 (85F) ___________1965 (90F) __ 2001 (92F) __ (1965 2nd (90F), 1963 3rd (86F), 1944, 2015 t-4th (85F), 2018 6th (84F), 1942,49 t-5th (83F)) _94F ___ June 28 __________ 1870,80 (94F)_1969 (96F) __ 1969,91 (96F) _ (1870,80,1963 t-3rd (94F), 1901,66,2010 t-6th (93F)). _98F ___ July 27 ___ eventual record tied by 1940 .. (1955,2005 t-3rd (97F), 1999 5th (96F), 1899 6th (95F), 1941,51 t-7th (94F)). _83F ___ Oct 19 ___ 1945 (80F) ___________ 2016 (85F) _ 2016 (85F) __ (1963 2nd (83F), 1965 3rd (81F), 1945 4th (80F), 1928 5th (79F). _77F ___ Oct 24 __________1900, 46 (77F) __ 2001 (79F) _ 2001 (79F) __ (1900,46,63 t-2nd (77F), 1973 5th (76F), 1940,72, 2017 t6th (74F)) _79F ___ Oct 25 ___ eventual record .. (2001 2nd (75F), 1875,1993,2010 t-3rd (74F), 1908,89 t-6th (73F), 1920,24,31,98,2000 t-8th (72F)). _78F ___ Oct 26 ___ eventual record later tied by 1964 .. (1989 3rd (77F), 1947 4th (76F), 1971,73 t5 (75F), 1924 7th (73F)) _82F ___ Oct 27 ___ eventual record .. (1947 2nd (78F), 1989 3rd (76F), 1899.1991,2010 t-4th (75F), 1920,29,64 t-7th (74F)) No record high minima were established, so none have survived. These eleven records (count 10.0) would have been set had 1963 been in the starter era. The extinction date is Mar 26, 1946. _39F ___ Jan 11 ____ broke 1895,98 (38F) __ broken by 1909 (39F). Eventual record 2020 (51F). _46F ___ Mar 25 ___ broke 1884 (40F) __ broken by 1910 (52F). Eventual record 1913 (61F). _50F ___ Mar 26 ___ broke 1886 (46F) __ broken by 1946 (51F). Eventual record 1986,2021 (52F). _49F ___ Mar 27 ___ broke 1869 (48F) __ broken by 1905 (51F). Eventual record 1949 (61F). _50F ___ Mar 28 ___ broke 1898 (47F) __ broken by 1905 (53F). Eventual record 1998 (63F). _44F ___ Mar 30 ___ broke sev'l (41F) __ broken by 1902 (48F). Eventual record 1998 (59F). _48F ___ Apr 2 ____ tied 1875,1910 (48F) _ broken by 1918 (49F). Eventual record 1967 (61F). _60F ___ Oct 25 ___ broke 1899 (59F) __ broken by 1908 (66F). _51F ___ Nov 17 ___ tied 1896 (51F) ____ broken by 1918 (53F). _53F ___ Nov 23 ___ broke 1883 (50F) __ broken by 1931 (58F). ______________________________________________ 1964 __ The cold regime from December ended after a snowstorm hit NYC just before mid-January, and the rest of the winter was fairly bland, then the spring of 1964 produced some warmer than average conditions at times. The summer was rather warm until late July and then August was unusually cool. The autumn was near average overall with variable temperatures. There were just four records set or tied (count 3.00), albeit three of them have survived (count 2.50) and this makes 1964 the best year so far at preserving records set (survival rate 83.3%). These four records broke previous marks by an average of 1.25 F deg (two were ties though). The only record broken from 1964 (June 10th) fell in 1974; if the other three fell later this year, the average extinction date of 1964 records would become 2009. The average amount surpassed statistic is that lone case, eventually 4 F deg, for an average of 1.0 F counting the three surviving records. There were a few other days in 1964 that were close to records, notably 99F on July 1st, and 71F on Nov 13th. It was 60F on each of Dec 25th, 26th and 27th. After the two very hot days (June 30, July 1 both 99F) the weather turned quite cool and two low maximum records were set with 63F on the 9th and 67F on the 13th. July 9th also set a daily rainfall record although it was probably the weakest of the summer season at just 1.09" after 1.05" the previous day -- not a very summery day in any case. August had several very cool spells but missed out on setting records (more success at Toronto). Early October also had some near misses. The count remained 2.00. It was 2.5 during the year but a tie with 1937 for 60F on Sep 13th was broken the next year by 59F in 1965. Four record minima were set in 1964. three in August -- 59F on 1st tied 1895, and 54F on 14th and 15th. Oct 11th hit 34F which was also a benchmark value. This made the count 3.50. Within the year the count was 4.83, a record set on September 16th (48F) was soon broken in 1966 (47F), and a third of another record (39F Oct 8 tied 1885, 1935) was replaced by 1988 (37F). Continuing a trend from earlier years in the decade, there were six occasions when 1964 had a share in lowest minimum after an earlier record, but the count was reduced to 3.5 by several ties. There were two record high minima, one was a share of May 24 (70F) with 1884 and 1902, and the other was 50F on Dec 26th. A minimum of 77F on July 1st was one degree short at the time and has since fallen two degrees behind the 2018 record of 79F. The count of surviving record high minima was 1.33 out of 3.33 set during the year. Temp ___ date ___ replaces _ ties ______ broken ___ eventual end of data record max, recent max _94F ___ May 23 __ eventual record .. (1992 2nd (92F), 1925,30,94 t-3rd (91F), 1941,80 5th (90F)). _92F ___ June 10 __________ 1959 (92F) _ 1974 (95F) _ 2008 (96F) _ (1974,84 t-2nd (95F), 1959,64,2000 t-4th (92F), 1906,67,73 t-7th (91F)). _99F ___ June 30 __ eventual record .. (1945 2nd (97F), 1901,31 t3rd (95F), 1906,66,68 t5th (94F), 1872,1959,1961,2018 t8th (93F)). _78F ___ Oct 26 ___ eventual record tied by 1963 .. (1989 3rd (77F), 1947 4th (76F), 1971,73 t5 (75F), 1924 7th (73F)) Record high minima (3.33), end of data 1.33 have survived _71F ___ May 9 ____ 1895 (69F) _________ 2000 (74F) __ 2000 (74F) __ also 1963,79 (67F) _70F ___ May 24 __ eventual record high minimum tied 1884, 1902 __ 1880, 1908, 1980 (68F) _49F ___ Dec 25 ___ 1932 (47F) __________ 1979 (50F) __ 2015 (57F) _50F ___ Dec 26 ___ eventual record high minimum __ broke 1895 (48F), 2015 (47F) __________________________________________________ 1965 __ This was a somewhat colder than average year but occasionally produced brief spells of warmth too. May and December were the only months to register much above average temperatures. July was unusually cool or at least temperate, with a mean maximum of 83F (normal is 86F). Only two days exceeded 90F in July, 1965. May 26 (94F) was only one degree short of breaking the 1880 record. The year ended with the warmest New Years Eve - New Years Day combination (your correspondent was actually there at the time, visiting relatives from home base in Ontario, Canada; I recall there being thunder and lightning and warm rain falling on both Christmas eve and New Years eve during that holiday). The year set four records, with one tie for a count of 3.50. It was about to become a rare case of a year after 1900 with no surviving records but the evening temperature (63F) on New Years Eve just edged out the previous value by one degree, and that record has survived (as has Jan 1st at 62F). This is a survival rate of 29.4%. These four records edged out previous ones by an average of just 1.5 F deg. The average year breaking three records from 1965 was 1999 and that would change to 2004 if the NYE record fell this year. The average by which three records have been surpassed by eventual records is 1.67F which reduces to 1.25F if the surviving record is included. There were two record low maxima, 62F on June 16th and 59F on Sep 13th (count 2.00). There were two record low minima, 50F on Aug 29th and 30th, losing 51F (tied 1912) on 31st to 1976 (also 50F). As the first of the pair was later tied in 1982 and 1986, the count is 1.33. Within the year it had been 2.5. There were another seven days that were coldest after earlier records with a count of 5.75 for that. This brought to 25 the total count of this statistic for 1961-65, with reduction for ties, it could be said then that about a month's worth of such values existed in this short interval. What this suggests is that the urban heat island was just enough to mask the actual parity of the early 1960s to previous cold spells (and with a total of about 13 eventual record lows, sometimes these broke through). The two readings of 50F are two of six tied monthly minima for August (besides the dates mentioned, 1885 has two also). Records were also missed by one or two degrees on June 16th and June 17th (both 53F with records from the 1920s of 51 and 52) and on Oct 29th when 32F was one above the 1925 record. The year matched two of its record highs with record high minima -- 48F on Feb 8th, and 52F on Dec 31st (count 2.00). A fifth tie for June 8th (70F) was broken in 1971 after going to six the following year (1966 70F). This survival rate of 90.9% is the highest so far for high minima, 1980 will slightly outpace it, and 1989 becomes the first year to achieve full retention of its record high minima, which then becomes more frequent and includes each year 2018 to 2022 (the last of which is automatic). Temp ___ date ___ replaces _ ties ______ broken ___ eventual end of data record max, recent max _61F ___ Feb 8 ____ 1933 (60F) _________ 2017 (62F) __ 2017 (62F) ___ (1965 2nd (61F), 1933 3rd (60F), 1932,1990,2009 t-4th (58F)). _90F ___ May 4 ___ 1963 (86F) __________ 2001 (92F) __ 2001 (92F) __ (1965 2nd (90F), 1963 3rd (86F), 1944, 2015 t-4th (85F), 2018 6th (84F), 1942,49 t-5th (83F)) _92F ___ May 10 ____________1896 (92F) _1979 (94F) __ 1979 (94F) __ (1970 2nd (93F), 1896,1965 t-3rd (92F), 1889 5th (91F), 1874,1987 t-6th (90F)). _63F ___ Dec 31 ___ eventual record .. (1932 2nd (62F), 1992 3rd (61F), 1895, 1936, 1990 t4th (60F), 1884, 1906 t-7th (59F)). Record high minima (2.2), end of data 2.0 have survived _48F ___ Feb 8 ___ eventual record high minimum __ 1991, 2005 (40F), broke 1892 (39F) _70F ___ June 8 ______ 1871,83,1922,46 (70F)* ___ 1971 (73F) __ 1984 (77F) __ also 1999 (76F), 2008 (74F), 2005 (73F) _51F ___ Dec 31 ___ eventual record high minimum __ broke 1884 (49F), 2011,2022 (48F) * this tie was extended to six by 1966 (70F). ______________________________________________________________ 1966 __ After a mild start, the winter became rather variable but some warmth returned at times. Parts of March and April were quite cold, then May remained cold throughout. A hot summer followed with many records set. The autumn turned more average although November saw a return to above normal temperatures that lasted to about mid-December. With ten records, and two of them ties, the count was 9.00. Of those ten, eight remain and two were ties during 1966, one has become a three-way tie as of 2002. That makes the count of surviving records 6.83, and the survival rate is therefore 75.9%. 1966 had the most records of any year after 1955 until 1990 and 1991 did slightly better (1988 came close also at 8.58). Also the number of surviving records is tied for tenth with 1895 with only these years ahead of it for final count -- 2001 (9.33), 1991 (8.5), 1953, 1990 (8.0), 1949 (7.58), 1931 (7.25), 1988 (7.08), 1998 (7.0). These ten records broke previous marks by an average of 2.3 F deg, and two were broken in 1973 and 1999 (average 1986) so that if all eight of the others were broken in the next seven months, that average would become 2014. The two records to fall were eventually surpassed by an average of 6.5 F deg which would be reduced to 1.3 F deg if the eight surviving records were included in the average. In addition, July 26 (97F) was only one degree below the already set 1940 record high. The average high in July was 90.3 deg F. There were no record low maximum values surviving from 1966. Also there were two record low minima set during the year, 36F on May 10th (tied 1947) and 47F on Sep 16th for a count of 1.50. As there were no other record lows set and later broken, that was also the count within the year, the lowest in the interval 1960 to 1969. The production of "coldest since records set" values was also down with the count being zero for that, Dec 4 (15F) was colder than the eventual value after the 1976 record and at the time was four degrees above the 1940 record (which became 6 deg after 1976 set the record at 9F). The year retains five record high minima, 52F on Jan 1st, 50F on Feb 11th and 45F on Feb 12th, and 54F on Dec 9th and 10th (the latter is shared with 1946). A tie with 1977 for Nov 10th (58F) was lost to 2020 (60F). That makes the present count 4.50, Temp ___ date ___ replaces _ ties ______ broken ___ eventual end of data record max, recent max _62F ___ Jan 1 ___ eventual record .. (1919 2nd (61F), 1973,79,2005 t-3rd (60F), 1885 6th (59F), 1876,2019 t-7th (58F), 1985 9th (57F)). _58F ___ Feb 12 ___ 1932 (56F) _________ 1999 (62F) __ 1999,2018 (62F) __ (1966 3rd (58F), 1984,2009 t-4th (57F), 1932 6th (56F), 1877,80,1940.98 t-7th (54F)). _101F __ June 27 __ eventual record .. (1943 2nd (98F), 1963,83 t3rd (95F), 1941 5th (94F)) [June monthly max tied by 29th 1934] _100F __ July 2 ____ eventual record tied by 1901 .. (1941 3rd (98F), 1872 4th (96F), 1961,2002,18 t-5th (95F), 1911,13,63 t-8th (94F)). _103F __ July 3 ____ eventual record .. (1898,1911 t-2nd (100F), 1949 4th (99F), 1919 5th (97F), 1955,2002 t-6th (95F), 1872,1901,34,83 t-8th (94F)). _ 99F __ July 12 __ eventual record .. (1908 2nd (96F), 1935 3rd (95F), 1981,83,93,2010 t-4th (94F), 1944,2011 t-8th (93F), 1876,1905,16,52,79 t-10th (92F)). _101F __ July 13 __ eventual record .. (1952,54,94 t-2nd (96F), 1979,93 5th (95F), 1916 6th (94F), 1876,94,1981,82,83 t7th (93F)). _ 94F ___Aug 19 __ eventual record tied by 1914 and later by 2002 .. (1872, 1978 t-4th (92F), 1947, 2010 t-6th (91F)). _64F ___ Nov 25 ___1946 (63F) ____________1973 (65F) __ 1979 (73F) __ (2014 2nd (68F), 2001 3rd (66F), 1973,90 t-4th (65F), 1966 6th (64F)). _66F ___ Dec 9 ____ eventual record .. (1991 2nd (64F), 1980 3rd (63F), 1946,53 t-4th (61F), 1889,1924,1987 t-6th (60F)). Record high minima (5.67), end of data 4.5 have survived _52F ___ Jan 1 ___ eventual record high minimum __ 1979, 2022 (50F), 1973,2007 (45F), broke 1876, 1952 (44F) _50F ___ Feb 11 ___ eventual record high minimum __ broke 1925 (47F), 2009,2018 (45F) _45F ___ Feb 12 ___ eventual record high minimum __ 1984, 1998, 2009 (44F), broke 1876 (42F) also 2022 (42F) _70F ___ June 8 ______ 1871,83,1922,46,65 (70F) __ 1971 (73F) __ 1984 (77F) __ also 1999 (76F), 2008 (74F), 2005 (73F) _76F ___ June 28 ___ not a record in 1966 (1876, 1943 _ 77F was eventual record) _77F ___ July 4 _____ not a record in 1966 (1876, 1908 _ 78F was record later tied 1974,83). Eventual record 2002 (81F) _78F ___ July 13 ___ not a record in 1966 (1876 _ 79F was eventual record) _77F ___ July 14 ___ not a record in 1966 (1952 _ 78F was eventual record) _58F ___ Nov 10 ___ 1898 (54F) __________ 2020 (60F) __ 2020 (60F) __ 1966 later tied by 1977 (58F) _54F ___ Dec 9 ___ eventual record high minimum __ broke 1889,1923 (48F), also 1938 (46F), 1991,2004,2012,2019 (42F) _54F ___ Dec 10 ___ eventual record high minimum tied 1946 __ 2015 (51F), 1907 (50F) __________________________________________________________________ 1967 __ There was a brief surge of very mild weather in late January as the "Chicago blizzard" low tracked north of the region. Most of February was quite cold, and March-April had variable temperatures with some brief warm spells. May was an unusually cold month. The summer started warm but most of July and August were cooler than average. September was quite dry at times and the autumn unremarkable in general, November turning rather cold. December 1967 then turned quite mild with 62F just below a record value. June 16 (96F) was one degree short of the 1891 record high. There were seven record highs set or tied for a count of 6.50, and of those three have survived to the present time, a survival rate of 46.1%. These seven broke existing records by an average of 3.4 F deg. The average year breaking four 1967 records was 1984, but if the three surviving records fell in 2024, then that would change to 2003. Four records were broken ultimately by an average of 2.75 F deg, which reduces to 1.6 F counting the survivors. There were four record low maximum readings, 20F on March 18th, 44F on May 7th and a benchmark 46F on May 24th. The average high in May 1967 was 63F compared to 71F for the thirty year interval ending in 1970. June 30th (after a generally warm month) had a low maximum of 65F. There were also three record low minimum temperatures that have survived to the present. 8F on March 19th was also a benchmark low, then 42F on May 26th with the previous day at the same value one above 1925's record, and 20F on Nov 15th (count 3.00). This was also the situation for record low minima during the year, but 1967 had the most "near misses" (coldest after records established) with a total of twelve days and a count of 9.58, tied with 1976 with eleven days involved). No longer worth drawing attention to 100% survival rates as these were becoming normal with so few established records later broken. There were three high minima that have survived, 54F on Jan 24th, 50F on March 11th (tied in 1977), 61F on April 2nd (count 2.50) with Dec 19th (44F) one degree below that day's record. The count during the year was 5.0 Temp ___ date ___ replaces _ ties ______ broken ___ eventual end of data record max, recent max _68F ___ Jan 24 ___ eventual record .. (1989 2nd (61F), 1999 3rd (60F), 2019 4th (59F), 1894 5th (57F), 1887,1947,90 t6th (56F)). _60F ___ Jan 25 ___ eventual record .. (2010 2nd (57F), 1938,47,90 t3rd (56F), 1916,34 t6th (55F)). _58F ___ Feb 2 ___ 1933 (55F) _________ 1988 (59F) __1988 (59F) ___ (1967,73 t2nd (58F), 1989 4th (57F), 1970,99,2014 t-5th (56F), 1933,83 t-8th (55F).) _64F ___ Mar 3 ___________ 1961 (64F) _ 1991 (65F) __2024 (68F) __ (1961,67 t-3rd (64F), 1871,1923,72 t-5th (63F), 2002 8th (61F), 2004,07,20 t-9th (59F)). _72F ___ Mar 11 __1955 (67F) _________ 1977 (73F) _ 1977 (73F) _ (1967 2nd (72F), 2021 3rd (71F), 2016 4th (68F), 1955.86,90 t-5th (67F)). _81F ___ Apr 2 ___ eventual record .. (1963 2nd (80F), 1918 3rd (78F), 1934 4th (77F), 1946 5th (75F)). 2006,10 (68F). _76F ___ Apr 3 ___ 1892,1945 (75F) ____ 1981 (81F) _ 1981 (81F) _ (2002 2nd (77F), 1967 3rd (76F), 1892, 1945 t4th (75F)). Record high minima (5.0), end of data 3.0 survived _45F ___ Jan 23 ___ not a record in 1967 (1906 _50F was eventual record) 1967 remains third highest, after 1933 (46F) second. _54F ___ Jan 24 ___ eventual record high minimum __ broke 1953 (49F), 2002 (45F) _43F ___ Jan 25 ___ 1896,1947 (41F) ____ 1990 (45F) __ 2010 (49F) _44F ___ Jan 26 ___ not a record in 1967 (1916 _49F was eventual record) 1967 remains second highest for date _50F ___ Mar 11 ___ eventual record high minimum later tied in 1977 __ broke 1925,55 (49F), 2016 (48F) _61F ___ Apr 2 _____ eventual record high minimum __ broke 1945 (54F), 1981,1986 (52F) _71F ___ June 11 ___ 1879,83,1925 (70F) __ 1973 (73F) __ 1984 (78F) __ also 2015,17 (72F) _44F ___ Dec 19 ___ not a record in 1967 (1949,57 _45F later tied by 2017 eventual record) ___________________________ 1968 __ There was bitter cold in early January but the winter trended towards more average conditions, and the spring turned quite warm until early May when cooler weather arrived. The summer of 1968 had occasional cool spells but averaged close to normal, then the autumn turned quite warm. The first three days of October were in the mid-80s but records are closer to 90F then. Three days near 80F mid-October also fell short. There were only two record highs set in 1968, and neither survived past 1990. They increased the previous records by an average of only 1.5 F deg and were surpassed by an average of 5.0 F deg. They were broken on average by 1984. 1968 is the first year in the study since 1926 to have no surviving records (1958 had no records to maintain). With a random expectation of 3.66, it had the fifth lowest ratio of actual to expected in the period 1901 to 1970 (55%, compared to 0% for 1958, 38% for 1960, 39% for 1909, and 49% for 1957; since 1968, only three years with no records and 1978, 1994 and 2003 have had a lower comparison with random expectation. The extinction date for 1968 records was Nov 29th, 1990. 1968 had three record low maxima, Jan 8th (13F), Jan 9th (14F) tied with 1970, and June 27th (61F) (count 2.50). The early January cold spell broke four minimum records, 2F on 8th, -1F on 9th, 3F on 11th and 2F on 12th (which tied 1886 and was later joined by 1981). The count was therefore 3.33 eventually from 3.5 at the time, and there were no further records of either low or high minima in 1968. There were three occasions with coldest since a record low minimum for a count of 2.5. There was only one record high minimum (47F on Dec 2) which was a tie with 1939, for a count of 0.5. That only lasted until 1970 (49F). Since then it has fallen five behind the eventual record of 52F from 1982. The closest that 1968 now comes to any eventual record high minimum is within 2F, on two occasions, 77F on July 1st (within 1F of existing record, now 2F short of the 2018 mark of 79F, and 69F on Sep 25th which was and remains 2F behind tied records of 71F from 1881 and 1970. The low of 65F on Oct 3rd was and remains 3F behind the record of 68F (1954, equalled in 1969). Except for three years that set no high minima, 1968 is the lowest producer of them within the year (0.5), beating 1920 and 1940 which had produced 1.0 each. There will be three more blanked years to come, and 1992 will equal the low production of 0.5, so eventually 1968 is tied seventh lowest producer of record high minima within the calendar year. Temp ___ date ___ replaces _ ties ______ broken ___ eventual end of data record max, recent max _82F ___ Apr 13 ___ 1945 (81F) _________1977 (88F) __ 2023 (90F) __ (1968, 2018 t-3rd (82F), 1945 5th (81F), 1890 6th (79F), 2006 7th (78F)) _67F ___ Nov 29 ___ 1870 (65F) ________ 1990 (69F) __ 1990 (69F) ___ (1968 2nd (67F), 1991,2011 t-3rd (66F), 1870 5th (65F), 1905,27 t-6th (64F)). Record high minima (0.5), end of data none survived, extinction date Dec 2, 1970 _77F ___ July 1 ___ not a record in 1968 ___ (record was 1901 _78F), eventual record 2018_79F _69F ___ Sep 25 ___ not a record in 1968 ___ (record was 1881_71F later tied 1970) _65F ___ Oct 3 ____ not a record in 1968 ___ (record was 1954 _68F later tied 1969) _47F ___ Dec 2 _____________ 1939 (47F) _ 1970 (49F) __ 1982 (52F) ________________________________________________________ 1969 __ The most dramatic weather event of 1969 had little effect on NYC (Hurricane Camille). There were no really persistent spells of any sort in this rather variable year, with just a few isolated warm spells and cold spells, and a lot of rather bland weather, possibly the result of widespread blocking in the hemispheric circulation. This promoted an active winter storm pattern especially in February and March. 1969 is the first year of which it can be said that all its records have never been broken, although one was later tied and another tied an existing record. That means the count for the year is 2.50 but the count of surviving records is 2.00, a survival rate of 80% (since one was reduced to a tie and another entered the list as a half-share). 1964 had achieved 83.3% (2.5 of 3 have survived but a tied record has been broken). These three 1969 values broke records by an average of 2.0 F deg. This is the first year (other than 1958 with no data to average) for which there is no average year breaking the records, the extinction dates would be May 29th, June 28th and Oct 20th of this coming year. Also the average amount by which these records have ultimately been surpassed is obviously zero. There is a very small count for record low maxima, 0.20 (a share of 70F on July 23rd). There were two record low minima in 1969, Oct 23rd (32F) and 24th (31F) for a count of 2.00. The previous day (Oct 22, 35F) provided the one occasion when 1969 was coldest after an established record (1940, 30F). The May 29 maximum record came with a record high minimum of 74F for one of May's overall hottest days. Another half-share came on Oct 3rd (68F tied 1954). (count 1.50) The count within 1969 was 2.5, the lost count of 1.0 records being two ties in April of earlier records, that ran into the 1976 and 2002 heat waves and fell during those. Temp ___ date ___ replaces _ ties ______ broken ___ eventual end of data record max, recent max _97F ___ May 29 ___ eventual record .. (1987 2nd (96F), 1931 3rd (93F), 1919 4th (92F), 1935,91,2012,18 t-5th (89F)). _96F ___ June 28 ___ eventual record later tied by 1991 .. (1870,80,1963 t-3rd (94F), 1901,66,2010 t-6th (93F), 1943,76,93 t-9th (92F)). _80F ___ Oct 20 ___ eventual record tied by 1947 .. (1965 3rd (79F), 1938,53 t-4th (78F), 1916,36,39 t-5th (77F), 1979,84 t-8th (76F)). Record high minima (2.5), end of data none 1.5 survived _60F ___ Apr 17 _________ 1959 (60F) __ 1976 (66F) __ 2002 (74F) __ also 2012 (61F) _58F ___ Apr 18 _________ 1869 (58F) __ 1973 (61F) __ 2002 (76F) __ also 1976 (70F), 2015 (59F) _74F ___ May 29 ___ eventual record high minimum __ broke 1939 (72F), 1987 (71F), 2016 (70F) _67F ___ Oct 3 ____ eventual record high minimum tied 1954 __ 1927 (66F), 2007 (65F) __________________________________________________ 1970 __ The weather was often rather cold from January to mid-April and then quite warm from then to October. A more average trend developed in the last two months of the year. Before two records set in late September (25th-26th), two other days were in range, 22nd (94F) and 23rd (93F) but these fell to 95F (1895, 1914) and 97F (1895). The next day at only 87F was also just two degrees short of the then existing record (89F 1959). The following two days did secure records (90F and 91F). The count for six days with records was 5.00, and of those, 2.50 have survived for a rate of 50%. These 1970 records broke existing marks by an average of 1.8 F deg, and three were broken on average by 1987. If the other three fall later this year, that would change the 1970 "extinction" average to a final value of 2004. The average by which three 1970 records have been surpassed eventually is 4.7 F deg, which reduces to 2.3 F if the three surviving records are included. The low maximum count is 1.50 from one tie (Jan 9th with 1968) and 47F on Oct 17th. 1970 has no surviving low minimum records and in fact set no records during the year either, the closest reading to an existing record then (which is still the case now) was within 1 degree (May 7th, 38F vs record of 37F from 1891), then a 2 deg difference (9F vs 7F in 1928, later tied in 1990, on Feb 27th) followed by three degrees for Jan 8th (5F vs 2F in 1968), also 57F June 28th and 36F Oct 17th (record 33F in 1886) as well as 37F on Oct 18th. The first, third and fifth of these occasions were three of seven times 1970 had the coldest value since a record was set (ties reduced that to a count of 4.75). (the other two occasions do not count since a record was tied later than 1970 and the statistic is only measured after all ties have happened). 1970 became the fourth year with no record lows during the year (1908, 1948, 1958 preceded it). The count of 2.50 high minimum records comes from the late September warm spell, those being 77F (Sep 23rd), 74F (Sep 24th) and 71F (Sep 25th tied with 1881). Values of 72F at either end of that spell both fell to 1895. Lows of 49F on Dec 2nd and 3rd did not survive as records with warmer spells that came in 1982 and 1998. There had been 7.5 record high minima set during 1970 so the eventual survival rate is only 33.3%. Temp ___ date ___ replaces _ ties ______ broken ___ eventual end of data record max, recent max _56F ____ Feb 3 __ 1875 (52F) _________ 1983 (59F) __ 1991 (64F) __ (2006 2nd (62F), 1983, 2018 t-3rd (59F), 2020 5th (57F), 1970 6th (56F)). _93F ____ May 10 _1896,1965 (92F) ___ 1979 (94F) __ 1979 (94F) __ (1970 2nd (93F), 1896,1965 t-3rd (92F), 1889 5th (91F), 1874,1987 t-6th (90F)). _90F ___ Sep 25 ___ eventual record .. (1881, 1926, 2010 t-2nd (89F), 2017 5th (88F), 1930,1968 t-6th (87F), 1911,20,33,84 t-8th (86F)). _91F ___ Sep 26 ___ eventual record tied by 1881 .. (1895 3rd (90F), 1958 4th (89F), 1891,2007 t-5th (87F), 1930,1972 t-7th (86F)). _66F ___ Dec 2 ____ eventual record .. (1998 2nd (64F), 1912 3rd (61F), 1878,1932,68,80 t-4th (60F), 1895 8th (59F), 1914,42,51 t-9th (58F)). _64F ___ Dec 3 ___________ 1914 (64F) _ 1998 (69F) __ 1998 (69F) __ (2009 2nd (66F), 1914,70 t-3rd (64F), 1994 5th (63F), 1932,93 t-6th (62F)). Record high minima (7.5), end of data 2.5 survived. _42F ___ Jan 29 ___ 1950 (40F) __________ 2002 (50F) __ 2002 (50F) __ also 2006 (44F), 1974 (40F) _41F ___ Feb 2 ___ not a record in 1970 (42F _ 1952 was record) 1970 remains second highest (1922,33,99 all 40F) _69F ___ May 11 ___ 1895 (67F) _________ 2015 (70F) __ 2015 (70F) __ also 1985 (67F) _77F ___ Sep 23 ___ eventual record high minimum __ broke 1895 (76F), 2019 (70F) _74F ___ Sep 24 ___ eventual record high minimum __ broke 1891 (70F), 2011 (70F) _71F ___ Sep 25 ___ eventual record high minimum tied 1881 __ 1945,1961,2011,17,25 (70F) _72F ___ Sep 26 ___ not a record in 1970 (74F _ 1895 was record) remains tied with 1891 (72F) second highest _57F ___ Nov 11 ___ 1935 (56F) __________2020 (64F) __ 2020 (64F) __ also 1984 (55F) _49F ___ Dec 2 ____ 1939,68 (47F) _______ 1982 (52F) __ 1982 (52F) __ also 1899, 2001, 2015 (46F) _49F ___ Dec 3 ____ 1932,41 (48F) _______ 1982 (51F) __ 1998 (53F) __ also 2009, 2012 (49F) ___________________________________ decade of 1971-80 __________________________________ This decade saw a gradual decline in winter temperatures towards the years 1976 to 1979 although 1980 had a milder average. There were some notably warm springs, especially parts of 1975 to 1977 (although in each case confined to one or two of the three months), and summers compared near the long-term average. Unlike the previous three decades, autumn temperatures were often closer to average with just 1971 and November 1975 being notably warm, and a few Octobers in this decade were colder than most in the previous seven decades. Overall, the record production was similar to the previous decade with a total of 1970s. There was a total of 49.0 new records compared to 34 as the random expectation. Of those, 28.5 have survived so the overall survival rate increased a bit from earlier decades to reach 58%. Records were set or tied by this decade on 52 dates, with twelve being only ties of previous records, so the count was 45.50 (the shortfall of 3.5 is caused by cases where a record either fell twice (three) or was tied and then surpassed (one) the decade). That raises the survival rate defined as any record in the decade surviving on a given date to about 65%. Every year produced at least one record but 1978 waited until December to establish its one (temporary) record. With about 20 of the eventual record low minima, this decade kept up a similar pace to the 1960s ahead of the 1950s in this regard. 1971 __ Again, like the previous year, rather cold from January to April, then fairly warm especially into the autumn with October joining 1947 and 1963 near the top of the temperature rankings. This trend continued into December which was quite mild. Dec 11th (63F) was one degree short of tying the 1879 record. Otherwise, with just three records set and one a three-way tie, the count for 1971 is 2.33 (random expectation of 3.54) and becomes the first year to see a survival rate of 85.8% with two late records surviving. These three 1971 records broke previous marks by an average of 2.7 F deg. The one record broken fell in 1983, the average would become 2008 if the two surviving records fell later this year. The one record broken has been surpassed by 14 degrees which falls to 4.7 F counting the two surviving records. There are two surviving low maximum records, 12F on Feb 1st, and 60F on June 15th (tied 1916). The count is 1.50. After a record low of 28F on Nov 9th fell in 1976 (24F), there were no surviving low minimum records. This makes 1971 the last year of a total of twelve to see a count higher than zero reduced to zero. (four others had zero counts within the year) ... A reading of 7F on Jan 20th was two degrees above the 1946 record at that time (and tied the pre-existing 1940 record low for the date), but fell further behind with new low records of 4F in 1985 and eventually 0F in 1994. The record set in 1976 means that Aug 24th (55F) and Nov 8th (29F) where 1971 had a value three degrees above the record low are now tied as the closest that the year comes to any eventual record low. There were no occasions where 1971 had the coldest reading after an eventual record was established. Three high minimum records were set at similar times to the high maxima, 64F on Oct 28th, 67F on Nov 2nd (a monthly maximum and benchmark), and 48F on Dec 16th (the count fell from 3.0 to 2.0 when this was broken in 2021). Readings of 47F and 48F on Dec 10th-11th were a few degrees short of earlier set records but there was a very mild interval from Dec 7th to 17th where the lowest reading was 33F. The count at the end of 1971 was 5.0 so the survival rate is now just 40%. Temp ___ date ___ replaces _ ties ______ broken ___ eventual end of data record max, recent max _63F ___ Mar 15 ________ 1913,45 (63F) _ 1983 (68F) _ 1990 (77F) _78F ___ Oct 29 ___ eventual record .. (1946 2nd (77F), 1989 3rd (76F), 1984 4th (74F), 2015 5th (73F), 1947,61,2014 t6 (72F)). _67F ___ Dec 16 ___ eventual record .. (1891 2nd (60F), 1893,2011 t-3rd (59F), 1877,1982,2008 t-5th (58F), 1959 8th (56F)). Record high minima (5.0), end of data 2.0 survived _44F __ Feb 27 ___ 1902,53 (42F) ______ 1976 (49F) __ 1976 (49F) ___ 1997 (47F), 1955 (41F) _46F __ Feb 28 ___ not a record in 1971 (47F _ 1903,10 was record). Later record tied by 2017 (47F) _73F __ June 8 ____ sev'l incl 1966 (70F) _ 1984 (77F) __ 1984 (77F) __ also 1999 (76F) _64F __ Oct 28 ___ eventual record high minimum __ 1984 (62F), broke 1947 (61F) _67F __ Nov 2 ____ eventual record high minimum [Nov max] __ broke 1929 (64F), 2018 (64F) _48F __ Dec 16 ___ 1928 (45F) __________ 2021 (54F) __ 2021 (54F) __ also 2015 (46F) _________________________________________________________________________ 1972 _ In the region, the most notable weather event was Hurricane Agnes which brought flooding rainfalls to parts of PA, NJ and NY states (NYC had about seven inches of rain between the 16th and 25th of June). There were few periods of sustained warmth in 1972 and late March into April, June and October-November were quite cold (despite one warm day in April as noted). The year set five record highs and three have survived for a survival rate of 60.0%. The amount by which 1972 records broke earlier marks averaged 4.8 F deg. Two records were eventually surpassed by an average of 3.5 F deg which falls off to 1.4 F if the three surviving records are counted. Those two were broken in 1976 and 1991 (average 1984) which shifts to 2006 if the three surviving records fall at the next opportunity. There was also one surviving record low maximum, 43F on Oct 19th. A high of 66F on June 25 (after Agnes) was beaten in 1974 (63F), and a tie with 1873 on May 9th (49F) was broken in 1977 (44F) so 1972 briefly had 2.5 record highs (has been at 1.0 since May 9, 1977). There were two record low minima, 49F on June 10th (tied 1881) and 46F on June 11th. A record low of 26F on Apr 8th was broken in 1982 (25F). A reading of 56F on July 6th was later surpassed by 54F in 1979 and 32F on Oct 20th fell to 31F in 1974. (count 4.50 within the year was thus reduced to 1.50). This was the last year in the data set to lose two or more record low minima to later records and was the first to lose three since 1950. The survival rate of 33.3% was the lowest for any year with any records to preserve since 1959 and from 1972 to the end of the data set (so therefore the lowest of non-zero-record years 1960 to present). ... The year managed two tied record high minima, 50F March 2nd (tied by 1991) and 72F on Sep 18th (tied 1905). (count 1.00). That is the residue of 3.0 record high minima as listed below. Temp ___ date ___ replaces _ ties ______ broken ___ eventual end of data record max, recent max _73F ___ Mar 1 ___ eventual record .. (2017 2nd (70F), 1902, 2004 t-3rd (63F), 1944,45,89,2018 t-5th (60F), 1871,1976 t-9th (59F)). _72F ___ Mar 2 ___ eventual record .. (1991 2nd (71F), 2004 3rd (67F), 1882,1973,2017 t-4th (64F) 1985,97 t-7th (61F), 1883 8th (60F)). _86F __ Apr 19 ___ 1914 (82F) _________ 1976 (92F) _ 1976 (92F) _ (2002 2nd (89F), 1985 3rd (88F), 1972 4th (86F), 2004 5th (85F), 1994 6th (84F), 1914 7th (82F)). _94F ___ Aug 24 ___ eventual record .. (1898,1947 t-2nd (93F), 1969 4th (92F), 1895,1905,19,53,64,74,80,95 t-5th (91F)). _92F ___ Sep 17 ___ 1915,41 (91F) _____ 1991 (93F) _ 1991 (93F) __ (1972 2nd (92F), 1915,41 t3rd (91F), 1942 5th (90F)). Record high minima (3.0), end of data 1.0 survived _45F ___ Jan 10 ___ not a record in 1972 (1935 _47F record), 1972 remains second highest for date _44F ___ Jan 11 ___ 1933,56 (41F) ______ 1975 (48F) __ 2020 (51F) _44F ___ Feb 29 ___ not a record in 1972 (1896, 2016 tied 47F record), fourth highest for date (1880_46F third) _50F ___ Mar 2 ___ eventual record high minimum later tied in 1991 __ broke 1882 (48F), also 1998 (45F) _79F ___ July 23 ___ not a record in 1972 (1906_80F was record, eventual record 2011 (83F) after 1978 (81F) _78F ___ July 24 ____________ 1870 (78F) _ 1999 (79F) __ 2010 (80F) __ also 2011 (78F), 1885,1908,10 (77F) _72F ___ Sep 18 ___ eventual record high minimum tied 1905 __ 1898, 1991 (71F) ________________________________________________________________________________ 1973 __ This was a warmer year with a notable late summer heat wave similar to 1953 although unable to break most of its daily records. There were eleven record highs, but six were ties of earlier values, for a count of 8.00. Of those, five have survived -- three were ties when joined by 1973, two of those have since gathered in a third tied year and another has only been tied more recently. That makes the count of surviving records 2.67 giving a survival rate of 33.3%. The average 1973 record's increase over previous marks was 1.7 F. The six that have fallen were overtaken on average by 1987, which would move to 2004 if the five surviving records fell later this year or early next year. The average surplus of eventual record highs to 1973 values was 4.0 F, which falls to 2.2 F if the surviving records are averaged in. There were no record low maximum readings. One record low minimum has survived (41F on May 18th). This was also the count (1.0) during the year. A reading of 58F on July 12th was one degree above the 1926 record. 30F on Nov 11th was two degrees above the existing record but is now six degrees warmer (24F in 2017). Two record high minima survive, 78F on Aug 30th (tied 2018) and 56F on Dec 5 (tied 1982). That gives a count of 1.00. The count during the year was 7.0, and 1973 has the worst survival rate (14.3%) for high minima for any years after 1968 except for 1974 and 2007 which both lost all their records, and also three years (1994, 2003, 2004) without any records set at all. Temp ___ date ___ replaces _ ties ______ broken ___ eventual end of data record max, recent max _60F ___ Jan 17 ____________ 1913 (60F) _ 1990 (63F) _ 1990 (63F) __ (1913,73 t-2nd (60F), 1889 4th (57F), 1870,1933 t-5th (56F), 1885,1924 t-7th (55F)). _66F ___ Jan 18 ___ eventual record later tied by 1990 .. (1986 3rd (63F), 1913, 2006 t-4th (58F), 1876,1932 t-6th (56F), 1915,37,51,99 t-8 (55F)). _58F ___ Feb 2 ____________ 1967 (58F) __ 1988 (59F) __1988 (59F) ___ (1967,73 t2nd (58F), 1989 4th (57F), 1970,99,2014 t-5th (56F), 1933,83 t-8th (55F).) _86F ___ Apr 22 __ eventual record tied by 1962, later by 2001 .. (1977,85 t-4th (85F), 1902 6th (84F), 1926,2004 t-7th (82F)). _95F ___ June 11 __ eventual record .. (1920,84 t-2nd (94F), 2000 4th (92F), 1970 5th (91F), 1893,1894,1967,76,91,2017 t-6th (90F)). _93F ___ June 12 __ eventual record tied 1933 and later by 2017 .. (1967 4th (92F), 1914,83 t-5th (91F), 1938,47,49,88 7th (90F)). _98F ___ Aug 28 ___ not a record in 1973 (1948 _100F was record) _98F ___ Aug 30 ___ eventual record tied by 1953 .. (1921 3rd (95F), 1991 4th (94F), 1945 5th (93F), 1928, 1966, 2010 t-6th (92F)). _94F, 95F, 94F, 96F, 93F not records for Aug 31-Sep 4 and 95F for Aug 29, still a very impressive heat wave Aug 28-Sep 4 _71F ___ Nov 14 ___ 1955 (68F) __________ 1993 (72F) __1993 (72F) __(1973,80 t2nd (71F), 1989 4th (70F), 2011 5th (69F), 1955 6th (68F), 1951,59,78 (67F)) _77F ___ Nov 15 ___ 1879 (73F) __________ 1993 (80F) __ 1993 (80F) __ (1973 2nd (77F), 1879 3rd (73F), 1956 4th (70F), 1902,89,94 t-5th (69F), 1951 8th (68F)) _65F ___ Nov 25 ___ 1946 (63F) ___________1979 (73F) __ 1979 (73F) __ (2014 2nd (68F), 2001 3rd (66F), 1973,90 t-4th (65F), 1966 6th (64F)). _66F ___ Dec 4 _______________ 1873 (66F) _1978 (67F) __ 1998 (74F) _ (1982 2nd (72F), 1978 3rd (67F), 1873,1973 t-4th (66F), 1994 6th (65F), 2001 7th (64F), 1941,2012 t-8th (62F)) Record high minima (7.0), end of data 1.0 survived _44F ___ Jan 19 ___ 1942 (43F) __________ 1986 (45F) __ 1986 (45F) __ also 1876,1880,1933,2010 (40F) _61F ___ Apr 18 ___ 1896,1969 (58F) ___ 1976 (70F) __ 2002 (76F) _62F ___ Apr 19 _____________ 1896 (62F) _ 1976 (68F) __ 1976 (68F) __ 2002 (63F) _74F ___ June 11 __ 1967 (71F) __________ 1984 (78F) __ 1984 (78F) __ 2015,17 (72F) _72F ___ June 12 ____________ 1942 (72F) _ 2015 (73F) __ 2017 (76F) __ 1942,73 later tied by 1997 (72F) _75F ___ Aug 27 ___ not a record in 1973 (1948 _79F was eventual record) _77F ___ Aug 28 ___ not a record in 1973 (1948 _78F was record, eventual record 2018 _79F _76F ___ Aug 29 ___ not a record in 1973 (1948 _78F was record, eventual record 2018 _81F _78F ___ Aug 30 ___ eventual record high minimum later tied by 2018 __ broke 1953, 60 (76F) _ 74F, 72F, 74F, 75F, 74F, 75F, 72F from Aug 31 to Sep 6 also not records (within 3-4) _51F ___ Nov 28 ___ 1911,35,37 (50F) ___ 1990 (55F) __ 2011 (56F) _56F ___ Dec 5 ___ eventual record high minimum later tied by 1982 __ also 2001 (55F), broke 1916,51 (53F) __________________________________________________________________________________ 1974 __ The most recalled weather event of 1974 was the destructive tornado outbreak in Ohio, Indiana, Kentucky and Tennessee into Alabama (latter less severe stages spreading closer to NYC but no damaging effects, and it was very warm at 75F but the record had been set in 1892 at 80F). The year had a subdued warm tendency interrupted by a cold October, and was able to set four records (just above the random expectation of 3.3) of which three have survived (75% survival rate). Jan 27th hit 66F but 1916 had already reached 69F on that date, and November 1st was quite warm (81F) but fell three degrees short of the 1950 record. The 1974 records increased previous values by an average of 3.5 F deg. The one 1974 record broken fell in 2008 (after being tied in 1984), so the average if the other three fall in the next year would be 2018. There was one low maximum record of 63F (June 25th) during a very cool four day interval June 25-28 (63F, 65F, 64F, 62F) where the next three days all missed record values by 2-3 deg. Oct 20th (44F) added another for a count of 2.00. April 10th had a one-third share of the minimum record (28F) as did June 26th (56F), then Oct 3rd (38F) and Oct 18th (35F) added two more one-third shares, followed by a full share of Oct 20th (31F) for five records with a count of 2.33. There were no other record lows but as some of the ties involved were later in the data set, the count at the time was 3.17, for a survival rate of 74%. There were also six occasions where 1974 had the coldest reading after a record, for a count of 4.50. There were no surviving high minimum records set in 1974. The closest values were 49F on March 5th (broken by 50F in 1979) and 44F on Jan 28th, the record until 46F (2002 tied 2018). The minimum of 60F on Oct 31st also remains two degrees below the already set value (62F in 1881, 1961). During the year, there were 3.58 records set with several ties involved. The extinction date was March 7th, 2009. Temp ___ date ___ replaces _ ties ______ broken ___ eventual end of data record max, recent max _70F ___ Mar 4 ___ eventual record .. (1880,1946 t-2nd (69F), 1874 4th (64F), 2008 5th (63F), 1918,37,65 t-6th (61F)). _89F ___ Apr 29 __ eventual record .. (2024 2nd (87F), 2017 3rd (85F), 1951 4th (84F), 1888 5th (83F), 1903 6th (82F), 1938 7th (81F)). _92F ___ May 17 __ eventual record .. (1977,2017 t-2nd (90F), 1896 4th (87F), 1880 5th (86F), 1877,1943.69,86 t-6th (84F), 1906,65,91,2015 t-10th (83F)). _95F ___ June 10 __ 1959,64 (92F) __________ 2008 (96F) _ 2008 (96F) __ (1974,84 t-2nd (95F), 1959,64,2000 t-4th (92F), 1906,67,73 t-7th (91F)). _81F ___ Nov 1 ___ not a record in 1974 (1950_84F was record) Record high minima (3.58), end of data none survived, extinction date Mar 7, 2009 _40F ___ Jan 16 _______ 1899,1913,1932 (40F)__ 1995 (53F) __ 1995 (53F) __ also 2016 (42F) _44F ___ Jan 28 ____ 1947 (42F) ____________ 2002,18 (46F) _ 2002,18 (46F) __ also 1879 (41F) _49F ___ Mar 5 ____ 1880, 1919 (48F) ______1979 (50F) __ 1979 (50F) __ also 1977 (48F), 2004 (44F) _48F ___ Mar 7 ____ 1876, 1951 (42F) ______2009 (51F) __ 2009 (51F) __ also 1987 (45F) _63F ___ May 16 ___ not a record in 1974 (1879, later 1991 _64F eventual records) _78F ___ July 4 __________ 1876, 1908 (78F) _ 1999 (79F) __ 2002 (81F) __ 1876,1908,1974 later tied by 1983 (78F) _60F ___ Oct 31 ___ not a record in 1974 (1881, 1961 _62F eventual records) _ ___________________________________________________________________________________ 1975 _ After a mild winter the spring began quite cold, turning hot in May, and the summer was relatively warm although not far from average. The autumn also started cool and turned very warm in November with a string of records set. There were seven daily records set for a count of 6.33, and four have survived, one (Nov 9) being tied in 2020 for a count of 3.50 and a survival rate of 55.3%. These 1975 records broke previous marks by an average of 2.0 F deg. The average year to break three records was 2009, which would make the extinction date 2016 if the remaining four fell later this year. The three records from 1975 since broken have been surpassed by an average of 7.0 F deg, which reduces to 3.0 F if the four surviving records are counted. There was one low maximum record that survived from 1975, 64F on Aug 7th. (count 1.00). 1975 has a half share of the low minimum record on Sep 14th (46F) with 1911 (count 0.50) and otherwise came within 2 deg of existing records on March 9th (16F) and Aug 7th (60F). These have both since been further separated by later records (1996, and 1994) to 5 and 3 degrees. The last two days of October, before a record warm November, had two readings that were 2 deg above record low values (and this is still the case) -- 33F on Oct 30th and 31F on Oct 31st. ... ... Sept 15th (47F) was, and remains, separated by 3 F from the existing record of 44F in 1873 and the same is true for Oct 3rd (41F, record last tied in 1974 38F). There were also some quite cold days in late March and early April as arctic air poured in from snow-covered Ontario and upstate New York. There were two surviving high minima, a tied 78F on Aug 3rd (with 2006), and 63F on Nov 8th (count 1.50). A value of 61F on Nov 4th (then tied with 1961) was broken by one degree in 1982. The count during 1975 was 5.0, so only 30% of the original set have survived. Temp ___ date ___ replaces _ ties ______ broken ___ eventual end of data record max, recent max _63F __ Jan 11 ___ 1933 (59F) __________ 2020 (69F) __ 2020 (69F) __ (1975 2nd (63F), 1933,80 t-3rd (59F), 1983,2014 t-5th (58F), 1924 7th (57F)). _55F __ Jan 29 ____ 1887, 1950 (53F) ___ 2002 (69F) __ 2002 (69F) __ (1975 2nd (55F), 1887,1950,2006 t3rd (53F), 1876,1924,89 t6 (52F)). _93F ___ May 24 __ eventual record .. (1936 2nd (92F), 1964 3rd (91F), 1955,1995 t-4th (87F), 1880,84,1904,12,72,80,81 t-6th (86F)). _96F ___ Aug 3 _______ 1926,1936 (96F)__2005 (97F) _ 2005 (97F) __ 1926,36,75,2006 t2nd (96F)), 1957 6th (95F)). _78F ___ Nov 4 ___ eventual record .. (1961,87 t-2nd (77F), 1914,74,94 t-4th (76F), 1990 7th (73F)). _76F ___ Nov 8 ___ eventual record .. (2020 2nd (75F), 1945 3rd (72F), 1938 4th (71F), 1949,94 5th (70F), 1890 6th (69F)). _75F ___ Nov 9 ___ eventual record later tied by 2020 .. (1986 3rd (73F), 1895,1945,1950 t4th (72F), 1916 7th (71F)) Record high minima (5.0), end of data 1.5 survived _48F ___ Jan 11 ___ 1972 (44F) __________ 2020 (51F) __ 2020 (51F) _42F ___ Jan 12 ____________ 1870 (42F) __ 2006 (45F) __ 2017 (47F) __ also 1908 (41F) _78F ___ Aug 3 ___ eventual record high minimum later tied by 2006 __ broke 1926 (77F), also 1995 (77F) _66F ___ Oct 15 ___ 1960 (65F) __________ 2014 (69F) __ 2014 (69F) __ also 1985, 2017 (65F) _61F ___ Nov 4 ____________ 1961 (61F) __ 1982 (62F) __ 1982 (62F) __ also 1948 (59F), 1994 (58F) _63F ___ Nov 8 ___ eventual record high minimum __ 1996 (62F), broke 1895 (60F) _60F ___ Nov 9 ___ not a record in 1975 (1895 _64F was eventual record) 1975 third warmest (1945 _62F) _57F ___ Nov 10 __ not a record in 1975 (1966 _58F was record, later tied 1977, 2020 _60F eventual record) ______________________________________________________________________________________ 1976 __ Temperatures went on quite a wild ride in 1976. January was cold and February very mild. April resumed the very warm trend, but May turned cool and the summer was generally rather cool to average. October and November were quite cold, with little change in that trend for December (or Jan 1977). The Feb and Apr warm spells set five records of which three survive, for a survival rate of 60%, and the five records broke previous values by an average of 5.6 F deg. The two records broken fell in 2002 and 2022, average March 2012. If the other three were to be broken in 2022-23, then the average would change to 2018. The two lost records were surpassed by five and one degrees, making the average 3.0 F for them, and 1.2 F deg for all five. Among these records was the first of two April readings of 96F (the other one happened in 2002 when the 1976 record for same date fell). There was one low maximum record, 23F on Dec 3rd after November saw several close calls. May 19th (38F) established a benchmark record low minimum, and 50F on Aug 31st tied several other nights for coldest August minimum (not a benchmark as those other occasions were in the four previous days, in 1885, 1982, and 1986). Oct 29 had 29F and Nov 9th 24F (while not a benchmark, given the size of the urban heat island quite a significant temperature, 23F on Nov 5th 1879 was within a much smaller heat island at that point in time). Dec 3rd (9F) and 14th (12F) also set records for a total of 6 (count 6.00). This was also the count at the time, no records having been tied or broken since 1976. In addition, 1976 ranks tied first for coldest readings since records were set, with eleven and a count of 9.583 (tied with 1967 which had the same count from twelve occasions). One of these is the -1F reading on Jan 23rd (coldest since -3F 1936). There were four record high minima, 49F on Feb 26th and 27th, and 68F, 67F on April 18th and 19th. The two previous days (66F and 70F) were records until broken later by 2002 (74F, 76F). The count is now 4.00 and had been 6.5 after the year, the other half record lost being another February value (16th, 43F tied 1954) that was eventually part of a four-way tie by 1984 and then broken in 2002 (44F). Temp ___ date ___ replaces _ ties ______ broken ___ eventual end of data record max, recent max _67F ___ Feb 17 ___ 1891 (59F) ________ 2022 (68F) __ 2022 (68F) .. .. .. .. .. .. .. .. .. .. .. .... (2011 3rd (63F), 1981 4th (62F), 1891 5th (59F), 1990,2006 t-6th (58F), 1921 8th (57F), 1946,48 t-9th (55F)). _67F ___ Feb 28 ___ eventual record .. (1903,97 t-2nd (62F), 1955,2018 t-4th (61F), 1996,2011,16 t-6th (60F), 1913,54 t-9 (59F)). _91F ___ Apr 17 ___ 1896 (88F) ________ 2002 (96F) _ 2002 (96F) _ (1976 2nd (91F), 1896 3rd (88F), 1959 4th (80F), 2004 5th (78F), 2005 6th (77F)). _96F ___ Apr 18 ___ eventual record .. (2002 2nd (91F), 1896 3rd (90F), 1964 4th (86F), 2008 5th (84F), 2016 6th (82F)). [Apr monthly max later tied by 2002] _92F ___ Apr 19 ___ eventual record .. (2002 2nd (89F), 1985 3rd (88F), 1972 4th (86F), 2004 5th (85F), 1994 6th (84F), 1914 7th (82F), 1886,1915 t-8th (81F)). Record high minima (6.5), end of data 4.0 survived _43F ___ Feb 16 _____________ 1954 (43F) __ 2002 (44F) __ 2023 (56F) __ 1954,76 later tied by 1982, 1984 _49F ___ Feb 26 ___ eventual record high minimum __ broke 1957 (48F), also 1951 (46F), 1996 (44F) _49F ___ Feb 27 ___ eventual record high minimum __ 1997 (47F), broke 1971 (44F) _66F ___ Apr 17 ___ 1959,69 (60F) ________ 2002 (74F) __ 2002 (74F) __ also 2012 (61F) _70F ___ Apr 18 ___ 1973 (61F) ____________ 2002 (76F) __ 2002 (76F) __ also 2016 (59F) _68F ___ Apr 19 ___ eventual record high minimum __ 1985 (65F), 2002 (63F), broke 1896,1973 (62F) _67F ___ Apr 20 ___ eventual record high minimum __ 2005 (64F), broke 1896 (63F) ________________________________________________________________________________________________ 1977 __ January was a very cold month but February warmed quickly leading to a generally very warm spring and summer with a spell of extreme heat in mid-July. The autumn was somewhat cooler than average. There were nine record highs set, three being ties of previous values for a count of 7.50. Of those, four have survived (count 4.00) for a survival rate of 53.3%. The 1977 records broke previous values by an average of 2.5 F deg, and the average year to break four records from 1977 is 1997. If the other four fell in the next year, that would change to 2009. The five broken records have been surpassed by an average of 4.4 deg F, which reduces to 2.4 deg F if the surviving records are counted. January set three low maximum records, 12F 17th, and 13F 18th and 29th. May 9th had a record low maximum of 44F (benchmark also) with snow observed in nearby areas including a trace at NYC. That cold outbreak was a brief affair between two long spells of very warm weather. That made four low maximum records (count 4.00). January set one low minimum record (-2F Jan 17th) and missed two others by one or two degrees (Jan 29th was 1F, record 0F in 1873). Another record came on April 9th with 25F (count 2.00). No other records were set and later broken, so the count was 2.0 during the year as well. The Jan 29th reading was one of two "coldest since records" and the other was 50F on June 8th (47F 1932 was the record value). Values of 39F and 36F on May 8th-9th would have qualified also as they were 2 and then 1 deg above 1947 record lows, but 2020 then set lower values of 36F, 34F. Also 2F on Jan 18th was a degree warmer than the existing record (1F from 1875), but 1982 went another degree lower than that to 0F. There were also one surviving high minimum reading, 50F Mar 11th (tied 1967) for a count of 0.50; the July heat wave had lows of 78F on several nights but records were in the low 80s. Another 1977 high minimum (tied 1966) was taken away by 2020 on November 10th. The year only had 1.83 record high minima in total before falling gradually to the current count of 0.50. Temp ___ date ___ replaces _ ties ______ broken ___ eventual end of data record max, recent max _66F ___ Mar 9 ______________ 1921 (66F) _ 2000 (71F) __ 2016 (76F) _ (2020 2nd (72F), 2000 3rd (71F), 1921,77 t-4th (66F), 1913,73,2002 t-6th (65F)). _73F ___ Mar 11 __ eventual record .. (1967 2nd (72F), 2021 3rd (71F), 2016 4th (68F), 1955.86,90 t-5th (67F), 1879,2014 t-8th (66F)). _79F ___ Mar 30 ____________ 1962 (79F) __ 1998 (82F) __ 1998 (82F) __ (1962,77 t-2nd (79F), 1910,86 t-4th (78F), 1979 6th (76F), 1945 7th (74F)). _90F ___ Apr 12 __ eventual record .. (1996 2nd (80F), 1947 3rd (78F), 2008,17 t-4th (76F), 1965 6th (74F), 1945, 2014 t7th (73F)) _88F ___ Apr 13 __ 1968 (82F) _______ 2023 (90F) __ 2023 (90F) .. (1968, 2018 t-3rd (82F), 1945 5th (81F), 1890 6th (79F), 2006 7th (78F), 1896, 2006,19 t8th (77F)). _96F ___ July 15 __ 1879 (95F) ___________ 1983 (98F) _ 1995 (102F) __ (1983 2nd (98F), 1997 3rd (97F), 1977 4th (96F), 1879 5th (95F), 1952,2013 t-6th (94F)). _98F ___ July 16 _____________ 1879 (98F)_ 1980 (99F) _ 1980 (99F) __ (1879,1977 t-2nd (98F), 1953,68,99 t-4th (97F), 1887,1900,83,88 t-7th (96F)). _102F __ July 19 __ eventual record .. (1930 2nd (98F), 1942,63,99 t3rd (97F), 1982,91,2008,13 t6 (96F), 1905,40 t10 (95F)). _104F _ July 21 __ eventual record .. (1930,80,91 t2nd (102F), 1926,57 t5th (100F), 1885 7th (99F), 1923,34,55 t8 (98F), 2011 11th (97F)). Record high minima (1.83), end of data 0.5 survived _48F ___ Mar 5 ___ not a record in 1977 (1974 _49F was record) 1979 _50F eventual record _50F ___ Mar 11 ___ eventual record high minimum tied 1967 __ broke 1925,55 (49F), 2016 (48F) _60F ___ Apr 13 ___ not a record in 1977 (1945 _61F was record), tied with 2018 second warmest _60F ___ Apr 22 ___________ 1926 (60F) __ 2016 (62F) __ 2016 (62F) __ also 1885, 1974 (59F) _78F ___ July 21 _________ 1940,49 (78F) _ 1980 (82F) __ 1980 (82F) __ also 2019 (80F) _58F ___ Nov 10 ___________ 1966 (58F) __ 2020 (60F) __ 2020 (60F) __ also 1975 (57F) _____________________________________________________________________ 1978 __ This year is most widely recalled for the winter storm that hit the Great Lakes region with very strong winds, heavy snow and a record low barometric pressure around Jan 25-26. Although the temperature reached 58F during that event, New York City had a rather cold winter with a few significant snowfalls. Most of the year was either cool or near average and there was only one record high maximum, 67F on Dec 4th, which lasted only until 1982 had 72 degrees on the same date. This one record broke the previous mark by only 1.0 F deg. It was eventually surpassed by 6 F deg. The average year to break 1978 records was therefore 1982 and the extinction date is Dec 4, 1982 -- this replaces 1909 for fastest extinction (4 years vs 21). Beside the four years not to set any high maximum records (1958, 1992, 2004, 2014), 1978 has the lowest count tied with 2003, 2019 and (to date) 2021, no other years were held to one record. Since those other more recent years have retained their lone records, 1978 is the only "one and done" year. With the former record now 6 deg short, the 1978 temperature now closest to a record maximum is 82F on April 1st which was one short of the already set 1917 daily record. 70F on Nov 6th is within four of that day's record. The year also set one surviving low maximum, 62F on July 4th. A reading of 45F on May 5th was two degrees above the 1891 record. (count 1.00) There were no record low minima in 1978, during the year the closest approach was within 1 deg (58F July 4th) but this has since fallen back to 3 deg with 1986 at 55F. This now makes the closest approach 2 deg (51F June 14th, 49F in 1875). Oct 9th also has a 2 deg separation, 39F vs 37F (1888, and later tied in 1988). And Oct 18th joins the group with 37F, after three years shared a record of 35F. There was just a share of one high minimum, 78F on Aug 17th (tied in 2015). There had been a count of 2.0 after 1978, the other record was July 21st (81F) which fell to 83F in 2011. Temp ___ date ___ replaces _ ties ______ broken ___ eventual end of data record max, recent max _67F ___ Dec 4 ___ 1873,1973 (66F) ____ 1982 (72F) __ 1998 (74F) _ (1982 2nd (72F), 1978 3rd (67F), 1873,1973 t-4th (66F), 1994 6th (65F), 2001 7th (64F), 1941,2012 t-8th (62F)) Record high minima (2.0), end of data 0.5 survived _81F ___ July 21 ___ 1906 (80F) _________ 2011 (83F) __ 2011 (83F) __ also 2016 (80F), 1908 (79F) _78F ___ Aug 17 ___ eventual record high minimum later tied in 2015 __ broke 1888 (77F), also 1995,2016 (77F) _____________________________________________________________ 1979 __ There was quite a cold February and a more variable regime for most of the year with occasional brief warm spells. The year produced six record highs, of which five have survived, for a survival rate of 83.3%. The average by which 1979 records broke previous marks set was 4.2 F deg. The one record broken fell in 1998 when it was improved by 11 degrees. The average would change to 2017 if all five surviving records fell this year (or next as May 9-10 will be maintained). The average for records eventually surpassing 1979 falls to 1.8 F deg counting the five survivors. There was one record low maximum (64F) on Aug 12th. The year produced six record low minima (count 4.83): 0 deg F on Feb 18th, 46F on June 12th and a share of June 26th (56F), July 5th (53F) and July 6th (54F), Aug 17th (56F tied 1881). A reading of 3F on Feb 14th was one above the existing record from 1916 which would later be broken in 2016. The count during 1979 was 5.08 as there was also the fourth component of a four-way tie for Sept 20th (45F) broken in 1993 (44F). There were also nine record high minima (count 8.00) -- 50F Mar 5th, 58F Apr 15th (tied 1982), 72F May 10th, 79F July 26th, 64F Oct 21 (tied 1947), and 67F Oct 22nd, 23rd, then 61F and 62F on Nov 24th and 25th (the latter a benchmark until replaced by 63F on Dec 24th, 2015). At 8.0, this was the best production of surviving high minima since 1908 had 8.83 (1906 at 10.67 had also exceeded it), and would later be tied by 1991 (8.0), and beaten by 2002 (10.0), 2015 (13.42), 2017 (13.17) and 2018 (9.75). It stands tied seventh highest now. The count was 11.5 at end of 1979, which was the most since 1948 had hit 12.83, and would be the most until 2015 hit 14.92 (2002 had 11.0). At random 1979 should only produce 3.3 records of any type and retain 2.4 of those by end of data. Temp ___ date ___ replaces _ ties ______ broken ___ eventual end of data record max, recent max _75F ___ Mar 31 ___ 1920 (71F) ___________ 1998 (86F) _ 1998 (86F) _ (1979,86 t-2nd (75F), 1999 4th (74F), 2016 6th (73F), 1981 5th (72F), 1920 6th (71F)) _94F ___ May 9 __ eventual record .. (1936 2nd (92F), 1896, 2000 t3rd (91F), 1970 5th (90F)). _94F ___ May 10 __ eventual record .. (1970 2nd (93F), 1896,1965 t-3rd (92F), 1889 5th (91F), 1874,1987 t-6th (90F)) _88F ___ Oct 22 __ eventual record .. (1920 2nd (83F), 1975 3rd (78F), 1949,84 t-4th (77F), 1884,1936,2007,17 t-6th (76F)). _73F ___ Nov 24 ___ eventual record .. (2014 2nd (69F), 1931 3rd (68F), 1999 4th (66F), 1966 5th (65F), 1886 5th (64F)). _73F ___ Nov 25 ___ eventual record .. (2014 2nd (68F), 2001 3rd (66F), 1973,90,2004 t-4th (65F), 1966 7th (64F)). Record high minima (11.5), end of data 8.0 survived _50F ___ Jan 1 ___ not a record in 1979 (1966 _52F was eventual record) 1979 tied with 2022 for second highest _50F ___ Mar 5 ___ eventual record high minimum __ broke 1974 (49F), 2004 (44F), also 1977 (48F) _49F ___ Mar 6 ___ 1894 (48F) __________ 2011 (50F) __ 2011 (50F) _51F ___ Mar 24 ___ not a record in 1979 (1903 _52F was eventual record) 1979 tied second highest with 1953 (51F) _59F ___ Apr 24 ___ 1869,85,1913 (57F) __ 2008 (63F) __ 2008 (63F) __ also 2007 (58F) _58F ___ Apr 25 ___ eventual record high minimum later tied by 1982 __ broke 1897 (57F) _72F ___ May 10 ___ eventual record high minimum __ broke 1896 (71F), also 1970 (70F), 1895, 1957 (67F) ... ... ... ... ... ... ... ... ... ... ... ... ... ... ... ... ... ... ... ... "recent" high minimum unusually low, only 61F from 2007, 2015. _79F ___ July 26 ___ eventual record high minimum __ broke 1870,92 (78F), recent 1995,2020 (77F) also 1885 (77F) _77F ___ Aug 29, 30 __ not records in 1979 (records were 78F 1948, 1973; 29th later 81F 2018, 1973 later tied 2018) ... ... minima of 74F, 75F, 76F Sep 4-6 within 4, 2 and 1 F of records also _71F ___ Sep 29 ___ not a record in 1979 (1959 _72F later tied 2015 was record) _64F ___ Oct 21 ___ eventual record high minimum tied 1947 __ also 1984 (62F) 1884,1906,1915,2020 (59F) _67F ___ Oct 22 ___ eventual record high minimum __ 2020 (64F), broke 1935,36,42 (62F) also 1984 (62F) _67F ___ Oct 23 ___ eventual record high minimum __ 2007 (66F), also 2020 (63F), broke 1900, 1956 (62F) _61F ___ Nov 24 ___ eventual record high minimum __ 1999 (56F), broke 1931 (54F) _62F ___ Nov 25 ___ eventual record high minimum __ 2001 (56F), broke 1908 (54F) _50F ___ Dec 25 ___ 1964 (49F) _________ 2015 (57F) __ 2015 (57F) ______________________________________________________________________________________________ 1980 __ The spring and summer of 1980 were very warm across the southern half of the U.S., NYC occasionally got into warmer spells but was not always in the warmer air masses, at least not for prolonged periods, with frequent intrusions of cooler air. There were five record highs for a count of 3.83 (one ordinary tie and one three-way tie), and of those, three have survived with a count of 2.33, for a survival rate of 60.9%. These five records broke previous values by an average of 0.8 F deg. The two that have fallen were both broken by eventual record holders in 1993 and 2001 (average 1997), if the three surviving records are broken at next opportunity, then that changes to 2012. The two broken records were surpassed by an average of 2.0 F deg which reduces to 0.8 F counting the surviving records. 1980 had no record low maxima, 21F on leap year day was coldest since 12F in 1884 as was 26F on March 1st (since the record of 16F in 1886). There are two surviving record low minima, 47F on June 9th and --1F on Dec 25th (count 2.00). Feb 29th (12F) was the coldest leap year day minimum since the record of 4F set in 1884 and 10F on March 1st coldest since 5F in 1884. There were four surviving record high minima, 69F May 23rd (tied 1941), 82F July 21st, 80F Aug 8th, and 76F Sep 1st (part of a four-way tie) for a count of 2.75. No other records were set but the count was 3.0 at end of 1980 because the September 1st tie gained two extra shares (in 2010 and 2015). Note on reporting of record high minima: Up until 1979 the entries always showed the "recent" highest value if it was not the eventual record, in an underlined format, and it applies to the period 1980 to 2022 (or later current year going forward). So now we have reached 1980, this will change to the following protocol: each entry shown will be either a new record (including ties of older ones), which would then be found in earlier entries for that date as the eventual record, or it will show all cases where these years set "warmest recent" in which case it would have appeared that way (underlined) before. There will not be any further "not a record" entries, if a temperature does not qualify as one or the other, it might be mentioned in the verbal summary above the listings. Temp ___ date ___ replaces _ ties ______ broken ___ eventual end of data record max, recent max _90F ___ May 5 __ eventual record tied by 1949, 1955 .. 1930, 1934 t4th (89F), 1919 6th (88F), 1944 7th (87F), 2000 8th (86F). _99F ___ July 16 __ eventual record .. (1879,1977 t-2nd (98F), 1953,68,99 t-4th (97F), 1887,1900,83,88 t-7th (96F), 1952 11th (95F)). _101F __ July 20 __ eventual record .. (1991 2nd (100F), 1923 3rd (99F), 1957 4th (97F), 1942,52,2019 t-5th (95F), 1930,46,2008,17 t-8th (94F)). _96F ___ Aug 8 ___ 1896,1941 (95F) _______ 2001 (99F) _ 2001 (99F) __ (1980 2nd (96F), 1896,1941,1983 t3rd (95F), 1916,18,79 t6 (94F)). _71F ___ Nov 14 ______________ 1973 (71F)_ 1993 (72F) _ 1993 (72F) __(1973,80 t2nd (71F), 1989 4th (70F), 2011 5th (69F), 1955 6th (68F), 1951,59,78 (67F)) Record high minima (3.0), end of data 2.75 survived. _69F ___ May 23 ___ eventual record high minimum tied 1941 __ also 1884 and 2021 (68F) _68F ___ May 24 ___ warmest recent (1980-2025) tied 2024, after record of 70F in 1884,1902,1964 _74F __ June 25 ___ warmest recent (1980-2024) tied 2002, after record of 1909 (78F) and 1952 (75F) ... ... ... this was terminated in 2025 by new record set in 2025 (81F) _82F ___ July 21 ___ eventual record high minimum __ broke 1940,49,77 (78F) _80F ___ Aug 8 ____ eventual record high minimum __ broke 1896 (79F), also 2011 (79F) _76F ___ Aug 27 ___ warmest recent (1980-2024) after record of 78F in 1948 _76F ___ Sep 1 ___ eventual record high minimum tied 1898, later tied by 2010, 2015 _73F ___ Sep 22 ___ warmest recent (1980-2024) tied 1989, after record of 75F in 1895 _76F ___ Aug 27 ___ warmest recent (1980-2024) after record of 78F in 1948 ___________________________________________ decade of 1981-1990 _______________________________________ The pace of warming accelerated during this decade. December 1982 set a number of records (several of which have been replaced) but the more impressive surge of warmth came from 1987 to 1990 (and it continued into 1991) with 1988 and 1990 near the top of lists of records set and surviving. The decade's count was 52.91 records, out of which 31.41 have survived. These 64 in total (a count that includes two three- and one four-way ties which become more frequent near the end of the data) occurred on a total of 59 dates with 21 being ties for an actual date count of 47.91 (the 5.00 surplus comes from various duplicate efforts during the decade). 1981 __ This year was more often cold than warm, with only two records set in February and April, both have survived untied (count 2.00), and 1981 is therefore the first year in the data set that can lay claim to a 100% survival rate. The next two are 1994 and 1995. These two 1981 high maxima broke previous records by an average of 4.5 deg F. Their extinction will be determined entirely by future events, and that average would be March 11, 2022 if they fall next spring, and the average by which they have been surpassed is obviously 0.0 F deg (for the first time). The third closest reading to a record at the time was 3 deg lower on March 31st (72F) but now that has become 4 deg on several hot summer days since March 31st was lifted by 11 degrees in 1998. The random expectation of a number of record highs for 1981 was 3.23 so it was one of the few in the past half century to fall below that value. There was one record low maximum, 14F on January 4th (tied 1904) for a count of 0.50. The minimum of 2F on Jan 13th gives a count of 0.33 (tied with 1886, 1968). There were no other record lows set and later broken, so that the count within the year was also 0.33. A reading of 5F on Jan 4th was the coldest for that date since the record of -3F set in 1918. A closer approach to an older record was 58F on June 27th (55F 1940 the record) and also 59F Aug 17th (1881, 1979 tied at 56F). For record high minima, the count is 2.0, with one in late February and one in July (48F Feb 18th, and 80F July 9th). While breaking the 1936 heat wave low of 77F and the next year's 79F, the daytime high of 96F was 10 deg short of the 1936 all-time record on this date (and 4 short of 1937). This shows that in the modern urban environment, the summer heat is retained longer into the nights than was the case almost a century ago. Another 0.5 was lost to the 1981 count when 2022 defeated the 1981 and 2011 tie of 46F Feb 17th. In fact the count was 6.25 at end of the year, a survival rate of only 32%, and after 1981, only 1983 and 1997 have lower survival rates (excluding three years that set no records to be lost). In addition to records set and recent warmest, May 24th (71F) was (with 2007) the warmest reading between tied records 1880 and 2018 (72F). (see note after 1980 summary above for new criteria for listing record high minima. Also changing from here to end, later ties are noted immediately after the year and temperature for "replaces" and are not shown after the eventual record, in cases where an eventual record is warmer than the tied pair. In those cases (see for example Feb 17, 19 below), there is only further listing of the year that breaks the tie and sets the eventual record, unless more than one new record occurs, in which case, all of them are listed.) Temp ___ date ___ replaces _ ties ______ broken ___ eventual end of data record max, recent max _68F ___ Feb 18 __ eventual record .. (2011 2nd (67F), 1890,2008 t-3rd (64F), 1880,2017 t-5th (63F), 1938 7th (60F), 1994 8th (59F), 1954 9th (58F)). _81F ___ Apr 3 ___ eventual record .. (2002 2nd (77F), 1967 3rd (76F), 1892, 1945 t4th (75F), 1921,32,64,74 t6 (71F)). Record high minima (6.25), end of data 2.0 survived _46F ___ Feb 17 ___ 1891,1948 (44F)_later tied 2011 (46F)_ 2022 (48F) _48F ___ Feb 18 ___ eventual record high minimum __ broke 1880 (43F), also 2011 (46F) _49F ___ Feb 19 ___ 1909,39 (42F) ___ later tied 1997 (49F) _ 2017 (53F) _47F ___ Feb 20 ___ warmest recent (1980-2025) later tied 2018, after record of 48F in 1939 _43F ___ Feb 22 ___ 1930 (42F) __________ 1996 (46F) __ 1996 (46F) _57F ___ Mar 31 ____________ 1962 (57F) __ 1986 (60F) __ 1998 (66F) _52F ___ Apr 2 ____ warmest recent (1980-2025) later tied 1986, after record of 61F in 1967 _54F ___ Apr 4 ____ warmest recent (1980-2025), after record of 62F in 1892 _77F ___ July 8 _____ 1929, later 1986 (77F) __ 1993 (80F) __ 1993 (80F) _80F ___ July 9 ___ eventual record high minimum __ broke 1937 (79F), also 1905,93 (78F) _79F ___ July 10 _________ 1905,10,37 (79F) __ 1993 (80F) __ 1993 (80F) _78F ___ July 13 ____ warmest recent (1980-2024) tied 1908, 1966, after record of 79F in 1896 _71F ___ Sep 12 __ warmest recent (1980-2024) tied 2018 __ warmest since 1971 (72F), eventual record 1895 (77F) _71F ___ Sep 14 ____ warmest recent (1980-2024) after 1961 (72F) and earlier eventual record of 74F in 1947 ______________________________________________________________________ 1982 __ This year was generally cooler than average until mid-November, then the effects of a major El Nino event were felt with some very warm temperatures in December. It turned out that several more such Decembers would occur in subsequent years so that of the six records set, only two have survived, one had tied a 1936 record (Dec 26th) and another would be matched in 2008. The rest all fell to either 1998 or 2001 early in the month, or 1984 and 2015 near the end. Seven records were set (three were ties in 1982) for a count of 5.50. With two tied surviving records, that count is 1.00 for a survival rate of 18.2%. These 1982 records broke previous marks by an average of 3.0 F deg. The five since broken were surpassed on average by 2000, and that would change to 2006 if the two surviving tied records are broken this December. Before November, the closest 1982 had come to a daily record was 58F on Feb 1st which at the time was within 2 (1916 hit 60F) but is now 11 degrees short of the 1989 record. July 18th (98F), warmest day of 1982, remains three short of the 1953 record of 101F. Nov 3rd 1982 (74F) was one degree short of the 1936 record (and is now 5 degrees below 2003). The year also set four low maximum records, 30F April 7th is a benchmark low maximum, 39F April 9th part of a three-way tie, 55F set on May 24th, 55F on June 13th another benchmark low maximum (count 3.33 from 3.5 during year, the third tie for Apr 9th came later in 2003 -- this is the third last high maximum count to be later decreased among the roughly half of remaining years that set or tied any). There were five record low minima, 0 deg F on Jan 18th, and 21F Apr 6th-7th (the latter also a benchmark), 25F Apr 8th, and a share of 50F (tying 1965,1986) on Aug 29th which is also a tied monthly minimum. The count is therefore 4.33. Within the year the count was 4.5 since 1986 tied later, and also 52F on June 13th came within 1F deg of the record set in 1953, one of six occasions in 1982 with a coldest since record set value (count 5.33). The year also managed to set four high minimum records that have survived, 58F Apr 25th tied with 1979, 62F Nov 4th, 52F Dec 2nd, 56F Dec 5th (tied 1973), and lost several others set in December to later years including 58F Dec 4th (to 59F 1998). The count here is 3.00 from the original 7.67. After the year ended, six consecutive records were held for Dec 1-6, four of them were later lost to 1990, 1998 or 2001. Temp ___ date ___ replaces _ ties ______ broken ___ eventual end of data record max, recent max _72F ___ Dec 4 ___ 1978 (67F) __________ 1998 (74F) _ 1998 (74F) _ (1982 2nd (72F), 1978 3rd (67F), 1873,1973 t-4th (66F), 1994 6th (65F), 2001 7th (64F), 1941,2012 t-8th (62F)) _63F ___ Dec 5 _____________ 1916 (63F) _ 2001 (70F) _ 2001 (70F) _ (1916,82,98,99 t-2nd (63F), 1960,94 t6rh (62F), 1973,2017 t-8th (61F)). _68F ___ Dec 6 ___ 1912,60 (64F) ________ 2001 (71F) _ 2001 (71F) __ (1982 2nd (68F), 1998 3rd (66F), 1912,60 t-4th (64F), 1951,53,94 t-6th (63F)) _64F ___ Dec 25 ____________ 1889 (64F) _ 2015 (66F) _ 2015 (66F) __ (1889, 1982 t-2nd (64F), 1940,2014 t-4th (62F), 1979,2020 t-6th (61F), 1964 8th (60F)). _63F ___ Dec 26 ___ eventual record tied by 1936 .. (1889 3rd (62F), 1895, 1964 t-4th (60F), 2015 6th (59F)) _65F ___ Dec 28 ___ eventual record later tied by 2008 .. (1954 3rd (61F), 2018 4th (60F), 1936,49,88 t-5th (59F), 1984 8th (56F)). _65F ___ Dec 29 ___ 1905,54 (57F) _____ 1984 (70F) _ 1984 (70F) __ (1982 2nd (65F), 1905,54,2018 t3rd (57F), 1948 6th (56F), 1901,40,96 t-7th (55F)). Record high minima (7.67), end of data 3.0 survived _43F ___ Feb 16 ______ 1954, 1976, 1984 (43F) __ 2002 (44F) _ 2023 (56F) _58F ___ Apr 25 ___ eventual record high minimum tied 1979 __ 1897 (57F), 2008, 2011 (56F) _67F ___ Oct 8 _______ 1922,49,1990,2007 (67F) __ 2017 (72F) _ 2017 (72F) _62F ___ Nov 1 ____ warmest recent (1980-2024) after record of 65F in 1956 and 63F in 1971 _62F ___ Nov 3 ____ warmest recent (1980-2024) after record of 64F in 1936 _62F ___ Nov 4 ___ eventual record high minimum __ broke 1961,75 (61F), also 1948 (59F) _55F ___ Nov 12 ___ was warmest recent (1980-2021) after records of 56F in 1912, 1935, broken by 60F in 2022 _48F ___ Dec 1 ___ 1899 (47F) __________ 1991 (50F) __ 2001 (52F) _52F ___ Dec 2 ___ eventual record high minimum __ broke 1970 (49F), also 1939,68 (47F) _51F ___ Dec 3 ___ 1970 (49F) __________ 1998 (53F) __ 1998 (53F) _58F ___ Dec 4 ___ 1948 (48F) __________ 1998 (59F) __ 1998 (59F) _56F ___ Dec 5 ___ eventual record high minimum tied 1973 __ also 2001 (55F), 1916,51 (53F) _57F ___ Dec 6 ___ 1951 (51F) __________ 2001 (58F) __ 2001 (58F) _______________________________________________________________________________________ 1983 __ This was the wettest year on record at NYC with almost double the normal average rainfall. It was generally a rather warm year but quite often the warmth was subdued, so that the count of record highs was only 5.50 from a total of seven. Four records have survived, all from September and three were tied with 1931 or 1895 when set so that the count of surviving records is 2.50 for a survival rate of 45.4%. The average by which 1983 broke existing records was 2.6 F deg. The three since broken were lost in 1989, 1991 and 1995 (average by actual dates late 1991) which would change to 2008 if the four September records were broken in 2021. The average eventual surplus of the three broken records from 1983 was 6.0 F deg which drops to 2.6 F counting the four survivors. There was one record low maximum of 13F on Dec 25th. (count 1.00) The minimum of 6F on Dec 24th was also a record low (count 1.00) although 4F on 25th did not break the 1980 record (-1F). The closest value to a record otherwise was 1, 2 and 2 deg (May 16-18, 43F, 41F, 43F). There were two record high minima in 1983 for a count of 1.33. 77F had a one-third share of Aug 20th with 1906 and 2015, and 78F on Sep 11th which was a benchmark (although 77F on 23rd 1970 probably more of an outlier). This count of 1.33 is the residue of a much larger count (8.083) during the year. The survival rate of only 16.5 per cent is second lowest of the recent era; 1997 had none left of its 1.33 original. Three years (1994, 2003, 2004) set no records to preserve. Temp ___ date ___ replaces _ ties ______ broken ___ eventual end of data record max, recent max _59F __ Feb 3 ___ 1970 (52F) __________ 1991 (64F) __ 1991 (64F) __ (2006 2nd (62F), 1983, 2018 t-3rd (59F), 2020 5th (57F), 1970 6th (56F)). _68F __ Mar 15 __ 1913,45,71 (63F) ___ 1989 (69F) __ 1990 (77F) __ (2019 2nd (75F), 1995 3rd (72F), 1989 4th (69F), 1983 5th (68F)). _98F ___ July 15 __ 1977 (96F) _________ 1995 (102F) _ 1995 (102F) __ (1983 2nd (98F), 1997 3rd (97F), 1977 4th (96F), 1879 5th (95F), 1952,2013 t-6th (94F)). _97F ___ Sep 10 ___ eventual record tied by 1931 .. (1989 3rd (94F), 1894, 1897 t-4th (93F) 1961, 1965 t6th (92F) 1884 8th (91F)). _99F ___ Sep 11 ___ eventual record tied by 1931 .. (2013 3rd (96F), 1895,1897,1961,1964 t4th (92F), 1912,89 t-8th (91F)). _94F ___ Sep 19 ___ eventual record .. (1906,46 t2nd (90F), 1947 4th (88F), 1882,1963,67 t-5th (87F)) _93F ___ Sep 20 ___ eventual record tied by 1895 .. (1985 3rd (88F), 1870,1946 t-4th (86F), 1968 6th (85F), 1878,82,1914,17,26,51 t-7th (84F)). Record high minima (8.083), end of data 1.33 survived _45F ___ Feb 3 ___ 1877,90,1903 (38F) ___ 1999,2006 (46F) _ 1999, 2006 (46F) __ also 2012 (42F) _52F ___ Mar 19 __ 1945 (49F) ___________ 2012 (55F) __ 2012 (55F) __ also 2010, 2022 (49F) _62F ___ Apr 28 _________ 1935,62 (62F) __ 1990,2009 (69F) _ 1990,2009 (69F) __ also 1908,38 (59F) _63F ___ Apr 29 _____________ 1956 (63F) __ 2017 (64F) __ 2017 (64F) __ also 2024 (63F), 1957 (62F), 1974 (61F) _59F ___ Apr 30 ___ warmest recent (1980-2025) after 1974 (60F) and eventual record 1903 (63F) _78F ___ July 4 ______ 1876, 1908,1974 (78F) _ 1999 (79F) _ 2002 (81F) __ also 1883,1911,1966,2006 (77F) _79F ___ July 16 ___ warmest recent (1980-2024) tied in 2021, after eventual record 1952 (80F) _77F ___ Aug 20 ___ eventual record high minimum tied 1906 and later 2015 __ also 1899 (76F) _77F ___ Sep 6 ________________ 1910 (77F) __ 1985 (78F) __ 1985 (78F) __ also 1979 (76F) _75F ___ Sep 7 ___ warmest recent (1980-2022), tied 1884, after eventual record 1881 (79F), broken 2023 (76F) _78F ___ Sep 11 ___ eventual record high minimum __ broke 1884 (77F), also 2013 (77F) _73F ___ Sep 20 ____ warmest recent (1980-2024), tied 1989, after eventual record 1906 (77F) _67F ___ Oct 13 ___ 1954 (66F) __________ 1990 (69F) __ 1990 (69F) __ also 1901 (64F) _50F ___ Dec 13 ___ 1948 (48F) __________ 1991 (51F) __ 2015 (55F) _48F ___ Dec 15 ___ 1897 (47F) __ later tied 2008 (48F) _ 2015 (53F) _______________________________________________________________________ 1984 __ February was quite mild but did not break any daily records, while both Jan and Mar were rather cold. The spring was fairly average, and the summer had some early heat but was generally rather cool. Autumn warmed up gradually relative to normal and December turned very mild. There were five daily records set, one just a tie in June, then four in December (count 4.00), of which three have survived (one tied a previous record from 1937) (count 2.50) (survival rate of 62.5%). These five broke existing values by an average of 2.2 F deg. The two broken records were replaced in 2000 and 2008 (average Sep 2004) and if the three December records were broken this year, that average would change to 2014. The two replaced values were edged out by 1 deg each, and the overall average counting the three surviving records is therefore 0.4 F deg. There were two low maxima that have survived (count 2.00), both in September (4th, 66F, 28th 53F). The year produced no low minimum records, and came within 1F of record lows for March 10th (13F vs 12F in 1929) and Sept 16th (48F vs 47F in 1966). There were seven surviving high minima (49F Feb 15th, and 77F, 77F, 79F, 78F June 8th-11th, then 65F Oct 20th (tied 1916), and 55F Dec 29th). (count 6.50) This was most but not quite all of the original 7.25 records set. Temp ___ date ___ replaces _ ties ______ broken ___ eventual end of data record max, recent max _95F ___ June 10 __________ 1974 (95F) __ 2008 (96F) _ 2008 (96F) __ (1974,84 t-2nd (95F), 1959,64,2000 t-4th (92F), 1906,67,73 t-7th (91F)). _61F ___ Dec 17 ___ 1928 (60F) _________ 2000 (62F) __ 2000 (62F) ___ (1984 2nd (61F), 1928 3rd (60F), 2015 4th (59F)). _63F ___ Dec 18 ___ eventual record tied by 1937 .. (1928, 2006 t3rd (59F), 1990,2001,16 t-5th (58F)). _70F ___ Dec 29 ___ eventual record .. (1982 2nd (65F), 2024 3rd (60F), 1905,54,2018 t4th (57F), 1948 7th (56F), 1901,40,96 t-8th (55F)) _65F ___ Dec 30 ___ eventual record .. (1895,1990 t-2nd (60F), 2024 4th (58F), 1898,1948 t-4th (57F), 1910 6th (54F), 1884,91,1912,42,96 t-7th (53F)). Record high minima 7.25, end of data 6.5 survived _44F ___ Feb 12 ___ warmest recent (1980-2025) later tied 1998, 2009 _ warmest since 1966 (45F) eventual record _49F ___ Feb 15 ___ eventual record high minimum __ also 2005,18 (46F), broke 1949 (45F) _43F ___ Feb 16 ________ 1954,76,82 (43F) __ 2002 (44F) __ 2023 (56F) _77F ___ June 8 ____ eventual record high minimum __ also 1999 (76F), 2008 (74F), broke 1971 (73F) _77F ___ June 9 ____ eventual record high minimum __ broke 1933 (76F), also 2008 (76F) _79F ___ June 10 ___ eventual record high minimum __ broke 1959 (75F), also 1974 (74F) _78F ___ June 11 ___ eventual record high minimum __ broke 1974 (73F), also 2015,17 (72F) _65F ___ Oct 20 ___ eventual record high minimum tied 1916 __ also 1910 (64F), 2016 (62F) _62F ___ Oct 21 ___ warmest recent (1980-2024) _ warmest since 1947,1979 (64F) eventual tied record _62F ___ Oct 28 ___ warmest recent (1980-2024) _ warmest since 1971 (64F) eventual record _61F ___ Oct 29 ___ warmest recent (1980-2024) _ warmest since 1946 (63F) eventual record (1984 tied 1947,50) _58F ___ Nov 5 ____ warmest recent (1980-2024) t1975 _ warmest since 1961 (62F), eventual record was 1938 (63F) _43F ___ Dec 18 _____________ 1912 (43F) __ 1996 (47F) __ 1996 (47F) _55F ___ Dec 29 ___ eventual record high minimum __ also 2024 (50F), 1996 (48F), 2005 (47F), broke 1881,1905 (45F) ____________________________________________________________________ 1985 __ Although parts of January were cold, the winter overall was rather mild and the spring occasionally quite warm, then the summer was cool/average and parts of the autumn were also rather warm. This gave a few limited opportunities for records and the count was 4.50 for five daily records, three of which have survived (survival rate 66.7%). The 1985 records broke previous values by an average of 3.0 F deg. The two that have been surpassed fell in 2001 (May 1) and 2020 (Nov 10) for an average of 2011 (Feb). If the three surviving records are broken within the next year, that will change to mid 2015. The two broken 1985 records were surpassed by an average of 2.0 F deg which drops to 0.8 F deg counting the three surviving marks. There was one low maximum record set, 9F on Jan 21st (which broke 16F from 1888, the second lowest value is now 14F from 2019). Jan 21st (-2F) also broke the low minimum record also from 1888 (1F) with 2019 at 4F. There was a one-third share of April 10th (28F) for a count of 1.33. The tie included 1997 so that accounts for part of the different year count within 1985 (2.50), also there was a temporary record low minimum of 4F on the 20th, broken later by 0F in 1994. This was the second last record low minimum to fall, a later one occurred in Nov 1986. This gives 1985 a survival rate of (1.33/2.50) 53.3%. High minimum record values included 55F Feb 23rd (although 54F 24th broken 58F 2017), a one-quarter share of Sep 5th (77F) and full ownership of Sep 6th (78F) and Nov 20th (62F) for a total of four and a count of 3.25, from 5.83 set during the year. Temp ___ date ___ replaces _ ties ______ broken ___ eventual end of data record max, recent max _75F ___ Feb 24 ___ eventual record .. (2017 2nd (70F), 1930,61 t-3rd (65F), 2000 5th (64F), 1984 6th (63F), 1943, 2020 t-7th (62F)). _84F ___ May 1 _________ 1899 (84F) _ 2001 (87F) _ 2001 (87F) __ (2010 2nd (85F), 1899,1985 t-3rd (84F), 1944,90 t-5th (83F), 1894,1957,1993 t-7 (82F)). _94F ___ Sep 5 ___ eventual record .. (1961 2nd (93F), 1983 3rd (91F), 1884,98,1944,59,70,71 t-4th (90F), 1964,2018 t-10 (89F)). _73F ___ Nov 10 ___ 1931 (72F) _______ 2020 (74F) _ 2020 (74F) __ (1985 2nd (73F), 1931,2009 t-3rd (72F), 1966 5th (70F), 1949 6th (69F), 1895,1948,64 t-7th (68F)). _77F ___ Nov 20 ___ eventual record .. (1934,42,48,91 t2nd 74F), 1913,41 t-6th (72F), 1953 8th (71F), 1900,99 t9 (69F)). Record high minima (5.83), end of data 3.25 survived _55F ___ Feb 23 ___ eventual record high minimum __ 1990 (50F), 2012 (46F), broke 1943 (45F) _54F ___ Feb 24 ___ 1930 (50F) _________ 2017 (58F) __ 2017 (58F) __ also 1981, 2000 (48F) _59F ___ Mar 28 ___________ 1945 (59F) __ 1998 (63F) __ 1998 (63F) __ also 1949,89 (56F), 1946 (55F) _65F ___ Apr 19 ___ warmest recent (1980-2025) __ warmest since eventual record 1976 (68F) _66F ___ May 12 ___ warmest recent (1980-2025) tied 1970, 1993 __ warmest since eventual record 1959 (67F) _66F ___ May 13 ___ warmest recent (1980-2025) tied 1991 __ warmest since eventual record 1956 (69F) _68F ___ June 3 ____ warmest recent (1980-2023) tied 1990 __ warmest since 1960 (70F) and eventual record 1943 (75F) __ warmest recent broken by 72F 2024. _80F ___ Aug 15 ___ 1908 (78F) _________ 1988 (81F) __ 1988 (81F) __ also 2016 (77F), 1897,1947 (76F) _77F ___ Sep 5 ___ eventual record high minimum tied with 1898, 1907, 2018 __ also 1880 (76F) _78F ___ Sep 6 ___ eventual record high minimum __ broke 1910,1983 (77F), also 1979 (76F) _62F ___ Nov 20 ___ eventual record high minimum __ broke 1900, 1913 (56F), also 1941,54,91 (55F) ______________________________________________________________ 1986 __ Although often near long-term average temperatures, there were occasional brief warm spells in the spring, summer and autumn months, leading to a count of six records (three ties) and a count of 4.50. Of these, two have survived, one was tied by 1986 so the count is 1.50 and the survival rate 33.3%. By this point, the expected count of records is down to 3.09 (the surviving count random expectation is always 2.4). These six broke (or tied) previous values by an average of only 0.7 F deg. The four that were later surpassed went in 1987, 1998, 1999 and 2010 (average 1998) but that would become 2007 if the two surviving records fell in the next year (May 6 did not recently). The four broken records have been surpassed eventually by an average of 5.25 F deg which would be reduced to 3.5 F counting the two surviving values. 63F on Jan 18th came within 3 deg of the existing record (1973 since tied 1990), 59F on Jan 22nd within two of the 1916,1959 tied record, and 75F Mar 26th within one of the 1922 record (later broken in 2021, so now 7 deg lower than that). 63F on Nov 26th was within four of the 1946 record. There were no record low maximum values in 1986. The year had three low minimum records, 55F on July 4th and another share of the 50F on Aug 29th (tied 1965,82) then 45F on Sep 17th for a count of 2.33. The year's count originally was 3.33, as a record was also set on Nov. 13th (24F), later broken in 2019 (23F). This gives a survival rate for 1986 of 70% -- this will be the last year where survival rate is mentioned, since all later years have either (a) no records or (b) all surviving low minimum records. After 1986, about 24 daily low minimum records were set and none have later been broken. In that 35-year interval there would be about 84 records set at random, so the warming trend has eaten into the production rate by a noticeable factor of about 3.5 : 1. This warming trend in addition to the short time available also makes it less likely that any given new record would be broken. However, since this last broken record low minimum, a total of 26 record highs have been set and later broken (from 1987 to 2017, records set 2018 to 2021 have so far survived to 2022). High minimum records included 45F Jan 19th, 52F Mar 26th (tied by 2021), May 19th (68F), for a total of three and a count of 2.50. Also on May 30th 73F set a record but that was broken the next year (like the max) by 74F 1987. The minimum of 69F to go with the record high set Sep 30th was one degree short of the 1959 high minimum record (70F). The original count was 6.33 and the survival rate of 39.5% is lowest for any year that set high minima (only three did not) after 1983 (16.5%). Temp ___ date ___ replaces _ ties ______ broken ___ eventual end of data record max, recent max _75F ___ Mar 31 __________ 1979 (75F) _ 1998 (86F) _ 1998 (86F) _ (1979,86 t-2nd (75F), 1999 4th (74F), 2016 6th (73F), 1981 5th (72F), 1920 6th (71F)) _92F ___ May 6 __ eventual record tied by 1949 .. (1930 3rd (91F), 1918 4th (90F) 1934,39,2000 t5 (89F)). _94F ___ May 30 ___ 1871,1942 (92F) __ 1987 (97F) __ 1987 (97F) __ (1986 2nd (94F), 1871,1942 t3rd (92F), 1931 5th (91F), 1895,1969,1991,2013 t6th (90F)). _98F __ July 6 _____________ 1911 (98F) __ 1999 (101F) _ 2010 (103F) __ (1999 2nd (101F), 1911,86 t-3rd (98F), 2020 5th (96F), 1908 6th (95F)). _98F ___ July 7 ____ 1934 (97F) __________2010 (100F) _ 2010 (100F) __ (1986,1993 t2nd (98F), 1934,1994,2012 4th (97F)). _89F ___ Sep 30 ___ eventual record .. (1905 2nd (88F), 1921 3rd (87F), 1927 4th (85F), 1952,54 t5th (83F) 1881,1959 t7th(82F) __ __ __ __ __ __ 1922 9th(81F), 1939,1960 t10th (80F), 1901,2015 t12th (79F)). (unusual late appearance for post-1990 on this date). Record high minima (6.33), end of data 2.5 survived _45F __ Jan 19 __ eventual record high minimum __ broke 1973 (44F), 1942 (43F), 1876,1880,1933,2010 (40F) _52F __ Mar 26 __ eventual record high minimum later tied by 2021 __ broke 1946 (51F), also 1963,1988,2000 (50F) _60F __ Mar 31 __ 1962,81 (57F) _______ 1998 (66F) __ 1998 (66F) _54F __ Apr 1 ____ 1948,52 (52F) _ later tied by 2008 (54F) _ 2016 (61F) _52F ___ Apr 2 ____ warmest recent (1980-2025) tied 1981, after record of 61F in 1967 _68F ___May 19 __ eventual record high minimum __ broke 1903 (67F), also 1911, 2017 (66F), 1877,1889,1936 (65F) _73F __ May 30 __ 1919,31 (70F) ______ 1987 (74F) __ 1987 (74F) _77F __ July 8 ___________1929,81 (77F) _ 1993 (80F) __ 1993 (80F) __ also 2010,2015 (77F) _69F ___ Sep 30 ___ warmest recent (1980-2024) later tied by 2010, after record of 70F in 1959 _63F ___ Oct 1 ___ warmest recent (1980-2024) later tied by 2018,2019, after 70F (1959) and eventual record 72F (1954) _69F ___ Oct 4 ___ warmest recent (1980-2024) later tied by 2007, after 70F (1954) and eventual record 75F (1898) _________________________________________________ 1987 __ Temperature trends began to rise during 1987 leading into one of warmest five year intervals (1987 to 1991) for both averages and record temperature production. However, 1987 did no better basically than the previous three years had done in setting records at NYC, with five set (two tied earlier values) for a count of 3.83, and three of these have survived (one was tied in 1987 and tied again in 2002 to become a one-third share) so the count of surviving records is 2.33. That yields a survival rate of 60.8%. These five records surpassed earlier values by an average of 3.0 F deg. The two since broken were both overtaken in July 1999 and if the three others fell within the next year, that average would change to 2012. The two were broken by an average of 2.5 F deg which reduces to 1.0 F counting the surviving records. In addition to the records, Nov 4th (77F) came within one degree of the already set 78F from 1975. 1987 had four low maximum records, the first came just two days after the high maximum noted for Mar 8th; Mar 10th saw 28F. This was the fastest reversal in either direction for record maximum values. Previously it had been five days for high to low May 12-16 1881 and Aug 6-11, 1931 and three for low to high (June 22-25, 1952). (note only eventual records were checked for this, there may have been faster transitions for temporary records later broken, and these values were not challenged since 1987). Then May 4th (48F) tied 1871 and July 7th (71F) added a one-third share, with 33F on Nov 11th the final record. The count was thus 2.83. There were no record low minimum values for 1987, and the closest to an existing and surviving record low is within 2 deg (March 11th, 16F; Oct 4th, 39F; and Nov 21st, 18F). Two others were within two degrees (40F on Oct 14th, and 30F on Nov 11th) but the margin has widened with lower values becoming new records after the fact (37F 1988, 24F 2017). Three high minimum records survive; 54F on Mar 8th (the minimum was three degrees higher than the record value on March 10th), then 74F and 76F on May 30th-31st (count 3.00). The year had four records (count 4.0) and lost one (76F, Aug 18th) when 2002 recorded 78F. Temp ___ date ___ replaces _ ties ______ broken ___ eventual end of data record max, recent max _76F ___ Mar 8 ___ eventual record .. (2012 2nd (71F), 2016 3rd (67F), 1878 4th (65F), 2009 5th (64F)) _97F ___ May 30 __ eventual record .. (1986 2nd (94F), 1871,1942 t3rd (92F), 1931 5th (91F), 1895,1969,1991,2013 t6th (90F)) _94F ___ July 24 ________ 1910,33 (94F) _ 1999 (97F) _ 1999,2010 (97F) _ (1910,33,87,2016 t-3rd (94F), 1929,44 t-7th (93F)). _95F ___ July 25 ___ 1873,85,1944 (94F) __ 1999 (99F) __ 1999 (97F) __ (1987 2nd (95F), 1873,85,1944,2001 t3rd (94F) 1870,92,1930,39,2010,16 t7th (93F)) _94F ___ Aug 18 ___ eventual record tied by 1913 and later by 2002 .. (1956,1995 t-4th (92F), 1872,1922,1937,1966 t-6th (91F)). Record high minima (4.0), end of data 3.0 survived _54F ___ Mar 8 ___ eventual record high minimum __ also 2012 (53F), 1992 (49F), broke 1878, 1903 (47F) also 2010,16 (47F) _71F ___ May 29 __ warmest recent (1980-2025) since 1969 (74F) eventual record high minimum _74F ___ May 30 __ eventual record high minimum __ broke 1986 (73F), also 2013 (72F) _76F ___ May 31 __ eventual record high minimum __ [monthly max] __ broke 1895 (75F), also 2013 (75F) _74F ___ June 20 __ warmest recent (1980-2025) tied 1943 (74F), the eventual record high minimum 1892 (76F) _77F ___ July 25 ___ warmest recent (1980-2024) tied 1995, 1999, 2001 __ warmest since 1910 (79F) and eventual record 1885 (80F) _76F ___ Aug 18 ___ 1955 (75F) __________ 2002 (78F) __ 2002 (78F) ___________________________________________________________________________ 1988 __ This was a very warm year and discussion of "global warming" began to emerge into the mainstream of society around this time (Dec 1982 was probably where it first began to get noticed). The year set 11 records for a count of 8.58 (two tied, one a three-way tie and another a four-way tie). Compared to the expected count of 3.05, this was 281% of expected, ranking tenth, and exceeded since then by 2001 (468%), 1990 (384%), 1991 (337%) and 1998 (303%). Previous years that exceeded 1988 in this regard were 1913 (325%), 1949 (318%), 1945 (299%), 1938 (297%), and 1931 (285%). The eventual record count of 7.08 from nine surviving records ranks seventh, behind 2001 (9.33), 1991 (8.5), 1953 and 1990 (8.0), 1949 (7.58) and 1931 (7.25). The summer of 1988 was very hot and accounted for most of the year's records. They broke previous values on average by only 1.3 F deg, for the two records that did not survive, one was broken the following year 1989 and one lasted until 2002 (which was again broken by 2005). That would be an average of late 1995 but that changes to 2016 if the nine surviving records were all broken in the next year. The two were surpassed eventually by an average of 4.0 F deg which reduces to 0.7 F counting the nine survivors. There were three low maximum records, a tie for Jan 14th (17F) with 1893, and a benchmark of 45F on Oct 8th, then 20F on Dec 12th. (count 2.50). The surviving count was 2.33 when the Jan 14th tie gained a third participant in 2004. Four record low minima were set, three at 37F, on Oct 8th, 9th (tied 1888) and 14th, then 5F on Dec 12th. The count was 3.50. There were also six occasions with a coldest reading since a record low. Record high minima include 50F (Feb 1st), 79F (July 11th), 80F (Aug 12th), and 81F (Aug 15th) -- count was 4.00. A fifth record set during the year (79F on July 30th) was lost when 2002 recorded 80F. Temp ___ date ___ replaces _ ties ______ broken ___ eventual end of data record max, recent max _62F ___ Feb 1 ___ 1916 (60F) ________ 1989 (67F) _ 1989 (67F) __ (1988,2012 t-2nd (62F), 1916 4th (60F), 2016 5th (59F), 1982 6th (58F)). _59F ___ Feb 2 ___ eventual record .. (1967,73 t2nd (58F), 1989 4th (57F), 1970,99,2014 t-5th (56F), 1933,83 t-8th (55F).) _76F ___ Mar 24 __ eventual record .. (1913,39 t2nd (72F), 1987 4th (71F). 2000 5th (69F), 1994 6th (68F)). _96F ___ June 15 __ eventual record tied by 1891 and later by 1994 .. (1956,87 t-4th (94F), 1945,52,57 t-6th (93F), 1899, 1983,1991 t-9th (92F)). _97F ___ June 21 __ eventual record tied by 1953 .. (1923 2nd warmest (96F), 1949 3rd (95F), 1941, 2012 t-3rd (94F), 1966 5th (93F)). _98F ___ June 22 __ eventual record .. (1941 2nd (96F), 1921 3rd (95F), 1943 4th (94F), 1888 5th (93F), 1949,65,81,97 t-6th (91F)) _98F ___ July 11 __ eventual record .. (1911,93 t-2nd (97F), 1936,66,81,2010 t4th (94F), 1876,1944,87 t-8th (93F)). _98F ___ July 30 __ eventual record tied by 1917,1933,1940 .. (1954 5th (96F), 1913,1929,1949,2002 t-6th (95F), 1886,1947,1950 t-10 (94F)). _96F ___ Aug 13 ________ 1881,1944 (96F) _ 2002 (98F) __ 2005 (99F) __ (1881,1944,1988,2016 t-3rd (96F), 1947 7th (95F)). _99F ___ Aug 14 __ eventual record .. (1918,2005 t-2nd (96F), 1944,2002 t-4th (95F), 1985,2016 t-6th (94F), 1872,1908,43,47 t-8 (93F)). _97F ___ Aug 15 __ eventual record .. (1938 2nd (96F), 1944,47,85 t-3rd (95F), 1959,70 t6th (94F), 1993 8th (93F)). Record high minima (5.0), end of data 4.0 survived _41F ___ Jan 31 ___ warmest recent (1980-2025) since eventual record 43F in 1913 _50F __ Feb 1 ___ eventual record high minimum __ also 2012 (48F), 1991,2016 (44F), broke 1916 (42F) _74F ___ June 15 __ warmest recent (1980-2025) since eventual record 76F in 1899, 1945, 1956 _75F ___ June 22 ___ warmest recent (1980-2025) t2024, since eventual record 76F in 1941 _79F __ July 11 ___ eventual record high minimum __ broke 1882, 1905 (77F), also 1987,2013 (76F) _79F __ July 30 ___ 1898,1917 (78F) _____ 2002 (80F) __ 2002 (80F) __ also 2019 (78F), 1909,95.2006 (77F) _75F ___ July 31 __ warmest recent (1980-2024) tied 1983, 1995, 1999, 2008 (75F) since 1933 (78F) record 1917 (82F) _80F ___Aug 12 __ eventual record high minimum __ broke 1896 (79F), also 1905 (78F), 2005 (77F) _80F ___ Aug 14 ___ warmest recent (1980-2024) since eventual record 84F in 1908 _81F ___Aug 15 __ eventual record high minimum __ broke 1985 (80F), also 1908 (78F), 2016 (77F) _52F ___ Nov 27 ___ warmest recent (1980-2024) __ warmest since 1976 (54F), eventual record 60F in 1896 __________________________________________________________ 1989 __ While warmth was frequent again, this year had little luck at setting records, managing a total of just three (count 3.00). Two have survived, although one was later tied in 2011, reducing the count to 1.50, and the survival rate to 50%. This is the lowest survival rate of any year to the end of the data set except that three of those had no records (1992, 2004, 2014). These three records improved on previous values by an average of 4.0 F deg. The most distant record set among these was in 1934 (the others were 1983 and 1988). The one record to fall went the next year (1990). If the other two are broken in 2022, then the average will become 2011. That one record was surpassed by 8.0 F deg, which reduces to 2.7 F if we count the two survivors. December 1989 was quite cold and this is when one low maximum record was set (18F on Dec 22nd). There was one record low minimum, 57F on Aug 9th (tied 1919, count 0.50). Dec 23 (9F) was within three degrees of the record (6F from 1983). There were seven occasions with a coldest reading since a record (count 6.0). In addition, 1989 produced two record high minima, 44F (Jan 30th), and 61F (Nov 15th) (count 2.00). This made 1989 the first year of the data set to manage a perfect 100% survival rate as neither of those have been tied or broken and there were no other records set. Temp ___ date ___ replaces _ ties ______ broken ___ eventual end of data record max, recent max _67F __ Feb 2 ___ eventual record .. (1988,2012 t-2nd (62F), 1916 4th (60F), 2016 5th (59F), 1982 6th (58F)). _69F __ Mar 15 __ 1983 (68F) _______ 1990 (77F) __ 1990 (77F) __ (2019 2nd (75F), 1995 3rd (72F), 1989 4th (69F), 1983 5th (68F)). _77F ___ Mar 18 __ eventual record later tied by 2011 .. 1934 3rd (71F), 1969,99 t4 (70F), 1927,2010 t-6th (69F), 1905,45,66 t-8th (67F). Record high minima (2.0), end of data 2.0 survived _44F ___ Jan 30 __ eventual record high minimum __ also 1991 (43F), broke 1914 (42F), 1869 (41F) _72F ___ Sep 21 ____ warmest recent (1980-2023), after 1906 (75F) and eventual record 1895 (77F) _73F ___ Sep 22 ____ warmest recent (1980-2023), tied 1980, after eventual record 1895 (75F) _60F ___ Oct 31 ____ was warmest recent (1980-2023), tied 1974, 2019, after eventual record 1881, 1961 (62F) ... ... replaced by 61F 2024 _61F ___ Nov 15 __ eventual record high minimum __ broke 1869 (58F), also 2008 (58F), 1993 (57F) ______________________________________________________________________________________ 1990 __ Another very warm year, with very early summer-like warmth in mid-March setting three records, out of the annual total of 13 (three ties made the count 11.50). Ten of the records have survived, four being ties so that the count is 7.83. Compared to the expected count of 2.99, this was 384% of expected, ranking second behind only 2001 (468%). The eventual record count of 7.83 is fourth behind only 1953 (8.0), 1991 (8.5) and 2001 (9.17). These 1990 records improved on previous values by an average of 3.3 F deg, but March 13th (85F) was 15 deg higher than previous (1929, 70F), perhaps the largest single increase in daily records, although the supremacy factor now is 11 deg as 2012 hit 74F on same date. Of the three that have been broken, these were in 2003, 2011 and 2015, for an average of 2010. If the other ten were to fall in the next year, the average would shift to 2019. The three records broken have been surpassed by an average of 3.7 F deg, which reduces to 0.8 F if the ten surviving records are included. There were two record low maximum readings on July 12th (67F) and Aug 20th (68F). One record low minimum temperature in 1990 was a tie (with 1928, Feb 26th, 7F) and another was untied, 44F on Sep 18th for a count of 1.50. There were seven record high minima, one tied for a count of 6.50. These were: 46F on Jan 17th, 55F on March 16th, 53F on March 17th, 69F on Apr 28th (tied with 2009), 69F on Oct 13th, 68F on Oct 14th, and 57F on Dec 23rd. During the year, 12.25 records were set, so only 53.1% survived. That 12.25 count is the highest between 1948 and 2015 during the actual year. The outcome however is lower than the number of surviving records in 1991 and 2002 and equal to 1984, all of which set slightly fewer records. Temp ___ date ___ replaces _ ties ______ broken ___ eventual end of data record max, recent max _63F ___ Jan 17 __ eventual record .. (1913,73 t-2nd (60F), 1889 4th (57F), 1870,1933 t-5th (56F), 1885,1924 t-7th (55F), 1873,1949,95 t-9th (54F)). _66F ___ Jan 18 ___eventual record tied by 1973 .. (1986 3rd (63F), 1913, 2006 t-4th (58F), 1876,1932 t-6th (56F), 1915,37,51,99 t-8 (55F)). _63F ___ Feb 9 ____eventual record .. (1949 2nd (60F), 2001 3rd (58F), 1960 4th (57F), 1991 5th (55F), 2005 6th (54F)). _61F ___ Feb 10 __ eventual record later tied by 2001 , 2023.. (1949 2nd (60F), 1898, 2001 t-3rd (58F), 1955 5th (57F), 1909 6th (56F), 2002 7th (55F)). _85F ___ Mar 13 __ eventual record .. 2012 2nd (74F), 1995 3rd (71F), 1929,2020 t4th (70F), 1946 6th (68F), 1902,57 t7th (67F). _77F ___ Mar 15 __ eventual record .. (2019 2nd (75F), 1995 3rd (72F), 1989 4th (69F), 1983 5th (68F), 2007 6th (67F)). _82F ___ Mar 16 __ eventual record .. 1935 2nd (77F), 1945 3rd (76F), 1971 4th (69F), 2003 4th (68F). _90F ___ Apr 28 __ eventual record later tied by 2009 .. (1938,62 t3rd (89F), 1969 5th (86F), 1983,2017 t6 (85F)) _78F ___ Nov 3 ____ 1936 (75F) ________ 2003 (79F) __ 2003 (79F) __ (1990 2nd (78F), 1936 3rd (75F), 1974,1982,2017 t4 (74F), 1953 6th (73F)). _69F ___ Nov 28 ___________ 1896 (69F) _ 2011 (70F) _ 2011 (70F) __ (1896,1990 t2nd (69F), 1973 4th (68F), 1979,93,94 t5th (66F), 2001 8th (65F), 1984,2015 t-9th (64F)). _69F ___ Nov 29 ___ eventual record .. (1968 2nd (67F), 1991,2011 t-3rd (66F), 1870 5th (65F), 1905,27 t-6th (64F)) _66F ___ Dec 23 ___ eventual record tied by 1891 .. (1875,2013,2015 t-3rd (64F), 1931 6th (63F), 1949 7th (62F), 2007 8th (61F)). _63F ___ Dec 24 ___ 1941 (61F) ________ 2015 (72F) __ 2015 (72F) __ (1990,96 t-2nd (63F), 1941 4th (61F), 1891 5th (60F)). Record high minima (12.25), end of data 6.5 survived _46F ___ Jan 17 ___ eventual record high minimum __ broke 1889, 1913 (45F), also 1876,1933,1949,1995 (42F) _44F ___ Jan 18 ___ warmest recent (1980-2025) since 1973 (45F) and eventual record 1915 (47F) _45F ___ Jan 25 ___ 1967 (43F) _________ 2010 (49F) __ 2010 (49F) _41F ____ Feb 7 ___ warmest recent (1980-2025) since eventual record 1904 (42F) _45F ___ Feb 9 ____ 1956 (40F) _________ 2005 (46F) __ 2005 (46F) _42F ____ Feb 14 ___ warmest recent (1980-2025) tied 1966, warmest since eventual record 1949 (50F) _55F ___ Mar 16 ___ eventual record high minimum __ broke 1948 (52F) also 2000 (51F) _53F ___ Mar 17 ___ eventual record high minimum __ broke 1936 (50F) also 2003, 2024 (48F) _48F ___ Mar 18 __________ 1927 (48F) __ 2010 (50F) __ 2011 (51F) _69F ___ Apr 28 ___ eventual record high minimum later tied by 2009 __ broke 1935,62,83 (62F) _68F ___ June 3 ____ warmest recent (1980-2023) tied 1985 __ warmest since 1960 (70F) and eventual record 1943 (75F) __ warmest recent broken by 72F 2024. _67F ___ Oct 8 _____ 1922,49,82,later 2007 (67F)__ 2017 (72F) _ 2017 (72F) _68F ___ Oct 9 ___________ 1879 (68F) __ 2017 (71F) __ 2017 (71F) __ also 2018 (68F) _66F ___ Oct 12 ____ warmest recent (1980-2024) __ warmest since eventual record 1954 (67F) _69F ___ Oct 13 ___ eventual record high minimum __ broke 1983 (67F), also 1954 (66F), 1901 (64F) _68F ___ Oct 14 ___ eventual record high minimum __ broke 1954 (66F), also 1938, 2014 (63F) _55F ___ Nov 28 ___ 1973 (51F) _________ 2011 (56F) __ 2011 (56F) __ also 2001 (53F) _58F ___ Dec 22 ___ 1949 (48F) _________ 2013 (61F) __ 2013 (61F) __ also 2015 (53F) _57F ___ Dec 23 ___ eventual record high minimum __ also 2015 (52F), 1990 broke 1891,1931 (51F) ___________________________________ decade of 1991-2000 _____________________________________________ In the warming climate of the 1990s, a total count of 45.66 was similar to previous decades but by now, the random expectation had fallen to around 28 total records. Of the 45.66, 35.91 have survived. The 54 records set including ties were set on 51 dates, with fifteen being ties (including two three-way and two four-way ties created in the decade, one changing a three-way to a four-way tie), for a count of 43.33. The additional 2.33 were from three cases where one year in the decade broke or tied another year's record set earlier in the decade. Although the decade is well represented, the 1940s and early 1950s were slightly more productive. 1992 had no new records, the most productive years were 1991 and 1998. The production of record low minima fell off sharply to a total of only seven during this decade. Four of the ten years did not produce any new ones. 1991 __ The two-year interval 1990-91 had more surviving records than any other pair of years, and 1991 ranked second to 2001 which had 9.33 -- from a total of twelve daily records (count 10.00), eight have survived, the count being 7.50. This is a survival rate of 75% which is the highest so far other than 1981 at 100% and 1971 at 85.8%. As noted for 1988, 1991 was ranked third in terms of outperforming random expectation (337% behind 1990 at 384% and 2001 at 468%). note, will need to review this stat after 2024 broke a record held by 1991 ... The average 1991 record broke previous values by 2.1 F deg. The four that have fallen were surpassed in 1997, 2008, 2011 and 2024 (average 2010). If the other eight were broken in the next year, that would change to 2019. The four surpassed were increased by an average of 4.5 F deg, which would fall to just 1.5 F deg if the survivors were included. Another record was narrowly missed on March 2nd (71F one degree short of the 72F of 1972). 100F on July 20th and 102F on July 21st were unable to break slightly higher previously set records (101F 1980, 104F 1977). Also 92F on Sep 16th was one short of the 1915 record. 74F missed by 3 deg on Nov 20th and 64F by 2 deg on Dec 9th. There were no record low maxima or minima in 1991. The closest values to records were 72F (max, July 29th) within 3 of the record of 69F in 1884, and 53F (min, Sept 2nd) within 2 of the record (51F 1886). A total of nine days (count 8.00) set high minimum records: 46F on Feb 4th, 51F on Feb 5th, 50F (tied 1972) Mar 2nd, 63F Apr 7th, 66F Apr 8th, 68F Apr 9th (also a benchmark), 64F May 16th (tied 1879), 77F Sep 17th, 62F Nov 21st. There was a count of 11.0 at the end of the year so three of those records have since been broken. Temp ___ date ___ replaces _ ties ______ broken ___ eventual end of data record max, recent max _64F ___ Feb 3 __ eventual record .. (2006 2nd (62F), 1983, 2018 t-3rd (59F), 2020 5th (57F), 1970 6th (56F)). _68F ___ Feb 4 __ eventual record .. (2019,20 t-2nd (61F), 1883 4th (54F), 1914,28,2006 t-5th (53F)). _70F ___ Feb 5 __ eventual record .. (1890 2nd (68F), 2019 3rd (65F), 1962,93 t-4th (56F), 2006,20 t-6th (55F), 1943,2005 t-7th (53F) _58F ___ Feb 6 ____________ 1938 (57F) _ 2008 (68F) __ 2008 (68F) __ (1938,1991 t2nd (58F), 1896 4th (57F), 1960 5th (56F)). _66F ___ Feb 22 ___________1874 (66F) _ 1997 (69F) __ 1997 (69F) __ (1874,1991 t-2nd (66F), 1990 4th (63F), 1925,74,85 t-5th (62F), 1943 8th (61F)). _65F ___ Mar 3 ___ 1961,67 (64F) _______ 2024 (68F) __ 2024 (68F) __ (1961,67 t-3rd (64F), 1871,1923,72 t-5th (63F), 2002 8th (61F), 2004,07,20 t-9th (59F)) _90F ___ Apr 8 ___ eventual record .. (1929 2nd (88F), 1871 3rd (85F), 1959 4th (83F), 1999,2010 t-5th (80F), 2019 7th (79F), 1954 8th (77F)). _86F ___ Apr 9 ___ eventual record .. (1871 2nd (83F), 2013 3rd (82F), 2001 4th (78F), 1970,2002 t-5th (76F), 1981 6th (75F), 1968 7th (74F)). _96F ___ June 28__ eventual record tied by 1969 .. (1870,80,1963 t-3rd (94F), 1901,66,2010 t-6th (93F), 1943,76,93 t-9th (92F)). _99F ___ July 23 ___________ 1955 (99F) _ 2011 (100F) _ 2011 (100F) __ (1955,91 t-2nd (99F), 2016 4th (96F), 1918,52,78 t5th (95F)) _93F ___ Sep 17 ___ eventual record .. (1972 2nd (92F), 1915,41 t3rd (91F), 1942 5th (90F), 2015 6th (89F)). _70F ___ Nov 30 ___ eventual record .. (1933, 2006 2nd (69F), 1927 4th (67F), 1919 5th (64F), 2005 6th (63F)). Record high minima (11.0), end of data 8.0 survived _42F ___ Jan 20 ____ warmest recent (1980-2025) tied with 1951, 2006 __ warmest since eventual record 1900 (46F) _46F ___ Feb 4 ___ eventual record high minimum __ also 2016 (44F), 2006,20 (43F), broke 1890 (41F) _51F ___ Feb 5 ___ eventual record high minimum __ also 2019 (44F), broke 1943 (41F), 1962,64,73 (39F) _41F ___ Feb 6 ____ warmest recent (1980-2025) tied with 2008 __ warmest since eventual record 1884, 1938 (42F) _40F ___ Feb 8 ____ warmest recent (1980-2025) tied with 2005 __ warmest since eventual record 1965 (48F) _50F ___ Mar 2 ___ eventual record high minimum tied 1972 __ 1882 (48F), 1998 (45F) _48F ___ Mar 3 ___ 1878 (47F) _________ 2020 (49F) __ 2020 (49F) __ also 2004 (47F), 2024 (48F) _63F ___ Apr 7 ___ eventual record high minimum __ also 2010 (56F), broke 1954 (53F), also 2010 (56F) _66F ___ Apr 8 ___ eventual record high minimum __ broke 1929 (65F), also 2010 (64F) _68F ___ Apr 9 ___ eventual record high minimum __ broke 1871 (62F), also 1968,80,81 (55F) _66F ___ May 13 ____ warmest recent (1980-2025) tied with 1970,1985 __ warmest since eventual record 1959 (67F) _63F ___ May 14 ____ warmest recent (1980-2025) tied with 2012 __ warmest since 1942,44 (64F), eventual record 1909 (65F) _61F ___ May 15 ____ warmest recent (1980-2025) tied with 2018 __ warmest since 1976 (65F), eventual record 1900 (68F) _68F ___May 16 ___ eventual record high minimum tied with 1879 __ also 1870,76,1932,74,2004 (63F) _71F ___ May 25 ___ warmest recent (1980-2025) tied 1955, since eventual record 1880 (73F) _72F ___ May 28 ___ warmest recent (1980-2025) since eventual record 1959 (73F) _76F ___ June 16 __ warmest recent (1980-2025) tied 1957 since eventual record 1891 (78F) _77F ___ Sep 17 ___ eventual record high minimum __ broke 1915 (72F), also 1894,98, 1905,07,30 (71F) _71F ___ Sep 18 __ warmest recent (1980-2024) since eventual record 1905, 1972 (72F) _62F ___ Nov 21 ___ eventual record high minimum __ broke 1952 (55F), also 1931 (54F), 1983 (53F) _50F ___ Dec 1 ___ 1982 (48F) _________ 2001 (52F) __ 2001 (52F) __ also 1998, 2006 (49F) _42F ____ Dec 9 ___ warmest recent (1980-2024) tied 2004,12,19 __ warmest since 1972 (45F), eventual record 1966 (54F) _51F ___ Dec 13 __ 1983 (50F) _________ 2015 (55F) __ 2015 (55F) __ also 1948 (48F) _________________________________________________________ 1992 __ 1992 had a very cool summer, rather cool weather much of the time after a mild winter, and cooling was blamed on a moderate dust veil event from Pinatubo the previous year. A notable event was the snowstorm across the northeastern U.S. around Dec 9-10 with strong coastal winds. 1992 became the second year not to set any daily high maximum readings, joining with 1958. Later, 2004 and 2014 would join the no-hitters club. The closest calls to record highs in 1992 were as follows: 86F (May 2nd) __ within 3 (89F 1913) until 2001t2018 (90F) now within 4 F. 93F, 92F (May 22-23) _ within 3 (96F 1941), 2F (1964 94F). 71F (Nov 23) __ within 1 of 1931 record 72F 61F (Dec 31) __ within 2 of 1965 record 63F Just for interest I checked the starter records and if 1992 had been in the starter era, it would have set those five records (May 2nd a tie with 1899) plus five others: 62F (Jan 14th), 64F (Mar 9th), 89F (May 21st), 93F (July 14th), 58F (Dec 17th) for a count of 9.5, which was below 16 starter years and ahead of 16 (although below the average of 11.4). So it could be said that the weather in 1992 was fairly typical of the late 19th century. If 1992 had been a starter year, its extinction date would have been May 23, 1964. Despite the generally cool trends, the year set only three low maximum values, 72F on July 17th and 70F on July 23rd, part of an eventual five-way tie, and 66F on Aug 15th. (count 2.20) There were no record low minima in 1992, although the summer had frequent cool nights that were within a few degrees of records, the closest calls being 53F on June 22nd (record 52F 1897, 1940), and 59F on July 23rd (record 58F 1871, 1880), then also 30F on Nov 8th (record 29F 1886, later tied in 2019). In addition 1992 produced seven readings that were coldest since record values (count 6.50). There was also a tie for one record high minimum (58F on Nov 22nd, tied 1931) (count 0.50). This was also the count during the year. If 1992 had been a starter era year, it would have set 17 records (including four ties, count 15.0), lists are only produced for years that have no records, but for 1992 many of these would have fallen in January, March, May and November. In addition to the one tied surviving record, there was just one case where 1992 had the highest minimum of the 1980-2022 era after a previous record (that being 46F on Dec 30, following the record of 52F in 1948). Record high minima (0.5), this tie survived _58F __ Nov 22 __ eventual record high minimum tied 1931 __ also 1883 (56F), 1909,53,91 (55F) _46F ___ Dec 30 ___ warmest recent (1980-2024) __ warmest since eventual record 1948 (52F) ____________________________________________ 1993 __ This year is best remembered for the "Blizzard of 1993" which was a powerful east coast storm moving slightly inland to the west of NYC around March 13-14, 1993. This brought snowfalls of 10.6" to NYC with record daily precipitation indicating some sleet and rain during the event too. Further west 20 to 30 inch snowfalls were widespread in the higher ground of the mid-Atlantic and inland northeastern states. Like the blizzard of 1888, this snowstorm was followed by some record low daily temperatures. Meanwhile, the winter had started out mild, then turned quite cold in February and the first half of March. The summer was hot at times and set a few records, and the autumn near average with a burst of warmth in mid-November. The winter of 1993-94 would turn cold just near the end of December, until then temperatures were fairly average. The year had eight record highs, three of them ties, for a count of 6.50. Of those, six have survived, two as ties (which they became in 1993), for a count of 5.00. That is a survival rate of 76.9%. These 1993 records broke previous values by an average of 1.1 F deg. Two records broken fell in 1994 and 2010, an average of 2002. If the other six were to be defeated this coming year, that average would become 2017. The two were surpassed by an average of 2.5 F deg which reduces to 0.6 F deg if the six survivors are included. Between two record highs set or tied in 1993, came July 9th also 101F but that was against the all-time record of 106F from 1936. Also 64F on Jan 4th was two degrees short of the 1950 record on that date. There were no record low maxima in 1993. A reading of 14F on March 15th set a daily record, replacing 15F from 1916. A second low minimum record was 44F on Sep 20th (count 2.00). 38F on Oct 14th was one degree above the record recently set in 1988 (37F). There were three record high minima, 76F on June 19th, and 80F on July 8th and 10th. No other records were set, making 1993 the third year after 1989 and 1992 to preserve all its record high minima. Temp ___ date ___ replaces _ ties ______ broken ___ eventual end of data record max, recent max _64F ___Jan 5 ___ eventual record tied by 1950 .. (2007 3rd (62F), 1874 4th (59F), 1916 5th (58F), 1997 6th (57F)) _92F ___May 11 ___ eventual record .. (1896 2nd (91F), 1881,1953 t-3rd (90F), 1965,1970 t-5th (88F), 1985,2001,04 t-7th (86F)). _95F __ June 19 ___ 1929 (93F) _________ 1994 (98F) _ 1994 (98F) __ 1993 2nd (95F), 1929 3rd (94F), 1962.1995 4th (93F), 1873,1943.57 t6th (92F)). _98F ___ July 7 _____________ 1986 (98F) _ 2010 (100F) _ 2010 (100F) __ (1986,1993 t2nd (98F), 1934,1994,2012 t-4th (97F)). _100F __ July 8 ___ eventual record .. (1890,1937 t2nd (98F), 1936,88 t-4th (97F), 1962,71 t-6th (96F)) _102F __ July 10 __ eventual record tied by 1936 .. 1937 3rd (100F), 1911,1988 t-4th (99F), 1926 6th (97F)). _72F ___ Nov 14 ___ eventual record .. (1973,80 t2nd (71F), 1989 4th (70F), 2011 5th (69F), 1955 6th (68F), 1951,59,78 (67F)) _80F ___ Nov 15 ___ eventual record .. (1973 2nd (77F), 1879 3rd (73F), 1956 4th (70F), 1902,89,94 t-5th (69F), 1951 8th (68F)). Record high minima (3.0), end of data 3.0 survived. _66F ___ May 12 ___ warmest recent (1980-2025) tied 1970, 1985 __ warmest since eventual record 1959 (67F) _76F ___ June 19 ___ eventual record high minimum __ broke 1929 (75F), also 1994, 2018 (75F) _80F ___ July 8 ____ eventual record high minimum __ broke 1929,81,86 (77F) _ also 2010,15,24 (77F) _80F ___ July 10 __ eventual record high minimum __ broke 1905,10,37,81 (79F) note min July 9 was 78F _78F ___ July 12 __ warmest recent (1980-2024) tied 1911, 2011 __ warmest since eventual record 1905 (79F) _76F ___ Sep 3 ___ warmest recent (1980-2024) __ warmest since 1953 (77F) and eventual record 1898 (78F) ________________________________________________________________ 1994 __ The year started with a very cold month and February stayed rather cold, but most of the other months of 1994 were either near average or slightly above normal. This only resulted in two record highs, in mid-June, both of which have survived. June 15th was already tied with two other years at the time (1891, 1988) so the count for records set and maintained is equal (1.33) and the survival rate is 100% (the second such occurrence after 1981). With a production of only 46% of random expectation (2.90), 1994 produced at a lower rate than all other years except the four with no records (1958, 1992, 2004, 2014) and these others: 2019 (41%), 1909 (39%), 1960 (38%), 1873 (37%), 1875 (33%), and 1882 (31%). The two records set improved in one case by 3 deg (the other was a tie) for an average of 1.5 F, and as there is no average year breaking them, or higher values, the other statistics are 0 F deg and June 17, 2021 if the two records both fall in June. December had several mild days that were within a few degrees of records already set in 1982 and in some cases about to be broken again in 1998. There were two record low maxima in January: 10F on 19th and 15F on 20th. 15F on the 16th had missed by one degree (14F 1920). No further records were set (count 2.00). The same two dates produced record low minima of -2F (Jan 19th) and 0 deg F (Jan 20th). Another 0 F reading on Jan 27th was one degree above the record set in 1927, and 3F on the 16th was two higher than the record (1F 1893 later tied in 2004). Another record low occurred on Aug 7th (57F). (count 3.00) This was one of two years after 1988 that exceeded the random expectation barely, the other being 2019. There were no record high minima; 75F on June 19th had been edged out the previous year by 76F. Temp ___ date ___ replaces _ ties ______ broken ___ eventual end of data record max, recent max _96F ___ June 15 __ eventual record tied by 1891 and 1988 .. (1956,87 t-4th (94F), 1945,52,57 t-6th (93F), 1899, 1983,1991 t-9th (92F)). _98F ___ June 19 __ eventual record .. (1993 2nd (95F), 1929 3rd (94F), 1962.1995 4th (93F), 1873,1943.57 t6th (92F)) No record high minima were established, so none have survived. These seventeen records (count 15.33) would have been set had 1994 been in the starter era. The extinction date is June 19, 1993. Note however that if 1994 had been a starter year before 1901, it would have lost most of its 14.33 records before 1910. It did manage to preserve three until Dec 1982 when it lost two more. _44F ___ Feb 20 ___ broke 1874, 1906 (37F)*__ broken by 1930 (47F). Eventual record 1939 (48F) _42F ___ Feb 21 ___ broke 1899 (40F) ___ broken by 1906 (43F). Record by 1994 was 50F and later 55F in 2018 _41F ___ Mar 15 ___ broke 1878 (37F) ___ broken by 1903 (43F). Eventual record 1913, tied 2019 (49F) _46F ___ Mar 23 ___ tied 1880 (46F) _____ broken by 1903 (47F). Record by 1994 was 56F and later 58F in 2012 _46F ___ Mar 24 ___ broke 1884 (45F) ___ broken by 1903 (52F) the eventual record. _56F ___ Apr 30 ___ broke 1879,99 (55F) _ broken by 1903 (63F) the eventual record. _75F ___ June 19 __ broke 1870 (74F) ___ broken by 1993 (76F). also tied 1929 (75F) _76F ___ July 21 ___ broke sev'l (75F) ____ broken by 1930 (77F). Eventual record 1980 (82F) _70F ___ Sep 14 ___ broke 1889 (69F) ___ broken by 1903 (72F). Eventual record 1947 (74F) _60F ___ Oct 20 ___ tied 1885 (60F) _____ broken by 1906 (61F). Eventual record 1916,84 (65F) _58F ___ Nov 4 ____ broke 1896, t1903,34 (54F) _ broken by 1948 (59F). Eventual record 1982 (62F) _61F ___ Nov 6 ____ broke 1885 (58F) ___ broken by 1938 (64F). Eventual record 2015 (66F) _46F ___ Nov 29 ___ broke 1870 (43F) ___ broken by 1905 (49F). Record by 1994 (54F), eventual 2005 (58F) _44F ___ Dec 3 ____ tied 1879,99 (44F) __ broken by 1902 (47F). Record by 1994 (51F), eventual 1998 (53F) _48F ___ Dec 4 ____ broke 1873, t1925 (46F)**_ broken by 1982 (58F). Eventual record 1998 (59F) _49F ___ Dec 5 ____ broke 1870 (43F)^__ broken by 1916,51 (51F). Eventual record 1973,82 (56F) _54F ___ Dec 6 ____ broke 1879 (43F)^^__broken by 1982 (57F). Eventual record 2001 (58F) _____________________ *also broke previous records 41F in 1909 and 42F in 1922 ** also broke previous record 47F in 1938 and tied 48F in 1948 ^ also broke previous record 45F in 1912 ^^ also broke previous records 48F in 1912 and 51F in 1951 _____________________ Two others were warmest of the recent period (1980-2021 or 2022). _57F ___ Nov 5 ____ warmest recent (1980-2021) __ warmest since 1966 (52F), eventual record was 1938 (57F) ... ... ... ... broken by 65F in 2022. _51F ___ Nov 18 ___ warmest recent (1980-2024) tied 2013 __ warmest since 1961 (62F), eventual record 1938 (63F) ______________________________________________________________________________ 1995 __ This year had a mild January and a hot summer; some other months were slightly below average, and the record production was once again rather sparse, at 2 (count 2.00). That made 1995 the third year to achieve a 100% survival rate for its records (by 2022). These two records had an average increase of 2.5 F deg over previous values. If they both fall in the next eight months, the average extinction date would be Oct 15, 2022. That is technically later than 1994 but not 1981 (which has spring record dates that can only next be broken in 2023). The January record came on a somewhat cooler day than the three previous (61F, 64F, 59F) but none of them exceeded previous record highs all set in 1932 (68F, 70F, 67F). There were no record low maxima in 1995. There was a one-quarter share of the June 28th record low minimum of 54F. (count 0.25) This is the second lowest count for any year (behind 2003 with 0.17), other than the 33 years which had no final shares in the record table. The closest reading to a record low otherwise was 23F on April 5th (record 20F 1874). Record high minima included two from January, 54F (Jan 15th), 53F (Jan 16th), and this record breaker: 84F (July 15th, tied as July max with 7th, 1908, and 22nd, 2011, and also as annual maximum value with July 7th, 1908, July 22nd, 2011, and Aug 14th, 1908, then also 78F (July 27th) and 79F (July 29th, tied 2002), with 77F on Aug 17th one degree below 1978 later tied by 2015. (count 4.50, the later tie in 2002 reduced the year's original count of 5.0) Three readings of 77F from Aug 2 to 4 were also not quite records. Temp ___ date ___ replaces _ ties ______ broken ___ eventual end of data record max, recent max _ 58F ___ Jan 16 ___ eventual record .. (1924,53 t-2nd (57F), 1943 4th (56F), 1890,1933,90,91,2007 t-5th (55F), 1949 10th (54F)). _102F __ July 15 ___ eventual record .. (1983 2nd (98F), 1997 3rd (97F), 1977 4th (96F), 1879 5th (95F), 1952,2013 t-6th (94F)) Record high minima (5.0), end of data 4.5 survived _48F ___ Jan 14 ___ warmest recent (1980-2025) __ warmest since eventual record 1932 (55F) _54F ___ Jan 15 ___ eventual record high minimum __ broke 1932 (48F), also 1987 (46F) _53F ___ Jan 16 ___ eventual record high minimum __ broke 1899,1913,1932,1974 (40F), also 2016 (42F) _77F ___ July 14 ___ warmest recent (1980-2024) __ warmest since eventual record 1952 (78F) _84F ___ July 15 ___ eventual record high minimum [tied monthly, all-time max] __ broke 1891,96 (77F), also 2016 (79F), 2013 (78F) _77F ___ July 25 ___ warmest recent (1980-2024) tied 1987, 1999, 2001 __ warmest since 1910 (79F) and eventual record 1885 (80F) _77F ___ July 26 ___ warmest recent (1980-2024) tied 2020 __ warmest since eventual record 1979 (79F) _78F ___ July 27 ___ eventual record high minimum __ broke 1899, 1930 (77F), also 1882, 2020 (76F) _79F ___ July 29 ___ eventual record high minimum later tied by 2002 __ broke 1892,98 (77F), also 2015 (78F) _75F ___ July 31 __ warmest recent (1980-2024) tied 1983, 1988, 1999, 2008 (75F) since 1933 (78F) record 1917 (82F) _77F __ Aug 2-4, 17th __ not records or warmest recent __________________________________________________________________________________ 1996 __ The most noteworthy weather event of the year was the heavy snowfall on Jan 7th-8th which totalled 20.2" at NYC. Some parts of the year were quite cool and warmth confined to the spring months mainly; four records were set or tied, for a count of 3.50. Two have survived, a survival rate of 57.1%. This is lower than any following year would have except for the two (2004,2014) that set no records. These four records improved on previous marks by an average of 2.5 F deg. Two records fell in 2007 and 2015 (average Aug 2011) and if the other two (May 20, 21) fall in 2023 then the average will then be July 2017. Two broken records have been improved by an average of 5.0 F deg, which reduces to 2.5 F counting the surviving records. There was one low maximum record set, 24F on Mar 9th, and a share in a five-way tie (70F) on July 23rd for a count of 1.20. There was a record low minimum also on Mar 9th (11F). (count 1.00) The closest value to a record otherwise was within three degrees: 43F on May 14th (record 40 F 1878) matched by 40F Oct 4th (record 37F 1888). Three record high minima included 46F (Feb 22nd), 74F (May 20th) and 44F (Dec 18th). (count 3.00) Temp ___ date ___ replaces _ ties ______ broken ___ eventual end of data record max, recent max _85F ___ Apr 23 ___ 1886,1925 (83F) ___ 2007 (86F) _ 2007 (86F) __ (1996 2nd (85F), 1886,1925 t-3rd (84F), 1902, 1973 t-5th (83F), 1979,90 t-7th (81F)). _96F ___ May 20 ___ eventual record .. (1959 2nd (91F), 1939,62,78 t3rd (90F), 1903 6th (89F), 1975 7th (88F) 1877,87,1914,33,41 t-8th (87F)). _93F ___ May 21 ___ eventual record .. (1934 2nd (90F), 1912,59,92 t-3rd (89F), 1975 6th (88F), 1887,1962 t-7th (87F), 1875,1921,2009,13 t-9th (86F)). _63F ___ Dec 24 ____________ 1990 (63F) _ 2015 (72F) __ 2015 (72F) __ (1990,96 t-2nd (63F), 1941 4th (61F), 1891 5th (60F)). Record high minima (3.0), end of data 3.0 survived _46F ____ Feb 22 ___ eventual record high minimum __ broke 1981 (43F), also 2002,12 (43F), 1930,1985,2017 (42F), 1899 (41F) _47F ____ Feb 25 ____ warmest recent (1980-2025) __ warmest since eventual record 1930 (51F) _74F ____ May 20 ___ eventual record high minimum __ broke 1903 (71F), also 1898 (68F), 1959,1982 (67F) _69F ____ May 21 ____ warmest recent (1980-2025) tied 1978 __ warmest since eventual record 1959 (71F) _74F ____ Sep 10 ____ warmest recent (1980-2024) tied 1895, 2016 __ warmest since eventual record 1884 (77F) _62F ____ Nov 8 _____ warmest recent (1980-2024) __ warmest since eventual record 1975 (63F) _47F ____ Dec 18 ___ eventual record high minimum __ also 2006 (44F), broke 1912,84 (43F), also 2001,12 (43F), 1929 (42F) _____________________________________________________________________ 1997 __ The winter had mild spells, especially in late February and four records were set, three of which survived (75% survival rate). These broke existing records by an average of 2.5 F deg. The one record broken (Jan 3) fell in 2000, if the other three are broken in 2023 then that average will be 2017. The record was surpassed by 2 F deg, which makes the average 0.5 F deg counting the survivors. After the winter records, the closest temperature to a record value in the rest of 1997 was not the annual maximum of 97F (July 15th, 1995 102F) or 96F two days later (100F 1953) within 4 F. Aug 17th came within two degrees (93F vs 95F 1944 tied later 2015). The previous day had been within 3 (93F vs 96F 1944). 85F on Oct 6th was five short of the 1941 record. There were no record low maxima in 1997. The closest to a record was July 24th with 68F (record 67F 1904). Aug 20th was within two (70F vs 68F in 1990). Apr 10th had a one-third share of the low minimum record (28F). (count 0.33) ... July 24th and 25th were both within two degrees of record low minima (58F, 59F). There were no surviving record high minima in 1997 but 43F on Jan 3rd tied 1950 (broken in 1998), then 49F on Feb 19th tied the existing record from 1981, later broken by 53F in 2017. A similar outcome repeated on June 12th (tied record of 72F falling to 73F in 2015 and eventually 76F in 2017). The count within the year, 1.33, went extinct on Feb 19, 2017. 1997 is the last year in the series to lose all of its records, but 2003 and 2004 did not set any. Temp ___ date ___ replaces _ ties ______ broken ___ eventual end of data record max, recent max _62F __ Jan 3 ____ 1950 (60F) __________ 2000 (64F) __ 2000 (64F) ___ (1950 3rd (60F), 1913,51 t-4th (59F), 1876, 2004,05 t-6th (58F)). _66F ___ Feb 19 ___ eventual record .. (2017 2nd (65F), 1961 3rd (63F), 1994 4th (61F), 1948,49,54.81 t5th (59F)). _69F ___ Feb 22 ___ eventual record .. (1874,1991 t-2nd (66F), 1990 4th (63F), 1925,74,85 t-5th (62F), 1943 8th (61F)). _72F ___ Feb 27 ___ eventual record .. (1880 2nd (68F), 1976 3rd (67F), 1971 4th (66F), 1951,2009 t-5th (61F), 1957 6th (60F)). Record high minima (1.33), end of data none survived, extinction date Feb 19, 2017 _43F __ Jan 3 ___________ 1950 (43F) __ 1998 (46F) __ 2000 (51F) __ also 2005 (49F) _49F __ Feb 19 _________ 1981 (49F) __ 2017 (53F) __ 2017 (53F) __ also 1992 (43F), 1909,39 (42F) _47F ___ Feb 27 ___ warmest recent (1980-2025) __ warmest since eventual record 1976 (49F) _72F __ June 12 _____ 1942,1973, 2005 (72F) _ 2015 (73F) __ 2017 (76F) __ also 1880,1898,1914,1939 (71F) _______________________________________________________________________________ 1998 __ This was probably the warmest year of the "modern warming" era in terms of average, but it ranks 8th for the number of surviving records (seven), with nine records set (count 7.83 since the two that have since been broken were both ties of earlier values). That is a survival rate of 89.4%. The main intervals of warmth were early January, late March, and early December. A reading of 86F on March 31st tied the earlier value from March 29th, 1945. A high of 75F on Dec 7th is the highest temperature for December. Nine records set in 1998 increased previous values by an average of 3.9 F deg. The two records since broken fell in 2001 and 2013 for an average of Dec 2007. If the other seven fell in the coming year, that would change to 2019. There were no record low maxima or minima in 1998. July 8th (69F) was within two of the existing low maximum record but this changed to three when 2005 recorded 66F. That now equals the deficit of Aug 19th (73F vs 70F). The closest value to a record low minimum was 58F on Aug 20th (record 55F in 1949). The March warm spell had four consecutive high minimum records for March 28th-31st, 63F, 62F, 59F and 66F; the last one is a monthly maximum. Aug 26th (76F) added a tie (1961), and Dec 3rd-4th added two more records (53F and 59F). That was a total of seven records and a count of 6.50. The Dec 4th record was highest minimum for December at the time but was later broken in both 2013 and 2015 by readings of 61F (22nd 2013) and 63F (24th 2015). The year had 7.5 records but 46F on Jan 3rd was broken in 2000 (51F). Temp ___ date ___ replaces _ ties ______ broken ___ eventual end of data record max, recent max _65F ___ Jan 8 ___ eventual record .. (1930, 2008 t-2nd (64F), 1907,49 t-4th (60F), 2007 6th (56F), 1937,46 t-7th (54F)). _83F ___ Mar 27 __ eventual record .. (2007 2nd (78F), 1949 3rd (75F), 1945, 1985 t-4th (74F), 1914,39 t-6th (73F)). _82F ___ Mar 30 __ eventual record .. (1963,77 t-2nd (79F), 1910,86 t-4th (78F), 1979 6th (76F), 1945 7th (74F)). _86F ___ Mar 31 __ eventual record .. (1979,86 t-2nd (75F), 1999 4th (74F), 2016 6th (73F), 1981 5th (72F), 1920 6th (71F)). [Mar monthly max t1945] _69F ___ Dec 3 ___ eventual record .. (2009 2nd (66F), 1914,70 t-3rd (64F), 1994 5th (63F), 1932,93 t-6th (62F)) _74F ___ Dec 4 ___ eventual record .. (1982 2nd (72F), 1978 3rd (67F), 1873,1973 t-4th (66F), 1994 6th (65F), 2001 7th (64F), 1941,2012 t-8th (62F)). _63F ___ Dec 5 ___________ 1916,82 (63F) _ 2001 (70F) __ 2001 (70F) _ (1916,82,98,99 t-2nd (63F), 1960,94 t6rh (62F), 1973,2017 t-8th (61F)). _75F ___ Dec 7 ___ eventual record .. (1956 2nd (67F), 1951 3rd (64F), 1932 4th (63F), 2011 5th (62F)). [Dec monthly max] _63F ___ Dec 22 _________ 1949 (59F) _2013 (71F) __ 2013 (71F) __ (1946,1998 t2nd (63F), 1967, 2015 t-4th (62F), 1990 6th (61F)). Record high minima (7.5), end of data 6.5 survived _46F ___ Jan 3 ___ 1950,97 (43F) ____ 2000 (51F) __ 2000 (51F) __ also 2005 (49F) _47F ____ Jan 9 ____ warmest recent (1980-2025) tied with 2008 __ warmest since eventual record 1937 (50F) _44F ____ Feb 12 ___ warmest recent (1980-2025) tied with 1984, 2009 __ warmest since eventual record 1966 (45F) _56F ____ Mar 27 ___ warmest recent (1980-2025) __ warmest since eventual record 1949 (61F) _63F ___ Mar 28 ___ eventual record high minimum __ broke 1945,1986 (59F), also 1949,1989 (56F) _62F ___ Mar 29 ___ eventual record high minimum __ broke 1945 (60F) also 1907 (58F) _59F ___ Mar 30 ___ eventual record high minimum __ broke 1945 (58F) also 1977,81 (56F) _66F ___ Mar 31 ___ eventual record high minimum [monthly max] __ broke 1986 (60F), also 1962,81 (57F) _58F ___ Apr 30 ___ warmest recent (1980-2025) __ warmest since 1942,74 (60F) and eventual record 1903 (63F) _75F ___ Aug 24 ___ warmest recent (1980-2025) tied 2020 __ warmest since eventual record 1891 (76F) _76F ___ Aug 25 ___ eventual record high minimum tied 1961 __ broke 1891,98 (75F), also 1979 (75F) _53F ___ Dec 3 ____ eventual record high minimum __ broke 1982 (51F), also 1970, 2009, 2012 (49F) _59F ___ Dec 4 ____ eventual record high minimum __ broke 1982 (58F), also 1948 (48F) _50F ____ Dec 7 ____ warmest recent (1980-2024) __ warmest since eventual records 1951,56 (53F) _46F ____ Dec 20 ___ warmest recent (1980-2024) __ warmest since eventual record 1957 (54F) ___________________________________________________________________________________________________ 1999 __ The main weather event of 1999 was its hot summer which set several records. The year set eight records, two were four-way ties when 1999 joined, two were ordinary ties then, and of the six surviving records, one was a four-way tie, two were later tied (in 2010 and 2018), another was already a tie with 1895 and was later joined by 2002. That reduced the count of these six survivors to 3.58 (it was 4.75 in its contribution to the 1999 count). That makes the current survival rate 59.7%. Only 2004 and 2014 with no records to survive have a lower percentage after 1999. The eight 1999 records broke existing values by an average of 2.25 F deg and the two broken were surpassed in Dec 2001 and July 2010 for an average of March 2006; this becomes 2018 if the six surviving records fall between now and next February. The two broken already have been surpassed by an average of 4.5 F deg, which reduces to 1.1 F deg for all eight counting the survivors. In addition to its records, June 7th (94F) and June 8th (93F) were each two degrees short of tying 1925 and 1933 records. July 16th to 19th had highs in the 97-98F range but none were records, also between two records in late July were two more mid-90F days, and August 1st at 98F missed by two degrees. The average maximum for the period June 26th to August 7th was 89.9 deg F. 72F on Nov 10th was one degree short of the 1985 record (now two lower than 2020). There were no surviving record low maxima although 64F on Aug 21st was the lowest for that date until 59F in 2007 and would be a record for Aug 19th-20th or 22nd. There is one surviving record low minimum for 1999, 39F on Oct 7th (tied 1954, count 0.50). There were three end-of-data record high minima, including 46F Feb 3rd (tied 2006), , 82F July 5th, 83F July 6th, for a count of 2.50, from an original count of 6.0 during the year. 43F on Feb 10th fell to 45F in 2023. 79F on July 4th was a record but fell to 81F in 2002. Another 79F on July 24th fell in 2012 (80F). 79F on July 18th had been outdone in 1900 (81F) and 79F on Aug 1st had already been beaten by 82F in 1917. The average minimum for the same interval mentioned above (June 26th to Aug 7th) was 72.4 making the mean temperature for that six-week interval 81.2F. The July mean of 81.4F is the highest monthly mean for NYC. Temp ___ date ___ replaces _ ties ______ broken ___ eventual end of data record max, recent max _62F ___ Feb 12 __ eventual record later tied by 2018 .. (1966 3rd (58F), 1984,2009 t-4th (57F), 1932 6th (56F), 1877,80,1940.98 t-7th (54F)). _101F __ July 5 __ eventual record .. (2010 2nd (99F), 1919,55 t-3rd (98F), 1911 5th (97F), 1949,90,2012 t-6th (95F)) _101F ___ July 6 __ 1911,86 (98F) _______ 2010 (103F) _ 2010 (103F) __ (1999 2nd (101F), 1911,86 t-3rd (98F), 2020 5th (96F), 1908 6th (95F)). _ 97F ___ July 24 ___ eventual record later tied by 2010 .. (1910,33,87,2016 t-3rd (94F), 1929,44 t-7th (93F)). _ 99F ___ July 25 ___ eventual record .. (1987 2nd (95F), 1873,85,1944,2001 t3rd (94F), 1870,92,1930,39,2010,16 t7th (93F)). _ 98F ___ July 28 __ eventual record tied by 1892, 1931, 1949 .. (5th warmest 1983 (96F), t6th 1929, 1963, 2015,16 (95F)) _63F ___ Dec 5 _______ 1916,82,98 (63F) _ 2001 (70F) _ 2001 (70F) _ (1916,82,98,99 t-2nd (63F), 1960,94 t6rh (62F), 1973,2017 t-8th (61F)). _60F ___ Dec 20 ___ eventual record tied by 1895 and later by 2002 .. (1877, 1957 t-4th (59F), 1988 6th (56F), 1936 7th (55F)). Record high minima (6.0), end of data 2.5 survived _40F ____ Feb 2 ____ warmest recent (1980-2024) __ warmest since 1970 (41F) and eventual record 1952 (42F) _46F ___ Feb 3 ____ eventual record high minimum later tied by 2006 __ broke 1983 (45F), also 2012 (42F) _43F ___ Feb 10 __ 1960 (41F) ___________ 2023 (45F) __ 2023 (45F) __ also 2020 (42F), 1876,81,93,1925,56 (39F) _74F ____ June 2 ___ warmest recent (1980-2025) __ warmest since eventual records 1895,1918 (76F) _75F ____ June 27 __ warmest recent (1980-2025) __ warmest since eventual record 1943 (76F) _79F ___ July 4 ___ 1876,1908,74,83 (77F) ___ 2002 (81F) __ 2002 (81F) _82F ___ July 5 ___ eventual record high minimum __ broke 1908 (80F), also 1883,1896,1919 (78F) _83F ___ July 6 ___ eventual record high minimum __ broke 1908 (81F), also 2010 (81F) _79F ___ July 24 __ 1870,1972 (78F) ______ 2010 (80F) __ 2010 (80F) __ also 2011 (78F) _77F ___ July 25 ___ warmest recent (1980-2024) tied 1987, 1995, 2001 __ warmest since 1910 (79F) and eventual record 1885 (80F) _75F ___ July 31 __ warmest recent (1980-2024) tied 1983, 1988, 1995, 2008 (75F) since 1933 (78F) and eventual record 1917 (82F) _79F ___ Aug 1 ___ warmest recent (1980-2024) tied 2006 __ warmest since eventual record 1917 (82F) ______________________________________________________ 2000 __ The year 2000 had a mild winter to start, occasional warmth in the spring, a rather cool summer and autumn, with one further mild spell in December producing a total of five records (count 4.50) of which four (count 3.50) have survived (survival rate 77.8%). These five records broke existing values by an average of 2.2 F deg. The one which has been surpassed was beaten in 2016 by 6 F and that would reduce to 1.2 F counting the four surviving records. The average date (Mar 9th, 2016) changes to 2021 if the four surviving records were broken in the next year (by edit this would be Dec 2022 to May 2023). There were five surviving low maximum records, three of them ties, 51F (May 20th) tied 1957, 69F (July 19th), 69F (July 26th) tied 1901 and 68F (July 27th) tied 1897 and 54F (Sep 26th). The count was 3.50. There were no record low minima, but numerous close calls, with five readings within 1 deg of a record value -- 37F April 27th (36F in 1932); 52F Sept 5th (51F 1963); 43F Sept 29th (three tied at 42F); 38F and 36F Oct 9th-10th (records 37F 1888 t1988 and 35F 1888), and these played a role (with some ties) in the count of 6.33 for eight occasions with lowest minimum since a previous record. There were four record high minima 51F (Jan 3rd), 48F (Mar 9th), 70F (May 8th) 74F (May 9th), count 4.00. There were also quite a few "warmest of recent past" values following distant records such as two in May 1930 before the two records noted in the previous comment. All of the notable high minima for 2000 came in the warmer first half of the year. Temp ___ date ___ replaces _ ties ______ broken ___ eventual end of data record max, recent max _64F __ Jan 3 ___ eventual record .. 1950 3rd (60F), 1913,51 t-4th (59F), 1876, 2004,05 t-6th (58F). _71F __ Mar 9 ___ 1921,77 (66F) ______ 2016 (77F) _ 2016 (77F) _ (2020 2nd (72F), 2000 3rd (71F), 1921,77 t-4th (66F), 1913,73,2002 t-6th (65F)). _93F ___ May 7 ___ eventual record .. (1939 2nd (92F), 1930 3rd (91F), 1943 4th (88F), 1876 5th (87F)). _91F ___ May 8 ___ eventual record tied by 1936 .. (1943 3rd (89F), 1964 4th (87F), 1872,1930,1963 t5th (85F)). _62F ___ Dec 17 ___ eventual record .. (1984 2nd (61F), 1928 3rd (60F), 2015 4th (59F), 1992,96 t-5th (58F).). Record high minima (4.0), end of data count 4.0 _51F __ Jan 3 ___ eventual record high minimum __ also 2005 (49F), 2000 broke 1998 (46F), also 1950,1997 (43F) _44F __ Jan 10 ___ warmest recent (1980-2025) __ tied 2024, warmest since 1972 (45F), record 1935 (47F) _48F __ Mar 9 ___ eventual record high minimum __ broke 1921 (47F), also 2017,2020 (47F) _48F __ Mar 24 __ warmest recent (1980-2025) __ warmest since 1979 (51F), eventual record 1903 (52F) _50F __ Mar 25 __ warmest recent (1980-2025) tied 1928, 1987 __ warmest since eventual record 1913 (61F) _68F __ May 6 ___ warmest recent (1980-2025) tied 1934 __ warmest since eventual record 1930 (71F) _61F __ May 7 ___ warmest recent (1980-2025) __ warmest since eventual records 1918, 1930 (70F) _70F __ May 8 ___ eventual record high minimum __ broke 1930 (69F), also 1872, 1895 (66F) _74F __ May 9 ___ eventual record high minimum __ broke 1964 (71F), also 1895 (69F) _72F __ June 17 __ warmest recent (1980-2025) tied 2004 __ warmest since 1967 (74F), eventual record 1957 (77F) ______________________________________ decade of 2001 to 2010 ____________________________________________ Although 2001 was the most productive year for total surviving records (9.17) and total records vs random expectation (468%) the rest of this decade settled into a more pedestrian pace and the total count for the ten years was 37.83 records (about 28 could have been expected at random) with 31.33 of them surviving (or only 6.5 fell to later years, actually three fell within the decade and three others in the next decade with one also being tied then). These 44 records (including ties) were set on 42 different dates, with 11 of them being ties of previous records (four became three-way ties) for a decade count of 35.83 (duplications where one year breaks another year's record within the decade account for the 2.00 surplus in the total count). 2004 became the third year not to set any new records. The decade was even less productive than the 1991-2000 decade in setting only a total of 1.67 daily minimum records, with six years setting no new low minimum values. 2001 __ This year had warm weather quite frequently and set 14 new records, of which 11 survived. During 2001, one record was a three-way tie (with 1962,73) and another was an ordinary tie with 1990, later joined by 2023, for a count of 12.83, highest since 1949. One of the surviving records added a tie in 2018 so that the 11 survivors now have a count of 9.17 (they counted 9.83 for 2001). The record count was 468% of random expectation (2.74) which is highest of the data set. So was the surviving count of 9.17 for a survival rate of 71.6%. These 14 record highs increased previous values by an average of 2.3 F deg. The three eventually broken fell in 2006, 2008 and 2018 for an average of 2011, but if the other eleven were surpassed in the next year, that would become mid-2019. The three that have fallen were surpassed by an average of 2.7 F deg, counting the survivors that falls off to 0.6 F deg. 99F on Aug 7th did not add a record to the list because it went up against monthly maximum 104F from 1918. There were no record low maxima in 2001. The closest call was 37F on March 26th (three tied at 35F). 55F on Sept 30th was three higher than the 1888 record. There was one tied record low minimum value of 56F on July 2nd (tied 1888). (count 0.50) ... A high minimum of 82F tied 1896 (Aug 9th), and was joined by three more records set in December, 52F on Dec 1st, 58F on Dec 6th and 53F on 14th (tied 1901, later tied by 2015) for a total count of 2.83. This was 6.5 at the end of the year, several record high minima in May were later eclipsed. With the exceptions of 2003 and 2004 with no record high minima, this was the last year in the series to preserve less than half of its record high minima (43.5 per cent). Temp ___ date ___ replaces _ ties ______ broken ___ eventual end of data record max, recent max _61F ___ Feb 10 __ eventual record tied by 1990, 2023 .. (1949 2nd (60F), 1898, 2001 t-3rd (58F), 1955 5th (57F), 1909 6th (56F), 2002 7th (55F)). _86F ___ Apr 22 __ eventual record tied by 1962, 1973 .. (1977,85 t-4th (85F), 1902 6th (84F), 1926,2004 t-7th (82F)). _87F ___ Apr 24 __ eventual record .. (1886 2nd (83F), 1881,1957,1992 t-3rd (81F), 1942,1994,2001 t-6th (80F)). _87F ___ May 1 ___ eventual record .. (2010 2nd (85F), 1899,1985 t-3rd (84F), 1944,90 t-5th (83F), 1894,1957,1993 t-7 (82F)). _90F ___ May 2 ___ eventual record later tied by 2018 .. (1913 2nd (89F), 2010 3rd (88F), 1899,1930,1992 t-4th (86F), 1894 7th (85F), 1884 8th (84F)). _90F ___ May 3 ___ 1913 (89F) ________ 2018 (92F) _ 2018 (92F) __ (2001 2nd (90F), 1913 3rd (89F), 1878,1969 t-4th (84F), 1880,1942 t-6th (82F)). _92F ___ May 4 ___ eventual record .. (1965 2nd (90F), 1963 3rd (86F), 1944, 2015 t-4th (85F), 2018 6th (84F), 1942,49 t-5th (83F)) _ 99F ___ Aug 8 ___ eventual record .. (1980 2nd (96F), 1896,1941,1983 t3rd (95F), 1916,18,79 t6 (94F)) _103F __ Aug 9 ___ eventual record .. (1949 2nd (100F), 1896 3rd (98F), 1941 4th (97F), 1924 5th (96F), 1980 6th (95F)). _79F __ Oct 24 ___ eventual record .. (1900,46,63 t-2nd (77F), 1973 5th (76F), 1940,72, 2017 t6th (74F)). _69F ___ Dec 1 ____ 1927,62 (68F) ______ 2006 (70F) _ 2006 (70F) __ (2001 2nd (69F), 1927,62 t-3rd (68F), 1991 5th (66F), 2014 6th (65F), 1908,34 t-7th (64F)). _70F ___ Dec 5 ___ eventual record .. (1916,82,98,99 t-2nd (63F), 1960,94 t6rh (62F), 1973,2017 t-8th (61F), 1941,51,2013 t-10 (60F)). _71F ___ Dec 6 ___ eventual record .. (1982 2nd (68F), 1998 3rd (66F), 1912,60 t-4th (64F), 1951,53,94 t-6th (63F)) _63F ___ Dec 15 __ 1918 (61F) _________ 2008 (67F) _ 2015 (68F) _ (2008 2nd (67F), 2001 3rd (63F), 1918 4th (61F), 1901,75 t-5th (60F), 2011 7th (59F)). Record high minima (6.5), end of data count 2.83 survived _59F ___ Apr 23 ___ warmest recent (1980-2023) __ warmest since eventual record 1926 (60F) _63F __ May 1 ___ 1891 (62F) __________ 2010 (64F) __ 2010 (64F) __ also 1936 (61F), 1899, 1983 (60F) _66F ___ May 2 ___ warmest recent (1980-2025) tied 2010 __ warmest since eventual record 1913 (67F) _68F __ May 3 ___ 1913 (67F) __________ 2018 (70F) __ 2018 (70F) __ also 2010 (67F) _71F __ May 4 ___ 1942 (68F) __________ 2018 (72F) __ 2018 (72F) __ also 1878 (65F), 1895,2010 (62F) _77F ___ July 25 ___ warmest recent (1980-2024) tied 1987, 1995, 1999 __ warmest since 1910 (79F) and eventual record 1885 (80F) _78F ___ Aug 7 ___ warmest recent (1980-2024) __ warmest since eventual record 1918 (82F) _82F __ Aug 9 ___ eventual record high minimum tied 1896 __ also 1980 (80F) _59F ___ Nov 25 ___ warmest recent (1980-2024) __ warmest since eventual record 1979 (62F) _56F __ Nov 30 _________ 1934 (56F) __ 2006 (58F) __ 2006 (58F) __ also 1927,33,98,2016,20 (50F) _52F __ Dec 1 ___ eventual record high minimum __ broke 1991 (50F), also 1998,2006 (49F), 1982 (48F) _58F __ Dec 6 ___ eventual record high minimum __ broke 1982 (57F), also 2011 (56F), 1993,94 (54F) _53F __ Dec 14 __ eventual record high minimum tied 1901, later 2015 __ also 1983 (47F) __________________________________________________________________ 2002 __ April 2002 duplicated the remarkable heat of mid-April 1976 and the two years have had to share some records or lose to the other when there were no other years even close at that time. August had a fairly warm spell but otherwise the year was rather average most of the time and the total number of records was seven for a count of 5.00 as three were three-way ties with earlier years. Of these seven, six have survived and their count is 4.00 for a survival rate of 80.0%. The seven records averaged 3.7 F deg higher than previous marks (Jan 29th was 14 degrees higher than its previous record value). Only one 2002 record has since fallen, that being Aug 13th which was edged out by one degree (99F) by 2005. If the other six records were broken in the next year, that would become an average of (late) 2019. In August, before and after one of three records were set, two other days (12th, 14th) at 96F and 95F failed to break those daily records from earlier years (97F, 99F). The middle of these three days lost its 98F record to 99F in 2005. Meanwhile, 2002 set no daily low maximum records. May 18th (55F) was within two degrees of the 1881 record, and 71F on July 26th was also two higher than the date record (69F tied 1901, 2000) also 65F on Aug 29th within two of the record (63F 1903). There was one record low minimum, a tied 43F on May 20th with 1907. 41F the previous night and 43F before that had been edged out already by 1973 (41F 18th) and 1976 (38F 19th). Then May 21st at 42F was beaten by 1907 at 40F. It is quite unusual for four consecutive nights to be this close to record values in recent times. The count was 0.50. 2002 had ten record high minima, including two ties for a count of 9.00 ... these include 46F Jan 28th (tied by 2018) and 50F Jan 29th, 69F Apr 16th, 74F Apr 17th and 76F Apr 18th (an April monthly record), 82F July 3rd, 81F July 4th, 79F July 29th (tied 1895) and 80F July 30th, and 78F Aug 28th. Feb 16th (44F) recently was replacced by 2023 (56F). Also 80F Aug 13th, 78F Aug 14th lost out to warmer values from 1908 and 60F on Nov 11th was broken by 64F in 2020. The count during 2002 was 12.0, both the count and surviving total are surpassed only by 2015 and 2017 in later years. It should be noted that 2002 had an annual minimum of only 19F, the highest in the 153 years. Temp ___ date ___ replaces _ ties ______ broken ___ eventual end of data record max, recent max _69F ___ Jan 29 ___ eventual record .. (1975 2nd (55F), 1887,1950,2006 t3rd (53F), 1876,1924,1989 t-6th (52F)). _92F ___ Apr 16 ___ eventual record .. (2003,12 t-2nd (88F), 1896, 2017 t-4th (87F), 1976 6th (82F), 1941 7th (80F) 1912,59 t-8th (77F)). _96F ___ Apr 17 ___ eventual record .. (1976 2nd (91F), 1896 3rd (88F), 1959 4th (80F), 2004 5th (78F), 2005 6th (77F)), [Apr monthly max tied by 1976] _98F ___ Aug 13 ___ 1881,1944,1988 (95F) ___2005 (99F) __ 2005 (99F) __ (1881,1944,1988,2016 t-3rd (96F), 1947 7th (95F)). _94F ___ Aug 18 ___ eventual record tied by 1913 and 1987 .. (1956,1995 t-4th (92F), 1872,1922,1937,1966 t-6th (91F)). _94F ___ Aug 19 ___ eventual record tied by 1914 and 1966 .. (1872, 1978 t-4th (92F), 1947, 2010 t-6th (91F)). _60F ___ Dec 20 ___ eventual record tied by 1895 and 1999 .. (1877, 1957 t-4th (59F), 1988 6th (56F), 1936 7th (55F)) Record high minima (12.0), end of data 9.0 survived _42F __ Jan 23 ___ warmest recent (1980-2025) _ warmest since 1967 (45F), eventual record 1906 (50F) _45F __ Jan 24 ___ warmest recent (1980-2025) _ warmest since eventual record 1967 (54F) _41F __ Jan 27 ___ warmest recent (1980-2025) _ warmest since 1952,74 (45F), record 1916 (53F) _broken 2024 _46F __ Jan 28 __ eventual record high minimum later tied 2018 __ broke 1974 (44F), also 1947 (42F) _50F __ Jan 29 __ eventual record high minimum __ broke 1970 (42F), later 2006 (44F) _44F __ Feb 16 __ 1954,76,82,84 (43F) ___ 2023 (56F) __ 2023 (56F) __ also 42F (1882) _50F __ Feb 21 ___________ 1930 (50F) __ 2018 (55F) __ 2018 (55F) __ also 1981 (47F), 1996 (46F), 1913 (44F) _59F ___ Apr 15 ___ warmest recent (1980-2025) _ warmest since 1960 (62F), eventual record 1941 (67F) _69F __ Apr 16 __ eventual record high minimum __ broke 1941 (64F), also 2012 (65F), 1896 (63F) _74F __ Apr 17 __ eventual record high minimum __ broke 1976 (66F), also 2012 (61F) _76F __ Apr 18 __ eventual record high minimum [monthly max] __ broke 1976 (70F), also 1973 (61F) _74F __ June 25 ___ warmest recent (1980-2024) tied 1980, after record of 1909 (78F) and 1952 (75F) ... ... ... this was terminated in 2025 by new record set in 2025 (81F) _82F __ July 3 ___ eventual record high minimum __ broke 1876 (81F), also 1983 (78F) _81F __ July 4 ___ eventual record high minimum __ broke 1999 (79F), also 1876,1908,1974,1983 (78F) _79F __ July 29 ___ eventual record high minimum tied 1995 __ broke 1892,1898 (77F), also 2015 (78F) _80F __ July 30 __ eventual record high minimum __ broke 1988 (79F), also 1898,1917,2019 (78F) _78F __ Aug 18 __ eventual record high minimum __ broke 1987 (76F), also 1955 (75F) _60F __ Nov 11 ___ 1970 (57F) __________ 2020 (64F) __ 2020 (64F) __ also 1935 (56F) _____________________________________________________________ 2003 __ Although the summer of 2003 turned very hot in Europe, little of that was seen in eastern North America, in fact the entire year was rather cold at times, with just one record set at NYC, on November 3rd. This was 1 F deg higher than the previous mark set in 1990, so by quite a large margin 2003 has the shallowest roots in the record soil so to speak, other than the four years with no records at all. This record has survived so 2003 becomes the fourth year in the study to have a 100% survival rate after 1981, 1994, and 1995. If this record falls in 2021, the year will become the fifth year with no surviving records. Besides Nov 3rd, the closest temperature in 2003 to record values was 93F on June 24th (96F 1888), followed by 88F on Apr 16th (just established as a record of 92F in 2002, otherwise this would have broken the previous record which was 87F from 1896). 37F on Apr 8th and 39F on Apr 9th both became three-way ties for record low maxima and 63F on June 21st tied 1958 (count 1.17). There were almost no record low minima in 2003, with the final part of the six-way tie for March 3rd (11F), for a count of 0.17, the lowest of any year (there were 33 of them) not entirely shut out of any share in eventual records. The closest value to add to that meagre outcome was 50F on both June 2nd and 4th (records 48F both dates) and also 53F June 17th (record 51F 1926). No record high minimum was set either. The closest values to current records (as they were in 2003) are three days within 2F of records. Those three are 79F on June 26th (record 1952, 81F), 76F on Aug 22nd, (record 1906, 78F) and 55F on Nov 20th (record 1906, 2015 is 57F). As with previous years that failed to set new record high minima, I have compared 2003 to starter years and found that, similar to 1994, it would have ranked near middle of that era, with 18 records set, and a count of 14.17. Those are listed below the record high maximum. Of these, two of the three noted above for a 2F differential from eventual records also managed to become "warmest of recent era" (1980-2022) and those are noted below the list. Temp ___ date ___ replaces _ ties ______ broken ___ eventual end of data record max, recent max _79F ___ Nov 3 ___ eventual record .. (1990 2nd (78F), 1936 3rd (75F), 1974,1982,2017 t4 (74F), 1953 6th (73F)). No record high minima were established, so none have survived. These eighteen records (count 14.17) would have been set had 2003 been in the starter era. The extinction date is Nov 28, 1990. Like 1994, 2003 would have been picked apart in the 1902-08 period and the count by 1910 was only 6.83. _44F ___ Mar 16 ___ broke 1898, 1902 (41F) and 1921 (43F) __ broken by 1945 (49F). Eventual record high minimum 1990 (55F) _48F ___ Mar 17 ___ broke 1898 (45F) ___ broken by 1936 (50F). Eventual record high minimum 1990 (53F) _43F ___ Mar 18 ___ broke 1874 (42F) ___ broken by 1903 (46F). Record by 2003 was 48F (1927,90). Eventual record high minimum 2011 (51F) _50F ___ Mar 21 ___ broke 1890,94 (42F) ___ broken by 1903 (55F) still record value in 2003. Eventual record high minimum 2012 (57F) _51F ___ Mar 22 ___ broke 1894 (45F), also 1903,18 (46F) __ broken 1929 (52F). Eventual record high minimum 1948 (57F) _43F ___ Mar 25 ___ broke 1884 (40F), also 1903 (41F) __ broken 1905 (45F). Eventual record high minimum 1913 (61F) _52F ___ Mar 29 ___ broke 1898 (47F), also 1902 (50F) __ broken 1907 (58F). Eventual record high minimum 1998 (62F) _59F ___ Apr 29 ___ tied 1888, 1941 (59F) __ broken 1956,83 (63F), records in 2003. Eventual record high minimum 2017 (64F) _79F ___ June 26 ___ broke 1880 (77F), also 1904,43 (78F) __ broken 1952 (81F) _75F ___ July 8 ___ tied 1876,1900,1921 (75F) __ broken 1929,1981,1986 (77F). Eventual record high minimum 1993 (80F). _75F ___ Aug 14 ___ tied 1872 (75F) ___ broken 1908 (84F) eventual record high minimum. _76F ___ Aug 22 ___ broke 1885,91,99 (75F) __ broken 1906 (78F) eventual record high minimum. _69F ___ Sep 14 ___ tied 1889 (69F) ___ broken 1903 (72F). Eventual record high minimum 1947 (74F) _59F ___ Oct 26 ___ tied 1899 (59F) ___ broken 1908 (66F) eventual record high minimum. _60F ___ Nov 3 ___ broke 1886, 1909, 1935 (53F) ___ broken 1936 (64F) eventual record high minimum. _50F ___ Nov 12 ___ tied 1879,1882 (50F) __ broken 1902 (52F). Eventual record high minimum 1912,35 (56F) _55F ___ Nov 20 ___ tied 1900 __ broken 1906 (57F) which as eventual record high minimum later tied in 2015. _51F ___ Nov 28 ___ broke five tied at 44F and then three tied at 50F (to 1937), tied 1973 (51F) __ broken 1990 (55F), record in 2003. Eventual record high minimum 2011 (56F) These two values were also warmest of recent period 1980-2022: _79F ___ June 26 ___ warmest recent (1980-2025) _ warmest since 1952 (81F) eventual record high minimum _76F ___ Aug 22 ___ warmest recent (1980-2024) _ warmest since 1942 (77F), 1906 (78F) eventual record high minimum __________________________________________________________________________________ 2004 __ This becomes the third year that failed to set any new record highs. The closest calls were 86F on May 13th and 87F on May 15th which were both 3 F below the existing records of 89F (1956) and 90F (1900). 67F on Mar 2nd was five degrees below the 1972 record, and 63F on Mar 6th missed the 1935 record by 5 F also. Three of these four would have been starter era records (not May 15th as 1900 is in the starter era), as well as the following: Jan 3rd-4th (both 58F, tied 1876, 1874), 57F (Feb 28th), 63F Mar 1st, 63F Mar 6th, 58F Mar 15th, 70F Mar 27th, 67F Apr 7th, 85F Apr 19th, 82F Apr 22nd, 84F May 22nd (tied 1886), 87F May 23rd, 91F June 9th (tied 1889), 90F Aug 28th (tied 1886), 84F Sep 13th, 65F Nov 25th, and 59F Dec 8th, for a total count of 17.50; that would have ranked 2004 fourth in the starter era behind 1895 and 1896, and 1900, just ahead of 1879. If 2004 had been a starter year, its extinction date would have been Nov 25th, 1979 (2004 would have tied 1973). (If non-record producer 2014 had also been a starter year, 2004 would not have held the Nov 25th record and would have been extinct on Mar 2nd, 1972.) There were also one tied record low maximum temperature in 2004, 17F on Jan 14th (tied 1893, 1988). The count was 0.33. A reading of 1 F on Jan 16th tied 1893 for the low minimum and no other records occurred so the count is 0.50. There were also no high minimum records, the last such occasion, and 2004 overall is the least record-productive year in all four categories combined. 47F on Mar 3rd was within one of the 1991 record but is now two short of the 2020 mark (49F). 63F on May 16th was 1F short of the 1881 record, later tied in 1991 (64F). 76F on Aug 20 had been 1F behind 1906 and 1983, and 2015 joined that tie later (77F). 2004 was not quite as productive as either 1994 or 2003 in breaking starter era records, the count was 11.25 for fourteen records including five ties. (no record high maxima in 2004) No record high minima were established, so none have survived. These fourteen records (count 11.25) would have been set had 2004 been in the starter era. The extinction date is Jan 3, 1998. _44F ___ Jan 3 ___ broke 1876, 1897 (41F) and 1950,97 (43F) __ broken by 1998 (46F). Eventual record high minimum 2000 (51F) _45F ___ Mar 1 __ broke 1895 (42F) __ broken by 1902 (49F) which was record in 2004. Eventual record high minimum 2017 (54F) _47F ___ Mar 3 __ tied 1878 (47F) ___ broken by 1991 (48F) which was record in 2004. Eventual record high minimum 2020 (49F) _43F ___ Mar 15 __ broke 1878 (37F), tied 1903 (43F) __ broken by 1908 (44F). Eventual record high minimum 1913,2019 (49F) _44F ___ Mar 25 __ broke 1884 (40F), and 1903 (41F) __ broken by 1905 (45F). Eventual record high minimum 1913 (61F) _51F ___ Mar 27 __ broke 1869 (48F), tied 1905 (51F) __ broken by 1908 (58F). Eventual record high minimum 1949 (61F) _56F ___ Apr 30 __ broke 1879,99 (55F) __ broken by 1903 (63F) eventual record high minimum _65F ___ May 12 __ broke 1869,81,97 (63F), tied 1908 (65F) __ broken by 1959 (67F) eventual record high minimum _70F ___ June 9 __ tied 1876,82,98 (70F) __ broken by 1922 (72F). Eventual record high minimum 1984 (77F) _75F ___ Aug 2 ___ tied 1879 (75F) __ broken by 1933 (80F) record in 2004. Eventual record high minimum 2006 (83F) _76F ___ Aug 20 ___ tied 1899 (76F) __ broken by 1906 (77F) later tied 1983, 2015 (77F) as eventual record high minima. _74F ___ Aug 30 ___ tied 1900 (74F) __ broken by 1928 (75F). Eventual record high minimum 1973, 2018 (78F) _51F ___ Nov 24 ___ broke 1896,1908 (49F) __ broken by 1931 (54F). Eventual record high minimum 1979 (61F) _45F ___ Nov 28 ___ broke sev'l (44F) ___ broken by 1911,35,37 (50F). Record by 2004 was 55F (1990). Eventual record high minimum 2011 (56F) These four values were also warmest of recent period 1980-2022 (none of these were starter era record breakers): _44F __ Mar 5 ___ warmest recent (1980-2025) ___ warmest since 1979 (50F), eventual record high minimum _72F __ June 17 __ warmest recent (1980-2025) tied 2000 __ warmest since 1967 (74F), eventual record 1957 (77F) _46F __ Dec 8 ___ warmest recent (1980-2024) since 1974 (49F) and eventual record high minimum 1951 (52F) _42F _ Dec 9 ___ warmest recent (1980-2024) tied 1991,2012,2019 __ warmest since 1972 (45F), eventual record 1966 (54F) ______________________________________________________________________________ 2005 __ Record highs resumed after quite a long delay between Nov 2003 and Aug 2005, in fact going back to the end of 2002, an interval of 31 months only had the one record high (Nov 3, 2003). A hot spell in August 2005 set two records, which have both survived, for a count of 2.00 and a survival rate of 100%. These two broke previous values by an average of 2.0F. Aug 12th at 96F was only one degree lower than the 1944 record. 92F on Sep 13th was two degrees below the 1952 record. 68F on Nov 16th fell four short of the 1928 record. There was also one record low maximum in 2005, 66F on July 8th. There were no record low minima, and the closest call was 22F on Nov 25th (within three of the 1938 record 19F). The year managed seven high minimum records, 46F on Feb 9th, 78F on June 14th, and 78F on Aug 4th (tied 1908), 75F Sep 15th (tied 1931), 73F Sep 16th (tied 1903), 70F Oct 7th, and 58F Nov 29th, for a count of 5.50. Temp ___ date ___ replaces _ ties ______ broken ___ eventual end of data record max, recent max _97F ___ Aug 3 ____ eventual record .. 1926,36,75,2006 t2nd (96F)), 1957 6th (95F), 1930,93 t7th (94F)). _99F ___ Aug 13 ___ eventual record .. (1881,1944,1988,2016 t-3rd (96F), 1947 7th (95F), 1908,70 t-8th (94F)). Record high minima (6.25), end of data 5.5 survived _40F ___ Feb 8 ____ warmest recent (1980-2024) tied 1991 __ warmest since eventual record 1965 (48F) _46F __ Feb 9 ____ eventual record high minimum ___ broke 1990 (45F), also 1956 (40F) _64F ___ Apr 20 ____ warmest recent (1980-2025) __ warmest since eventual record 1976 (67F) _72F __ June 12 ______ 1942,73,97 (72F) _ 2015 (73F) __ 2017 (76F) _75F __ June 13 ___________ 1961 (75F) __ 2017 (77F) __ 2017 (77F) _78F __ June 14 ___ eventual record high minimum ___ broke 1956 (76F), also 1899, 1983 (73F) _78F __ Aug 4 ____ eventual record high minimum tied 1908 ___ also 1906,79,83,95,2002 (77F) _79F ___ Aug 5 ____ warmest recent (1980-2024) tied 1930 __ warmest since eventual record 1908 (81F) _76F __ Aug 21 __ warmest recent (1980-2024) __ warmest since 1937 (77F), eventual record 1906 (78F) _71F __ Sep 13 __ warmest recent (1980-2024) __ warmest since 1961 (74F), eventual record 1890 (75F) _75F __ Sep 15 ___ eventual record high minimum tied 1931 ___ broke 1915 (74F) _73F __ Sep 16 ___ eventual record high minimum tied 1903 ___ also 1889,1915,30 (72F) _70F __ Oct 7 ___ eventual record high minimum ___ also 2007, 18 (67F), broke 1955 (66F), also 2017 (66F) _58F __ Nov 28 ___ eventual record high minimum ___ broke 1934 (54F) _________________________________________________________________ 2006 __ While January was quite mild, most of this year came in rather close to average and the record count was 4.5, of which 3.5 have survived, a rate of 72.7%. The average by which 2006 records increased from previous values was 1.6 F deg. The one that has fallen was broken Mar 10th, 2016. If the other four were broken this coming winter (2022-23), that would change to around September 2021. The record was broken by 5 deg, the average including surviving records is therefore 1.0 F deg. Summer heat was brief with 97F on Aug 2nd not quite able to set a record, 96F on 3rd was one degree short of the previous year's new record. There were no record low maxima in 2006. The closest call was four degrees (66F on Sept 2nd vs 62F the 1869 record). The year also set no record low minima. The closest was 45F on May 23rd (within 2 of the record 43F 1963). There were five record high minima including Feb 3rd (46F, tied 1999), Aug 2nd (83F), Aug 3rd (78F tied 1975), Nov 16th (59F) and Nov 30th (58F). (count 4.00). Two other records set have been broken, the count during the year was 5.5. Temp ___ date ___ replaces _ ties ______ broken ___ eventual end of data record max, recent max _61F ___ Jan 20 ___ eventual record tied by 1951 .. (1947 3rd (60F), 1913, 1933 t4th (56F), 1890 6th (55F)) _63F ___ Jan 21 ___ eventual record .. (1913 2nd (60F), 1906 3rd (59F), 1916 4th (57F), 1921 5th (55F), 1951,54,59,74,79 t-6 (54F)). _64F ___ Jan 30 ___ eventual record .. (1947 2nd (63F), 2002 3rd (61F), 1932 4th (60F), 2013 5th (59F), 1914 6th (58F)). _74F __ Mar 10 ___ 1955 (71F) _________ 2016 (79F) __2016 (79F) __ (2006 2nd (74F), 1955 3rd (71F), 1879,1977 t-4th (69F), 1878 6th (68F)). _70F ___Dec 1 ___ eventual record .. (2001 2nd (69F), 1927,62 t-3rd (68F), 1991 5th (66F), 2014 6th (65F), 1908,34 t-7th (64F)) Record high minima (5.5), end of data 4.0 survived _45F __ Jan 12 ___ 1870,1975 (42F) _____ 2017 (47F) __ 2017 (47F) __ also 1908 (41F) _42F ___ Jan 20 ____ warmest recent (1980-2025) tied with 1951, 1991 __ warmest since eventual record 1900 (46F) _46F ___ Feb 3 ____ eventual record high minimum tied 1999 __ broke 1983 (45F), also 2012 (42F) _64F ___ May 5 _____________ 1944 (64F) _ 2015 (66F) __ 2015 (66F) __ also 1949 (63F), 1896 (62F) _79F ___ Aug 1 ____ warmest recent (1980-2024) tied 1999 __ warmest since eventual record 1917 (82F) _83F ___ Aug 2 ___ eventual record high minimum __ broke 1933 (80F), also 1955 (79F) _78F ___ Aug 3 ___ eventual record high minimum tied 1975 __ broke 1926 (77F), also 1995 (77F) _52F ___ Nov 13 ____ warmest recent (1980-2024) __ warmest since 1964 (54F), eventual record 1909 (59F) _59F ___ Nov 16 __ eventual record high minimum __ broke 1892, 1927 (58F), also 1928 (57F) _58F ___ Nov 30 __ eventual record high minimum __ broke 1934, 2001 (56F), also 1927,33,98,2016,20 (50F) ______________________________________________________________ 2007 __ A brief burst of warmth in early January saw the 1950 monthly record of 72F tied (Jan 6th). Otherwise warm spells during the year were quite brief, three records were set in total and all have survived (counts 3.00, survival rate 100%). These three broke records by 9, 1 and 1 deg for an average of 3.7 F deg. The summer was generally cool, with two record low maxima on Aug 21st (59F) also a benchmark and tied with 31st 1911 for August low maximum, and then 65 F on Aug 22nd. Mar 6th-7th had quite cold daytime highs of 21F and 23F, records for those dates were 17F and 20F. October was a warm month with a few records or near-records. There were no record low minima, 13F on Mar 9th was two higher than the 1996 record, and 57F on July 2nd missed by one degree. 2007 managed seven occasions with the coldest reading after a record, with ties the count was 5.5. There were just two surviving record high minima on Jan 5th (53F) and Jan 6th (54F). October was quite warm and had a fifth share of the record for Oct 8th, later broken in 2017, so the count during the year was 2.2. The cold August days had very limited diurnal ranges and missed those minimum records (56F being the lows both days, records 53F and 52F). 1.27" of rain fell on the 21st followed by a two-week dry spell. Temp ___ date ___ replaces _ ties ______ broken ___ eventual end of data record max, recent max _72F ___ Jan 6 ___ eventual record .. (1950 2nd (63F), 1946 3rd (62F), 1929 4th (61F), 1998 5th (59F)) [monthly max tied 1950 25th] _86F ___Apr 23 __ eventual record .. (1996 2nd (85F), 1886,1925 t-3rd (84F), 1902, 1973 t-5th (83F), 1979,90 t-7th (81F), 2001 9th (80F)). _87F ___Oct 8 ___ eventual record .. (1931 2nd (86F), 1916 3rd (84F), 1990 4th (81F), 1881,1900,1922,1944,1982 t-5th (80F)). Record high minima (2.2), end of data 2.0 survived _53F ___ Jan 5 ___ eventual record high minimum __ broke 1909 (49F), also 1950 (48F) _54F ___ Jan 6 ___ eventual record high minimum __ broke 1946 (53F), also 1890 (50F) _45F ___ Jan 13 ___ warmest recent (1980-2025), warmest since 1932 (56F) eventual record high minimum. _61F ___ May 10 ___ warmest recent (1980-2025) tied 2015, warmest since 1979 (71F) eventual record high minimum _71F ___ May 26 ___ tied third warmest but not a record (records 72F 1880 and 2018) _65F ___ Oct 3 ____ warmest recent (1980-2024) tied 1979, warmest since 1954, 1969 eventual records (68F) _69F ___ Oct 4 ___ warmest recent (1980-2024) tied 1986, after 70F (1954) and eventual record 75F (1898) _67F ___ Oct 5 ___ warmest recent (1980-2024), warmest since 1959 (68F), eventual record 75F (1898) _67F ___ Oct 8 _____ 1922,49,82,90 (67F) __ 2017 (72F) __ 2017 (72F) _65F ____ Oct 19 __ warmest recent (1980-2024) tied 2016, warmest since eventual record 1905 (68F) _66F ____ Oct 23 __ warmest recent (1980-2024), warmest since eventual record 1979 (67F) _________________________________________________________________________ 2008 __ Further north this year is recalled for heavy late winter and spring snowfalls, NYC however saw only one six inch snowfall event in late February. The storm track evidently was running just to the north for that interval (which included March-April). The year set five records, two of which tied previous values, for a count of 4.00. Those two tied records plus two others have survived for a count of 3.00 and a survival rate of 75%. The five 2008 records broke previous values by an average of 2.2 F deg. The one record broken fell to Dec 15, 2015. If the other four were broken in the next year, that average would change to about Dec 2021. That record was broken by just one degree so the average counting surviving records is 0.2 F. The 96F record on June 10th was matched the previous day but failed to break the 1933 record of 97F for June 9th. There were no record low maxima or minima in 2008. The closest to a record low maximum was 46F on Oct 29th (three tied at 43F), while the closest to a record low minimum was 59F on Aug 11th (record 56F 1962). There were three record high minima, 53F on Jan 8th, 63F on Apr 24th and 47F on Dec 28th. The count during the year was 4.0, two ties of earlier records have since been broken. The Dec 28 record fell in 2023 (49F). The surviving count is 2.0. Temp ___ date ___ replaces _ ties ______ broken ___ eventual end of data record max, recent max _64F ___ Jan 9 ___ eventual record tied by 1937 .. (1998 3rd (63F), 1930 4th (62F), 2006 5th (60F), 1933,78 t6th (58F)). _68F ___ Feb 6 ___ eventual record .. (1938,1991 t2nd (58F), 1896 4th (57F), 1960 5th (56F), 1909,15 t-6th (55F)). _96F ___ June 10 __ eventual record .. (1974,84 t-2nd (95F), 1959,64,2000 t-4th (92F), 1906,67,73 t-7th (91F)). _67F ___ Dec 15 __ 2001 (63F) ____________ 2015 (68F) _ 2015 (68F) _ (2008 2nd (67F), 2001 3rd (63F), 1918 4th (61F), 1901,75 t-5th (60F), 2011 7th (59F)). _65F ___ Dec 28 __ eventual record tied by 1982 .. (1954 3rd (61F), 2018 4th (60F), 1936,49,88 t-5th (59F), 1984 8th (56F)). Record high minima (4.0), end of data 2.0 survived _53F ___ Jan 8 ___ eventual record high minimum __ broke 1930 (52F), also 1928, 1933 (44F) _47F ____ Jan 9 ____ warmest recent (1980-2025) tied with 1998 __ warmest since eventual record 1937 (50F) _41F ___ Feb 6 ____ warmest recent (1980-2025) tied with 1991 __ warmest since eventual record 1884, 1938 (42F) _45F ___ Mar 4 ___ warmest recent (1980-2025) tied with 2020 __ warmest since eventual record 1880 (51F) ___ since replaced by 46F (2024) _54F ___ Apr 1 ____________ 1986 (54F) __ 2016 (61F) __ 2016 (61F) __ also 2006 (53F), 1948,52,99 (52F) _63F ___ Apr 24 __ eventual record high minimum __ broke 1979 (59F), also 2007 (58F), 1869,1885,1913 (57F) _76F ___ June 9 ___ tied second warmest (with 1933) __ not a record in 2008 (eventual record was 1984, 77F) _75F ___ July 31 __ warmest recent (1980-2024) tied 1983, 1988, 1995, 1999 (75F) since 1933 (78F) record 1917 (82F) _57F ___ Nov 14 __ warmest recent (1980-2024) tied 1961 _ warmest since eventual record 1951 (58F) _48F __ Dec 15 ___________ 1983 (48F) __ 2015 (53F) __ 2015 (53F) __ also 1897 (47F) _47F __ Dec 28 ___ 45F (1881) __________ 2023 (49F) __ 2023 (49F) __ also 1954, 82 (44F) ___________________________________________________________________________________ 2009 __ This year had a notably cool summer by recent standards. The only significant warmth came in late April, and the total record count was 2.0 for three records, two of which were ties of previous records set in 1960 and 1990. This was a survival rate of 100%. The count of 2.0 was below random expectation (2.59), the fourth year in the decade (joining 2003, 2004 and 2005) to go below that mark. These three records broke previous marks by an average of 2.7 F (one being 8 F, the other two ties). There were three record low maximum, 26F (Mar 3rd tied 1943,50), then 46F (Oct 16th) and 45F (Oct 18th) for a count of 2.33. Readings of 47F on 15th and 48F on 17th were both one degree above previous records, so this was quite a significant cold spell. There were no record low minima, with 12F on March 3rd missing the six-way tie (11F) by one degree. Also, 37F on Oct 15th and 16th were higher than 1876 records of 32F and 34F on those dates but this is probably due to the urban heat island difference. There were three record high minima: 51F (Mar 7th, which came just four days after 12F on Mar 3rd failed by one degree to join the often mentioned six-way tie on that date), 67F on Apr 26th and 69F on Apr 28th (tied 1990) which mirrored the outcome of the record highs shown below. That was a count of 2.50. Temp ___ date ___ replaces _ ties ______ broken ___ eventual end of data record max, recent max _65F ___ Feb 11 ___ eventual record tied by 1960 .. (1887 3rd (63F), 2018 4th (62F), 1966,81 t-5th (57F), 1925,55,2002 t7th (55F)), _92F ___ Apr 26 __ eventual record .. (1942 2nd (84F), 1872, 2011 t-3rd (83F), 1970 5th (82F), 1925,69,85 t6th (80F)). _90F ___ Apr 28 __ eventual record tied by 1990 .. (1938,62 t3rd (89F), 1969 5th (86F), 1983,2017 t6 (85F)) Record high minima (2.5), end of data 2.5 survived _45F ___ Feb 11 ___ warmest recent (1980-2025) tied 2018 __ warmest since eventual record 1966 (50F) _44F ___ Feb 12 ___ warmest recent (1980-2025) tied 1984, 1998 _ warmest since 1966 (45F) eventual record _51F ___ Mar 7 ___ eventual record high minimum __ broke 1974 (48F), also 1987 (45F) _67F ___ Apr 26 ___ eventual record high minimum __ broke 1908 (63F), also 1907 (61F) _69F ___ Apr 28 ___ eventual record high minimum tied 1990 __ broke 1935,62,83 (62F). also 2011 (61F) ________________________________________________________________________________________ 2010 __ The winter of 2009-10 produced some heavy snowfalls in the region although it was not particularly cold. Strong blocking in Greenland also produced a very cold January in western Europe. Then again in Dec 2010, wintry conditions returned to NYC at the same time that Britain and Ireland were having a near-record cold month. The spring and summer months were warmer than average at times in NYC. Four records were set, one tying a previous mark from 1999, for counts of 3.50 (records set and surviving) and another 100% survival rate so far. These four records broke previous marks by an average of 1.75 F deg. There were no record low maxima, 20F on Jan 30th was four degrees above the 1934 record. That is when the parade of snowstorms was about to begin. 23F on Dec 14th was within two degrees of the 1902 record but the closest call was 48F on May 12th (within one of 47F 1882). There were also no record low minima for the sixth consecutive year. The closest call was only four degrees from record lows (May 12-13, 44F and 43F) which made 2010 the most widely separated year from the record table so far. The year had five record high minima, Jan 25th (49F), Apr 6th (58F) (although 64F 8th not enough to break 66F 1991), May 1st (64F) (again 66F and 67F next two days fell short by 1 and 3 deg, and later 81F and 80F July 6-7 were slightly below record status (83F 1999 and 84F 1908)). July 24th (80F) was a record though, and 76F on Sep 1st part of a four-way tie (78F next day missing by one to 79F 1898). (count 4.25) from an original total of 5.33. The year had at least shares in fifteen "warmest recent" high minima that were not records. Temp ___ date ___ replaces _ ties ______ broken ___ eventual end of data record max, recent max _ 92F ___ Apr 7 ___ eventual record .. (1929 2nd (89F), 1991 3rd (87F), 1942 4th (82F), 2005 5th (78F), 1908 5th (75F)) [earliest 90F+] _103F __ July 6 ___ eventual record .. (1999 2nd (101F), 1911,86 t-3rd (98F), 2020 5th (96F), 1908 6th (95F), 1900,44,94 t-7th (94F)). _100F __ July 7 ___ eventual record .. (1986,1993 t2nd (98F), 1934,1994,2012 4th (97F)). _ 97F ___ July 24 ___ eventual record tied by 1999 .. (1910,33,87,2016 t-3rd (94F), 1929,44 t-7th (93F)). Record high minima (5.33), end of data 4.25 survived _49F ___ Jan 25 ___ eventual record high minimum __ broke 1990 (45F), also 1967 (43F) _50F ___ Mar 18 ___ 1927,90 (48F) ______ 2011 (51F) __ 2011 (51F) __ also 2022 (50F), 1903,36,45 (46F) _56F ____ Apr 5 ___ warmest recent (1980-2025) tied 1910 _ warmest since eventual record 1892 (60F) _58F ___ Apr 6 ___ eventual record high minimum __ broke 1912,21,48 (55F) _64F __ May 1 ___ eventual record high minimum __ broke 2001 (63F), also 1891 (62F), 1936 (61F), 1899, 1983 (60F) _66F ___ May 2 ___ warmest recent (1980-2025) tied 2001 __ warmest since eventual record 1913 (67F) _72F ___ June 4 ___ warmest recent (1980-2025) __ warmest since eventual record 1943 (78F) _76F ___ June 5 ___ warmest recent (1980-2025) __ warmest since eventual record 1925 (78F) _76F ___ June 24 __ warmest recent (1980-2024) __ warmest since eventual record 1909 (79F) ... ... ... this was terminated in 2025 by new record set in 2025 (81F) _76F ___ June 28 __ warmest recent (1980-2025) tied 1966, 2021 __ warmest since eventual records 1876, 1943 (77F) _80F ___ July 7 ___ warmest recent (1980-2024) __ warmest since eventual record 1908 (84F) _80F ___ July 24 __ eventual record high minimum __ broke 1999 (79F), also 1870,1972,2011 (78F) _78F ___ Aug 10 __ warmest recent (1980-2024) __ warmest since 1949 (79F) and eventual record 1896 (80F) _76F ___ Aug 31 __ warmest recent (1980-2024) tied 2015 __ warmest since eventual record 1953 (78F) _76F ___ Sep 1 __ eventual record high minimum tied 1898, 1980, 2015 __ also 1878,81,1950,53,2013,14 (75F) _78F ___ Sep 2 ___ warmest recent (1980-2024) __ warmest since eventual record 1898 (79F) _70F ___ Sep 28 __ warmest recent (1980-2024) tied 1908,59 __ warmest since eventual record 1891 (72F) _69F ___ Sep 30 ___ warmest recent (1980-2024) tied 1986, after eventual record of 70F in 1959 _63F ___ Oct 26 __ warmest recent (1980-2024) __ warmest since eventual record 1908 (66F) _65F ___ Oct 27 __ warmest recent (1980-2024) __ warmest since eventual record 1908 (66F) _51F ___ Nov 17 __ warmest recent (1980-2024) tied 1963, 2013 __ warmest since 1931,54 (52F), eventual record 1927 (60F) ________________________________________ decade of 2011-20 ____________________________________ Records continue to fall at a somewhat higher pace than random expectation. The decade set a total of 30.33 records while the total for random expectation was 24.75. Of those 30.33 records, 28.83 have survived, since one new mark was broken within the decade and a second tied one was later broken. There were 36 records set, ten being ordinary ties of previous records, and one becoming a three-way tie. These occurred on 34 different dates with the date count 28.83 (which simply indicates that no records set were broken yet in 2021). The decade has only one year that produced more than twice the expected number of records (2015 had 6.5) and one that produced no new ones (2014). The last record set that has since fallen was 66F Jan 12th 2017 (fell to 68F 2020). The only other record set in this decade to fall later was the tied value of 62F (with 1923) on Dec 21st, 2011 that was broken by 65F in 2013. After a ten-year absence of record low minima (Jan 2004 to Jan 2014) the pace picked up slightly in the second half of this decade. 2011 __ This year had a very hot spell in July and produced five records in total, two being ties for a count of 4.0. Of those 3.5 have survived (survival rate of 87.5%). These five broke previous values by an average of 1.0 F deg. The one record broken fell by Dec 2013 which would make the average early 2020 if the other four were broken by next March. As that one fell by three degrees, the average for all five would be 0.6 F. There were no record low maxima set. 45F on Oct 29th during a freakish nor'easter mixed rain-snow event (2.00" precip and 2.9" of that snow on 29th) missed the three-way tie of 43F by two degrees. (the following year Hurricane Sandy would make its run at the coast on the same date). Also there were no record low minima in 2011. Lows of 33F on Oct 29th-30th were both two degrees above the 1925 records. Record high minima included Feb 17th (46F tied 1981) since broken in 2022, Mar 6th (50F), Mar 18th (51F), Apr 27th (61F tied 1949), July 21st (84F, tied July 15th 1995 and July 7th, Aug 14th 1908 values for record high July and all-time high minimum) and July 22nd (83F, warmest two-consecutive night breaking 82F, 84F in Aug 1908), then also Nov 28th (56F). This was a total of seven with two ties for a count of 6.00 which was reduced to 5.5 by 2022. Temp ___ date ___ replaces _ ties ______ broken ___ eventual end of data record max, recent max _77F ___ Mar 18 __ eventual record tied by 1989 .. 1934 3rd (71F), 1969,99 t4 (70F), 1927,2010 t-6th (69F), 1905,45,66 t-8th (67F). _104F __ July 22 __ eventual record .. (1957 2nd (101F), 1926,55 t-3rd (100F), 1918 5th (98F), 1952,61 t-6th (97F)). _100F __ July 23 __ eventual record .. (1955,91 t-2nd (99F), 2016 4th (96F), 1918,52,78 t5th (95F)) _70F ___ Nov 28 __ eventual record .. (1896,1990 t2nd (69F), 1973 4th (68F), 1979,93,94 t5th (66F), 2001 8th (65F), 1984,2015 t-9th (64F)) _62F ___ Dec 21 _____________ 1923 (62F) _ 2013 (65F) __ 2013 (65F) __ (1923 t 2011 t-2nd (62F), 2018 4th (61F), 1990 5th (59F)). Record high minima (6.0), end of data 5.5 survived _46F ___ Feb 17 ___________ 1981 (46F) __ 2022 (49F) __ 2022 (49F) __ also 1891, 1948 (44F) _50F ___ Mar 6 ___ eventual record high minimum __ broke 1979 (49F), also 1894 (46F), 1974 (44F) _51F ___ Mar 18 __ eventual record high minimum __ broke 2010 (50F) later 2022 (50F), also 1927,90 (48F) _61F ___ Apr 27 ___ eventual record high minimum tied 1949 __ also 1869 (60F), 1979,86,2009 (58F) _78F ___ July 12 __ warmest recent (1980-2024) tied 1911, 1993 __ warmest since eventual record 1905 (79F) _84F ___ July 22 ___ eventual record high minimum __ broke 1957 (80F), also 1885, 1926, 1978, 1998 (78F) _83F ___ July 23 ___ eventual record high minimum __ broke 1978 (81F), also 1906, 2016 (80F) _70F ____ Sep 25 ___ warmest recent (1980-2024) tied 2017,25 __ warmest since tied eventual records 1881, 1970 (71F) _56F ___ Nov 28 ___ eventual record high minimum __ broke 1990 (55F), also 2001 (53F), 1973 (51F) _48F ____ Dec 31 ___ warmest recent (1980-2024) tied 2021 __ warmest since eventual record 1965 (51F) _____________________________________________________________________________________________ 2012 __ The most notable weather event was Hurricane Sandy which hit the coast just south of NYC in late October, with a damaging storm surge the main impact on the region. Rainfall at NYC was only 0.84" (heaviest rainfalls some above 7 inches were south of the west to northwest track of the storm across VA, DE, MD, s NJ, PA). Temperatures were near 60F during the height of the storm (which was at cat-2 intensity off the NJ coast but was declared "Storm Sandy" just before hitting the NJ coast near Asbury Park late on Oct 29th. Earlier in the year, after winter 2011-12 essentially went missing (its mildness more sustained than extreme), March 2012 was very mild and set numerous records in the region. NYC may have seen one or two missed due to sea breeze slight cooling, but even so three were set, albeit two tied. This made the count 2.00 for both records set and surviving (100%). They broke one previous record by one degree for an average of 0.33 F deg. Other than the March warmth, the closest that 2012 came to breaking a daily record was 62F on Jan 7th (record 64F 1907). That margin was the same as March 19th (74F vs 1918 record 76F). 88F on Apr 16th was four below the 2002 record. 94F June 20th and 21st came within 4F and 3F of daily records. 97F on July 7th was three short of the recently set 2010 record. 96F and 100F on July 17th-18th came within 4 and 1 deg of 1953 records. A low maximum of 41F on Nov 7th created a four-way tie for a count of 0.25. There were no record low minima, with the closest call being 58F on June 26th (record 56F tied three times most recently 1979). Five high minimum records were set. Four were in the same March warm spell, 54F on Mar 13th, 55F on Mar 19th, 57F on Mar 21st and 58F on Mar 23rd. The 20th and 22nd fell two and one degrees short of records with similar values of 55F, 56F so overall it was a very warm five day interval. The lowest reading from Mar 12th to 25th was 43F. A fifth record was 79F on June 21st, for a count of 5.00. Temp ___ date ___ replaces _ ties ______ broken ___ eventual end of data record max, recent max _71F ___ Mar 12 __ eventual record tied by 1890 .. (2021 3rd (68F), 1929 3rd (67F), 1902 4th (66F), 1977 5th (64F) 1884,99 t-6th (63F)). _78F ___ Mar 22 __ eventual record .. (1929,38 t-2nd (77F), 1948 4th (74F), 1979 5th (73F), 1946 6th (70F), 1918 7th (69F)). _76F ___ Mar 23 __ eventual record tied by 1923 .. (1938 3rd (75F), 1907 5th (72F), 1994,2016 t-5th (71F), 1949,90 t-7th (69F)). Record high minima (5.0), end of data 5.0 survived _46F ___ Jan 7 ____ warmest recent (1980-2025) __ warmest since eventual record 1946 (54F) _54F ___ Mar 13 __ eventual record high minimum __ broke 1898 (52F), also 1953,1977,2006,2016 (50F) _50F ___ Mar 14 ___ warmest recent (1980-2025) __ warmest since eventual record 1953 (51F) _55F ___ Mar 19 __ eventual record high minimum __ broke 1983 (52F), also 1945, 2010, 2022 (49F) _55F ___ Mar 20 ___ warmest recent (1980-2025) __ warmest since eventual record 1948 (57F) _57F ___ Mar 21 __ eventual record high minimum __ broke 1903 (55F), also 1938 (54F) _56F ___ Mar 22 ___ warmest recent (1980-2025) __ warmest since eventual record 1948 (57F) _58F ___ Mar 23 __ eventual record high minimum __ broke 1938 (56F), also 1907 (52F) _63F ___ May 14 ___ warmest recent (1980-2025) tied 1991 __ warmest since 1942,44 (64F), eventual record 1909 (65F) _79F ___ June 21 __ eventual record high minimum __ broke 1923,53 (77F), also 1964,88 (76F) _77F ___ June 30 ___ warmest recent (1980-2024), warmest since tied eventual records 1945, 59 (79F) _42F ____ Dec 9 ___ warmest recent (1980-2024) tied 1991,2012,2019 __ warmest since 1972 (45F), eventual record 1966 (54F) ___________________________________________________________________________ 2013 __ This year faced a record shutout but rallied with warm records on Dec 21 and 22, in the warm sector of a damaging ice storm further north. These two records broke previous marks by 1 and 8 deg for an average of 4.5 F deg. While Britain had a notably cold spell from about March 10th to Apr 3rd, temperatures at NYC in that interval were generally close to average. The closest that 2013 had come to setting high maximum records before the two successful days were these -- 61F on Jan 31st was 2 short of the 1916,47 tied record of 63F; 82F on Apr 9th was four short of the 1991 record; 92F on June 24th was four lower than the 1888 record; 98F and 97F on July 17th-18th both fell three short of 1953 records; 96F on Sep 11th three short of tied 1931,83 99F; 86F Oct 4th was two lower than 88F in 1941; 62F on Dec 23rd came within 2 of extending the record spell to three days. So while there was no great shortage of near-record warmth in 2013, it came in rather similar to many previous years even back into the starter era. There were two record low maxima: 68F on July 25th. 30F tied 1880 on Nov 24th. (count 1.50) While there were no record low minima, May 14th (42F) was within two of the 1878 record. These readings were record high minima: 55F Apr 10th (tied 1871), 81F July 18th (tied 1900), 83F July 19th, then 81F July 20th was broken by 82F in both 2015 and 2019, and 77F on Sep 11th was one short of the 1983 record; readings of 51F and 61F Dec 21-22 included a new record high for December which only lasted to Dec 24th, 2015 (63F). That was a total of five records (and two near misses) for a count of 4.0 (4.5 during the year due to the later broken record on July 20th). Temp ___ date ___ replaces _ ties ______ broken ___ eventual end of data record max, recent max _65F ___ Dec 21 ___ eventual record .. (1923, 2011 t-2nd (62F), 2018 4th (61F), 1990 5th (59F), 1957 6th (58F)). _71F ___ Dec 22 ___ eventual record .. (1949,1998 t2nd (63F), 1967, 2015 t-4th (62F), 1990 6th (61F)) Record high minima (4.5), end of data 4.0 survived _55F ___ Apr 10 __ eventual record high minimum tied 1871 __ also 1955,69,80 (54F) _73F ____ June 1 ____ warmest recent (1980-2025) __ warmest since eventual record 1895 (77F) _81F ___ July 18 __ eventual record high minimum tied 1900 __ also 1905 (80F), 1907,99 (79F) _83F ___ July 19 __ eventual record high minimum __ broke 1878 (81F), also 1905,82 (80F) _81F ___ July 20 __________ 1930 (81F) __ 2015,19 (82F) _ 2015,19 (82F) __ also 2020 (81F) _51F ___ Nov 17 __ warmest recent (1980-2024) tied 1963, 2010 __ warmest since 1931,54 (52F), eventual record 1927 (60F) _51F ___ Nov 18 __ warmest recent (1980-2024) tied 1994 __ warmest since 1966 (52F), eventual record 1928 (57F) _51F ___ Dec 21 __ eventual record high minimum __ broke 1895 (49F), also 1957, 2018 (47F) _61F ___ Dec 22 __ eventual record high minimum __ broke 1990 (58F), also 2015 (53F), 1949,2011 (48F) _ _ _ was monthly max until Dec 24, 2015 (63F) _____________________________________________________________________________ 2014 __ 2014 became the fourth and final year of the data set to fail to set any high maximum records. The closest that the year came to matching any previous records were 56F on Feb 2nd (within 3 of 59F 1988), 84F on Sep 28th within 4 of 88F 1881 and 69F on Nov 24th within four of 73F 1979). Then 68F on Nov 25th was within five of another 1979 record 73F. As with 1992 and 2004, I compared these to starter era records and checked the rest of the year. These four would have been starter records except Sep 28th (1881 was in the starter era itself). So in addition to the three mentioned above, 2014 would have claimed these starter era records: 58F Jan 11th, 66F Mar 11th (tied 1879), 58F Mar 15th, 63F Mar 22nd (tied 1894), 62F Mar 28th, 73F Apr 12th, 72F Oct 27th, 72F Oct 28th, 68F Nov 4th, 65F Dec 1st, and 54F Dec 28th. That would have given 2014 a starter era count of 13.00, behind 2004 but ahead of 1992 and a bit higher than the average for 1869-1900. Similar years were 1872, 1886 and 1892. If 2014 had been a starter year its extinction date would have been Nov 25th, 1979 (two records would have fallen 24th-25th and oddly enough if both 2004 and 2014 had been starter years, 2014 would have changed 2004's extinction date to Mar 2nd, 1972 since 1992 went to Nov 25th 1979 with a lower value (65F vs 68F in 2014). There were no low maxima in 2014, 19F Jan 7th was 2 deg above the 1878 record. 17F Jan 22nd was 3 above the 1888 record. A record low of 4F was set on Jan 7th. (count 1.00). This was the first record low minimum since Jan 16th, 2004 tied 1893, an absence of ten years less nine days. The longest absence before this was 2.5 years (Sept 1990 to Mar 1993). Another notable minimum in 2014 was 22F on March 27th (record 20F 1894). 31F on Apr 16th was also two above the record (29F 1928). There were two record high minima in 2014: 76F on June 18th (tied 1957), and 69F on Oct 15th. (count 1.50) A tied record on April 14th (59F) was later broken in 2019 (60F) so the count during 2014 was 2.0. Record high minima (2.0), end of data 1.5 survived. _59F ___ Apr 14 _________ 1896 (59F) __ 2019 (60F) __ 2023 (70F) __ also 1945 (57F) _76F ___ June 18 __ eventual record high minimum tied 1957 __ also 1905 (75F), 1962 (74F), 1894, 2018 (73F) _69F ___ Oct 15 __ eventual record high minimum __ broke 1975 (66F), also 1960, 2017 (65F) _61F ___ Oct 16 ___ warmest recent (1980-2024) __ warmest since 1914,19,60 (62F), eventual record 1897 (67F) _______________________________________________________________________ 2015 __ 2014 and 2015 were considered to be years of the polar vortex, with their winters (2013-14, 2014-15) being either quite cold or extremely cold as with Feb 2015. Later in 2015 however the trend was gradually upwards and the year ended very warm as was also the case in Europe. I suspect that the trigger for the change was the unusual evolution of Pacific hurricane Patricia which crossed Mexico in late October and then the extratropical remnant low headed north towards the Great Lakes. This released a lot of subtropical heat which seemed to linger for about 2-3 months over a large area from eastern North America to Europe. But this warmth was already building gradually through the summer of 2015. The warmth in November and December followed a similar timing to that seen in Britain, and the month of December was similarly about 1.5 C deg above any previous average following a top ten November. The year ended up setting eight records, three of them ties, for a count of 6.50 and a 100% survival rate to Nov 6, 2022 when the tied record was broken, leaving the count now at 6.0. These broke previous records by an average of 2.4 F deg. In terms of exceeding random expectation (262%), 2015 was surpassed by only 2001 (468%), 1990 (384%), 1991 (337%), 1988 (281%) and 1998 (279%) since 1949 had hit 318%. Some intervening years had a few more records than 2015 but they had higher random expectations. The number of surviving records was also higher than any years since those mentioned, except for 1953 with 8.00 and 1966 which has 6.83. 2015 has one record low maximum, 58F on June 1st (tied 1945). During the very cold February, the cold was more persistent than extreme, 19F on Feb 20th was within three of the 1885 record of 16F. (count 0.50) Feb 20th set a record low minimum of 2F, well below the previous value of 7F (1950). (count 1.00) .. Another notable low was 50F on June 2nd (2 deg above a record of 48F which has five shares). 2015 set numerous high minimum records: 59F Apr 3rd (tied 1892), 66F May 5th, 70F May 11th, 82F July 20th (tied 2019), 78F Aug 17th (tied 1978), 77F Aug 19th, 20th (tied 1906 twice and also 1983 on 20th), 76F Sep 1st (part of four-way tie), 76F Sep 8th, 72F Sep 29th (tied 1959), 66F Nov 6th (also a benchmark), 57F Nov 19th (tied 1906), 55F Dec 12th and 13th, 53F Dec 14th (tied 1949, 2001), 53F Dec 15th, 50F Dec 17th (tied 1888), 63F Dec 24th (December record high) and 57F Dec 25th. That was a total of 19 records, with now eleven tied as of Nov 6, 2022, for a count of 12.92). This broke the record high number of high minima (10.5, 1906). 2017 has now moved ahead of 2015 with the tied record on Nov 6, 2022, and stands at 13.17. The count during the year 2015 was 14.92, also a record. One half was lost when 2019 tied July 20th, the other full record lost was 73F on June 12th which fell to 76F in 2017. A third reduction took place on Nov 6, 2022 with the tied record value. June 12th, 2015 was the latest set high minimum record to fall and Nov 6, 2015 was the latest to be reduced to a tie (in Nov 2022). However, Apr 12, 2017 is now the latest set high minimum to fall (to Apr 12, 2023). This count of 14.92 is the highest in the series since 1909 (15.33), 2017 had 13.17. The reduction of that count to 12.67 surviving restored 2015 to the lead (at 12.92) for surviving high minima. Temp ___ date ___ replaces _ ties ______ broken ___ eventual end of data record max, recent max _95F ___ Aug 17 __ eventual record tied by 1944 .. (1922,1987,2002 t3rd (94F), 1913,59,97 t-6th (93F), 1937,56, 2009 t-9th (92F)) _97F ___ Sep 8 ___ eventual record .. (1872,1916,1919 t-2nd (93F), 1936,45 t-5th (91F), 2010 7th (90F), 1881,84,2016 t-8 (89F)). _74F ___ Nov 6 _________ 74F (1948) ___ 2022 (75F) _ 2024 (80F) __ also 1959 5th (73F), 1938,78,94,2020 t6th (70F), 2005 10th (69F). _67F ___ Dec 13 ___ eventual record .. (1923 2nd (64F), 1946,84 t3rd (63F), 2020 5th (62F), 1919 6th (61F)). _67F ___ Dec 14 ___ eventual record tied by 1881 .. (1918,2001 t-3rd (63F), 1991 5th (61F), 1919 6th (60F), 1927 7th (59F)). _68F ___ Dec 15 ___ eventual record .. (2008 2nd (67F), 2001 3rd (63F), 1918 4th (61F), 1901,75 t-5th (60F), 2011 7th (59F)). _72F ___ Dec 24 ___ eventual record .. (1990,96 t-2nd (63F), 1941 4th (61F), 1891 5th (60F), 1900, 2020 t-6th (59F)). _66F ___ Dec 25 ___ eventual record .. (1889, 1982 t-2nd (64F), 1940,2014 t-4th (62F), 1979,2020 t-6th (61F), 1964 8th (60F)). Record high minima (14.92), end of data 12.92 survived _59F ___ Apr 3 ___ eventual record high minimum tied 1892 __ also 2000 (55F), 1903 (54F) _66F ___ May 5 ___ eventual record high minimum __ broke 1944, 2006 (64F), also 1949 (63F), 1896 (62F) _61F ___ May 10 ___ warmest recent (1980-2025) tied 2007, warmest since 1979 (71F) eventual record high minimum _70F ___ May 11 ___ eventual record high minimum __ broke 1970 (69F), also 1895, 1985 (67F) _73F __ June 12 ___ 1942,73,97,2005 (72F) __ 2017 (76F) __ 2017 (76F) __ also 1880,1898,1914,1939 (71F) _82F ___ July 20 ___ eventual record high minimum tied 2019 __ broke 1930, 2013 (81F), also 2020 (81F) _78F ___ Aug 17 ___ eventual record high minimum tied 1978 __ also 1888, 1995, 2016 (77F), _77F ___ Aug 19 ___ eventual record high minimum tied 1906 __ also 1872, 2002, 2021 (75F) _77F ___ Aug 20 ___ eventual record high minimum tied 1906, 1983 __ also 1899, 1937, 2004 (76F) _76F ___ Aug 31 __ warmest recent (1980-2024) tied 2010 __ warmest since eventual record 1953 (78F) _76F ___ Sep 1 ___ eventual record high minimum 1898, 1980, 2010 __ also 1878,81,1950,53,2013,14 (75F) _76F ___ Sep 8 ___ eventual record high minimum __ broke 1919 (75F), also 1884, 1985 (74F) _76F ___ Sep 9 ___ warmest recent (1980-2024) __ warmest since eventual record 1884 (77F) _72F ___ Sep 29 ___ eventual record high minimum tied 1959 __ also 1979 (71F), 1884, 1901 (70F) _66F ___ Nov 6 ___ eventual record high minimum tied 2022 __ broke 1938 (64F), also 1948,94 (61F) _57F ___ Nov 19 __ eventual record high minimum tied 1906 __ also 1900, 2003 (55F), 1985 (54F) _51F ___ Dec 10 ___ warmest recent (1980-2024) __ warmest since tied eventual records 1946, 1966 (54F) _50F ___ Dec 11 ___ warmest recent (1980-2024) __ warmest since 1897 (51F), eventual record 1887 (53F) _55F ___ Dec 12 ___ eventual record high minimum __ broke 1911 (54F), also 1899 (53F) _55F ___ Dec 13 ___ eventual record high minimum __ broke 1991 (51F), also 1983 (50F) _53F ___ Dec 14 __ eventual record high minimum tied 1901, 2001 __ also 1983 (47F) _53F ___ Dec 15 ___ eventual record high minimum __ broke 1948, 1983 (48F), also 1897, 2011 (47F) _50F ___ Dec 17 ___ eventual record high minimum tied 1888 __ also 1928,1984,2021 (48F) _63F ___ Dec 24 ___ eventual record high minimum [monthly max]* __ broke 1931 (50F), also 1941 (49F) _57F ___ Dec 25 ___ eventual record high minimum __ broke 1979 (50F), also 1964 (49F), 1987 (48F) _47F ___ Dec 26 ___ warmest recent (1980-2024) __ warmest since eventual record 1964 (50F) _46F ___ Dec 27 ___ warmest recent (1980-2024) tied 1973, 2019 __ warmest since eventual record 1949 (57F) ____________ * as monthly max, broke 61F Dec 22, 2013 ___________________________________________________________________ 2016 __ The very mild winter from Dec 2015 gradually cooled and there was a record snowstorm of 27.3" on Jan 23rd, 2016. Temperatures only stayed cold briefly after that, reaching 59F on Feb 3rd-4th, but there was a brief cold spell mid-February before it again warmed rapidly in March with two record highs, followed by a rather hot summer without quite reaching record territory, and a third record was set in October. The survival rate was once again 100%. These three records (count 3.0) broke previous values by an average of 4.0 F deg. There were no low maximum records set in 2016. Feb 14th (15F) was within three of the 1916 record. One record low minimum was set, -1F on Feb 14th removed 2F (1916) after a century. (count 1.0). May 16th (43F) came within one degree of the 1878 record low. Record high minima included 47F Feb 29th (tied 1896), 63F Mar 10th (early season benchmark), 61F Apr 1st, and 62F Apr 22nd, for a total of four and a count of 3.50. 81F on Aug 13th was one degree short of the 1908 record, and 67F on Oct 18th was two degrees short of the 1928 record, one of three consecutive days where 2016 holds a "warmest recent" mark. Temp ___ date ___ replaces _ ties ______ broken ___ eventual end of data record max, recent max _76F ___ Mar 9 ____ eventual record .. (2020 2nd (72F), 2000 3rd (71F), 1921,77 t-4th (66F), 1913,73,2002 t-6th (65F)). _79F ___ Mar 10 ___ eventual record .. (2006 2nd (74F), 1955 3rd (71F), 1879,1977 t-4th (69F), 1878 6th (68F), 1967 7th (67F)). _85F ___ Oct 19 ___ eventual record .. (1963 2nd (83F), 1965 3rd (81F), 1945 4th (80F), 1928 5th (79F), 1961 6th (76F)). Record high minima (3.5), end of data 3.5 survived _47F ___ Feb 29 ___ eventual record high minimum tied 1896 __ also 1880 (46F), 1972 (44F) _63F ___ Mar 10 ___ eventual record high minimum __ broke 1955 (51F), also 1871 (48F) _48F ___ Mar 11 ___ warmest recent (1980-2025) __ warmest since tied eventual records 1967, 1977 (50F) _61F ___ Apr 1 ____ eventual record high minimum __ broke 1986, 2008 (58F), also 2006 (53F) _62F ___ Apr 22 ___ eventual record high minimum __ broke 1926, 1977 (60F), also 1885, 1974 (59F) _73F ___ May 27 ___ warmest recent (1980-2025) __ warmest since eventual record 1908 (74F) _81F ___ Aug 13 ___ warmest recent (1980-2024) __ warmest since eventual record 1908 (82F) _78F ___ Aug 16 ___ warmest recent (1980-2024) __ warmest since eventual record 1938 (79F) _74F ____ Sep 10 ____ warmest recent (1980-2024) tied 1895, 1996 __ warmest since eventual record 1884 (77F) _63F ____ Oct 17 __ warmest recent (1980-2024), warmest since 1947 (65F) and eventual record 1928 (67F) _67F ____ Oct 18 __ warmest recent (1980-2024), warmest since eventual record 1928 (69F) _65F ____ Oct 19 __ warmest recent (1980-2024) tied 2007, warmest since eventual record 1905 (68F) __________________________________________________________________________________________ 2017 __ This year holds the last record to fall (66F on Jan 12th was edged out by 68F in 2020). This was also the second last starter era record (1890, 64F) to be denied survival (Dec 11 1879 fell to 2021), leaving the starter era with a count of 34.91 eventual records (now 33.91). As a result, the year has five record highs, a count of 4.33, and four (count 3.33) of those survived for a survival rate of 76.9%. These five records increased by an average of 1.4 F deg over past values. Since one record fell in Jan 2020, and was surpassed by 2 F, the average for all five records is 0.4 F deg. The average extinction date would change from Jan 12th 2020 to about the middle of 2021 if the four surviving records fall within the next year (May 18th looks like it will not this year, from guidance today (May 13th), so I calculated this from 2022 dates for the first two). 65F on Feb 19th was one short of the 1997 record. 65F and 70F (Feb 23rd-24th) were 7 and 5 deg short of earlier records. 70F on Mar 1st was 3 deg short of the 1972 record. 80F on Apr 11th was four short of a 1955 record although 2011 had hit 81F. 85F on Apr 29th was four below the 1974 record. 90F on May 17th also fell to 1974 (92F). 94F on June 13th was two short of the 1961 record. 88F on Sep 25th was two short of the 1970 record. 74F on Nov 3rd fell five short of 2003. 55F missed eliminating the weakest daily record of just 58F on Dec 19th (shared by 1899, 1931) -- this one should go soon because December seems to be warming faster than any other month and most records are well above 60F or into the low 70s now. There was one record low maximum value in 2017, a share in July 14th (73F) for a count of 0.25, although 38F on Nov 11th would have tied on either Nov 10th or 12th (but the record on 11th was 33F from 1987). This November cold spell set two new record low minima, 25F on Nov 10th and 24F on Nov 11th (probably both on the night of 10th-11th). These beat out former record lows of 27F (1914) and 28F (1873, 1926, 1933). (count 2.00) Sept 2nd also came within 3 deg of a record low (54F vs 51F in 1886). There were 15 daily high minimum records set, including ties for a count of 13.17, second to 14.92 set in 2015.. These were: 47F (Jan 12th), 53F (Feb 19th), 58F (Feb 24th which set a monthly maximum record also), 47F (Feb 28th tied 1903, 1910), 54F (Mar 1st), 61F (Apr 11th), 58F (Apr 12th tied 1947 but broken by 64F in 2023), 64F (Apr 29th), 75F (May 18th), 76F (June 12th), 77F (June 13th), 72F (Oct 8th), 71F (Oct 9th), 67F (Oct 24th), and 45F Dec 19th (tied 1949,57). The late September warm spell had one reading within one of a record (70F on Sep 25th) and lows were in the 67-71 F range for about two weeks ending on the 27th. The broken tied record Apr 12th, 2023 is (a) the latest set record high minimum to be broken, and (b) causes 2017 to fall into second place for surviving high minima (12.67 now, to 12.92 in 2015). Temp ___ date ___ replaces _ ties ______ broken ___ eventual end of data record max, recent max _66F ___ Jan 12 ___ 1890 (64F) __________ 2020 (68F) _ 2020 (68F) __ (2017 2nd (66F), 1890 3rd (64F), 1913 4th (63F), 2018 5th (61F), 1885, 1980 t-6th (60F)) _62F ___ Feb 8 ___ eventual record .. (1965 2nd (61F), 1933 3rd (60F), 1932,1990,2009 t-4th (58F), 1890,2019 t-7th (55F)). _92F ___ May 18 __ eventual record .. (1906,36 t-2nd (90F), 1962 4th (89F), 1877,1977 t-5th (88F), 1896 7th (87F), 1903,43,86,89 t-8th (86F)). _93F ___ June 12 __ eventual record tied by 1933 and 1973 .. (1967 4th (92F), 1914,83 t-5th (91F), 1938,47,49,88 7th (90F), 1872,98,1901,57 t11th (89F)) _91F ___ Sep 24 ___ eventual record .. (1959 2nd (89F), 1920 3rd (88F), 1961,70 t-4th (87F), 1922 6th (86F), 1870,81,1937,2010 t7 (85F)). Record high minima (13.17) _ 12.67 have survived (to Apr 2023) _47F __ Jan 12 ___ eventual record high minimum ___ broke 2006 (45F), also 2018 (44F), 2020 (43F), 1870, 1975, 2008, 2013 (42F) _43F ___ Jan 22 ___ warmest recent (1980-2025) tied 1957 __ warmest since eventual record 1906 (47F) _43F ___ Jan 26 ___ warmest recent (1980-2025) __ warmest since 1967 (44F) and eventual record 1916 (49F) _53F __ Feb 19 ___ eventual record high minimum ___ broke 1981, 1997 (49F), also 1992 (43F), 1909,39 (42F) _58F __ Feb 24 ___ eventual record high minimum [monthly max] ___ broke 1985 (54F), also 1930 (50F) _47F __ Feb 28 ___ eventual record high minimum tied 1903, 1910 __ also 1971 (46F), 1880, 1955 (44F) _54F __ Mar 1 ____ eventual record high minimum __ broke 1902 (49F), also 2004 (45F) _61F __ Apr 11 ___ eventual record high minimum __ broke 1922,55 (58F), also 2014 (56F) _58F __ Apr 12 ________ tied 1947 (58F) __ 2023 (64F) __ also 1945 (57F), 1948 (56F), 1889, 1996 (55F) _64F __ Apr 29 ___ eventual record high minimum __ broke 1956,83 (63F), also 2024 (63F), 1957 (62F), 1974 (61F) _65F ___ May 17 ____ warmest recent (1980-2025) tied with 2018 __ warmest since 1974 (66F), eventual record 1906 (70F) _75F __ May 18 ___ eventual record high minimum __ broke 1896, 1906 (69F), also 1877 (68F), 1943,77 (67F) _76F __ June 12 __ eventual record high minimum __ broke 2015 (73F) _ also 1942,73,97,2005 (72F), 1880,1898,1914,1939 (71F) _77F __ June 13 __ eventual record high minimum __ broke 1961,2005 (75F) __ also 1898 (74F) _76F __ June 23 __ warmest recent (1980-2024) tied with 1909, 1910 __ record was 77F (1888), broken by 80F in 2025 _69F ___ Sep 19 ____ warmest recent (1980-2024) tied with 1949 __ warmest since eventual record 1906 (74F) _70F ___ Sep 25 ____ warmest recent (1980-2024) tied with 2011,25 __ warmest since eventual tied records 1881, 1970 (71F) _68F ___ Oct 6 ____ warmest recent (1980-2024) __ warmest since eventual record 1910 (71F) _72F ___ Oct 8 ___ eventual record high minimum __ broke 1922,49,82,90,2007 (67F), 1959 (66F) _71F ___ Oct 9 ___ eventual record high minimum __ broke 1879, 1990 (68F) __ also 2018 (68F) _67F ___ Oct 24 __ eventual record high minimum __ broke 1908 (66F), also 2001 (64F), 1900 (62F) _45F ___ Dec 19 __ eventual record high minimum tied 1949, 1957 __ also 1967 (44F), 1895 (43F) __________________________________________________________________________________ 2018 __ This year featured a very mild February and summery warmth in early May, but other parts of the year were often fairly close to average. There were four records set, two being ties for a count of 3.00. The survival rate from 2018 to end of the data (as of May 2021) is now 100%. These four records improved in two cases by 10 and 2 deg (the others tied earlier records) for an average of 3.0 F for the four. The 78F on Feb 21st was a new monthly maximum for February (previously it had been 75F in 1930 and 1985). In addition to records set, 60F (Jan 23rd) was within 3 deg of 1874, 62F on Feb 11th within 3 deg of another tied record (1960, 2009), 67F on Feb 20th within two of a record 69F set 1930 and tied 1939, 88F May 15th within two of the 1900 record (90F), 96F July 1st was four short of the 1901 record with several other years 97 to 99 F, 93F on Sep 6th was within four of the 1881 record (97F), and 61F on Dec 21st was four short of 2013. Although no low maximum records were set, 13F on Jan 6th missed by one degree (12F 1896) and was the coldest January maximum since 1994. There were also no low minimum records, 5F on Jan 7th was edged out by 4F in 2014. There were 12 high minimum records including four ties (count 9.75). 46F (Jan 28th, tied 2002), 55F (Feb 24th), 70F (May 3rd), 72F (May 4th), 72F (May 26th, tied 1880), 79F (July 1st), 79F (Aug 28th), 81F (Aug 29th), 78F (Aug 30th, tied 1973), 77F (Sep 5th, tied with 1898, 1907, 1985), 71F (Oct 10th), 69F (Oct 11th). Temp ___ date ___ replaces _ ties ______ broken ___ eventual end of data record max, recent max _62F ___ Feb 12 __ eventual record tied by 1999 .. (1966 3rd (58F), 1984,2009 t-4th (57F), 1932 6th (56F), 1877,80,1940.98 t-7th (54F)) _78F ___ Feb 21 __ eventual record .. (1930 2nd (68F), 1953 3rd (67F), 2002 4th (63F), 1913, 1997 t-5th (62F), 1943,89 t-7th (60F)). [Feb monthly max] _90F ___ May 2 ___ eventual record tied by 2001 .. (1913 2nd (89F), 2010 3rd (88F), 1899,1930,1992 t-4th (86F), 1894 7th (85F), 1884 8th (84F)) _92F ___ May 3 ___ eventual record .. (2001 2nd (90F), 1913 3rd (89F), 1878,1969 t-4th (84F), 1880,1942 t-6th (82F)) Record high minima (9.75) _42F ___ Jan 21 ___ warmest recent (1980-2025) __ warmest since 1923 (44F) and eventual record 1906 (49F) _46F ___ Jan 28 ___ eventual record high minimum tied 2002 __ also 1974 (44F), 1947 (42F), 1879 (41F) _45F ___ Feb 11 ___ warmest recent (1980-2025) tied 2009 __ warmest since eventual record 1966 (50F) _47F ___ Feb 20 ___ warmest recent (1980-2025) tied 1981, after eventual record 1939 (48F) _55F ___ Feb 21 __ eventual record high minimum __ broke 1930, 2002 (50F), also 1981 (47F) _60F ___ Apr 13 ___ was warmest recent (1980-2022) tied 1977, after eventual record 1945 (61F) (broken by 2023 67F) _70F __ May 3 ___ eventual record high minimum __ broke 2001 (68F), also 1913, 2010 (67F) _72F __ May 4 ___ eventual record high minimum __ broke 2001 (71F), also 1942 (68F), 1878 (65F) _61F ___ May 15 ____ warmest recent (1980-2025) tied 1991 __ warmest since 1976 (65F), eventual record 1900 (68F) _65F ___ May 17 ____ warmest recent (1980-2025) tied with 2017 __ warmest since 1974 (66F), eventual record 1906 (70F) _72F __ May 26 ___ eventual record high minimum tied 1880 __ also 1981, 2007 (71F), 2016 (69F), 1914 (68F) _79F __ July 1 ____ eventual record high minimum __ broke 1901 (78F), also 1945,64,68 (77F) _79F ___ July 2 ____ warmest recent (1980-2024) tied 1903 __ warmest since eventual record 1901 (82F) _77F ___ Aug 6 ____ warmest recent (1980-2024) tied 2022 __ warmest since eventual records 1906,08,18 (80F) _79F __ Aug 28 ___ eventual record high minimum __ broke 1948 (78F), also 1973 (77F) _81F __ Aug 29 ___ eventual record high minimum __ broke 1948 (78F), also 1979 (77F) _78F __ Aug 30 ___ eventual record high minimum tied 1973 __ also 1979 (77F), 1953,60 (76F) _77F ___ Sep 4 ____ warmest recent (1980-2024) tied 1907 __ warmest since eventual record 1898 (78F) _77F ___ Sep 5 ___ eventual record high minimum tied with 1898, 1907, 1985 __ also 1880 (76F) _71F ___ Sep 12 ___ warmest recent (1980-2024) tied 1981 __ warmest since 1971 (72F), eventual record 1895 (77F) _63F ___ Oct 1 ____ warmest recent (1980-2024) tied 1986 and 2019, after 70F (1959) and eventual record 72F (1954) _71F __ Oct 10 ___ eventual record high minimum __ broke 1949 (69F), 1990 (68F), 1922 (67F) _69F __ Oct 11 ___ eventual record high minimum __ broke 1949 (68F), 1990 (67F), 1914 (64F) _64F ___ Nov 2 ____ warmest recent (1980-2024) __ warmest since eventual record 1971 (67F) ______________________________________________________________________________ 2019 __ This year had few opportunities to set record highs, with temperatures often close to average. One record was set (Oct 2nd) and it increased the previous value from 1927 by 3 F deg. The closest calls to record highs in the rest of 2019 included these: 58F (Jan 1st) within four of 1966, 65F on Feb 5th within 5 of 1991, 75F (Mar 15th) within 2 deg of 1990, and 90F Aug 18th-19th within 4 of two three-way ties for 94F. There were two record low maximum readings, 16F (Jan 31st, tied 1935) and 48F (May 13th). 34F on Nov 13th missed the 1911 record by one degree. (count 1.50) There was an unusually cold spell in mid-November, setting three record low minima. 29F on Nov 8th tied 1886, then 25F and 23F on Nov 12th-13th (likely both on the same night) were not quite benchmarks (23F had been hit on Nov 5th, 1879 but with a much weaker urban heat island in place then). The two new records were one lower than values from 1926 and 1986. The count of 2.50 exceeds the count for record highs for the first year since 2014 (0 , 1) with 1994 at (1.33, 3.0). Before that, there were a few years that had more surviving record lows than surviving record highs (1982, 1963, 1943 among them), but not a lower count of record highs set in the year, until 1940 (3.33, 5.5). There were three record high minima in 2019, 49F (Mar 15th tied 1913), 60F (Apr 14th), 82F (July 20th, tied 2015) for a count of 2.00. One of those records (Apr 14, 60F) fell in 2023 (70F) and another (49F Mar 15th tied 1913) fell in 2024 (51F); 2024 also broke a 2023 record on Feb 10, 2024 which is now (Feb 10, 2023) the last high minimum to be broken (Apr 14, 2019 had held this record, and replaced Apr 12, 2017 also replaced in 2023 thus holding the distinction for just two days). Temp ___ date ___ replaces _ ties ______ broken ___ eventual end of data record max, recent max _93F ___ Oct 2 ___ eventual record .. (1927 2nd (90F), 1922 3rd (88F), 1954 4th (86F), 1968,95 t-5th (85F), 2002 7th (84F) 2013 8th (83F)). Record high minima (2.0) __ 0.5 have survived (as of Mar 15, 2024) _49F ___ Mar 15 ___ eventual record high minimum tied 1913 __ also 2002 (48F), 1946 (47F), 1945, 1989 (46F) _49F ___ Mar 15 __________ 49F (1913) ___ 51F (2024) __ (51F 2024) __ also _60F ___ Apr 14 ___ 59F (1896, 2014) ___ 70F (2023) __ 70F (2023F) __ also 1945, 2022 (57F), 1941 (54F) _82F ___ July 20 ___ eventual record high minimum tied 2015 __ also 1930, 2013, 2020 (81F) _63F ___ Oct 1 ___ warmest recent (1980-2024) tied 1986 and 2018, after 70F (1959) and eventual record 72F (1954) _58F ___ Oct 30 __ warmest recent (1980-2024) tied 1949,50,55,61 and 2024__ warmest since eventual tied records 1918,46 (64F) _60F ___ Oct 31 __ was warmest recent (1980-2023), tied 1974, 1989, after eventual record 1881, 1961 (62F) ... ... replaced by 61F 2024 _42F ____ Dec 9 ___ warmest recent (1980-2024) tied 1991,2004,2012 __ warmest since 1972 (45F), eventual record 1966 (54F) _46F ___ Dec 27 ___ warmest recent (1980-2024) tied 1973, 2015 __ warmest since eventual record 1949 (57F) ____________________________________________________________________________ 2020 __ January, early February, July and November were all quite warm in 2020, in fact November was warmest on record. The heat in July while sustained was never extreme (96F the annual maximum) so the records were set in the other two months with a total of five, and a count of 4.50. In this last full year of the records, the five years replaced were 1938, 1975 (and also tied), 1985 and 2017. The five records increased previous values by an average of 2.2 F deg. In the November warm spell, the 8th (75F) missed by only one degree (1975 was 76F), and the 11th by two (72F, record 74F 1949). 65F on Nov 26th was two below the 1946 record. 62F on Dec 13th and 61F on Dec 25th were both five degrees below 2015 record highs. There were no low maxima in 2020 but May 9th with a trace of snow was quite cold at 48F (record 44F 1977). Two record low minima were set in May, 36F May 8th and 34F May 9th (a rare modern benchmark low). The previous records for those two days were 37F and 35F (both 1947). Seven record high minima were set. Jan 11th had 51F, Mar 3rd 49F, July 28th 80F, Nov 10th 60F, Nov 11th 64F (also a benchmark high so late in the season although next benchmark 63F Dec 24th 2015 probably more anomalous), and 55F Nov 26th (tied 1946). (count 6.50). Temp ___ date ___ replaces _ ties ______ broken ___ eventual end of data record max, recent max _69F ___ Jan 11 __ eventual record .. (1975 2nd (63F), 1933,80 t-3rd (59F), 1983,2014 t-5th (58F), 1924 7th (57F), 1913,2008 t-8th (56F)). _68F ___ Jan 12 __ eventual record .. (2017 2nd (66F), 1890 3rd (64F), 1913 4th (63F), 2018 5th (61F), 1885, 1980 t-6th (60F)). _56F ___ Feb 7 ___ eventual record .. (1938 2nd (54F), 1904,25,33,90 t-3rd (53F), 1965,2005 t-7th (52F), 1884,1953,1955 t-8th (51F)). _75F ___ Nov 9 ___ eventual record tied by 1975 .. (1986 3rd (73F), 1895,1945,1950 t4th (72F), 1916 7th (71F)) _74F ___ Nov 10 __ eventual record .. (1985 2nd (73F), 1931,2009 t-3rd (72F), 1966 5th (70F), 1949 6th (69F), 1895,1948,64 t-7th (68F)) Record high minima (5.5) _51F ___ Jan 11 __ eventual record high minimum __ broke 1975 (48F), also 1972 (44F) _37F ___ Feb 13 ___ warmest recent (1980-2025) tied 1977 __ warmest since 1974,76 (38F), eventual record 1880 (47F) _50F ___ Mar 3 ___ eventual record high minimum __ broke 1991 (48F), also 1878, 2004 (47F) _77F ___ July 26 ___ warmest recent (1980-2024) tied 1995 __ warmest since eventual record 1979 (79F) _80F ___ July 28 __ eventual record high minimum __ broke 1931 (78F), also 1882 (77F) _78F ___ Aug 11 ___ warmest recent (1980-2024) __ warmest since 1905 (80F), eventual records 1891,96 (81F) _75F ___ Aug 24 ___ warmest recent (1980-2024) tied 1998 __ warmest since eventual record 1891 (76F) _64F ___ Oct 22 ___ warmest recent (1980-2024) __ warmest since eventual record 1979 (67F) _60F ___ Nov 10 __ eventual record high minimum __ broke 1966,77 (58F), also 1975,85,99 (57F) _64F ___ Nov 11 __ eventual record high minimum __ broke 2002 (60F), also 1970 (57F), 1935 (56F) _55F ___ Nov 26 __ eventual record high minimum tied 1946 __ also 1908, 79 (53F) ______________________________________________________________ (decade of 2021-30 will have to wait a while for its overview) 2021 __ 2021 set two records, in which the average increase over the previous values is 4.0 F. There have been two low maximum records (count 1.5) on May 29, 30 (51 F), no low minimum records, and five high minima were established already. 52F Mar 12th, 52F Mar 26th (tied 1986), 76F June 7th and 78F June 29th, 78F (tied 1948, Aug 26) for a count of 5.0. _82F ___ Mar 26 __ eventual record .. (1922 2nd (76F), 1986 3rd (75F), 1913,43 t-4th (72F). 1925,1976 t-6th (69F), 1946 8th (68F)). _66F ___ Dec 11 __ eventual record .. (1879 2nd (64F), 1897, 1971, 1979 t-3rd (63F), 2015 6th 61F, 1966 7th (60F).). Record high minima (5.0) _52F __ Mar 12 __ eventual record high minimum __ broke 1898 (50F), also 2006 (49F), 1902 (47F), 1982 (46F) _52F __ Mar 26 __ eventual record high minimum tied 1986 __ broke 1946 (51F), also 1963,1988,2000 (50F) _76F ___ June 6 ___ warmest recent (1980-2025), after eventual record 1925 (77F) _76F __ June 7 ___ eventual record high minimum __ broke 1883 (73F), also 1984 (72F) _76F ___ June 28 ___ warmest recent (1980-2025) tied 1966, 2010, after tied eventual records 1876, 1943 (77F) _78F __ June 29 __ eventual record high minimum __ broke 1870 (77F) and later 2025 (77F), also 1901, 99 (76F) _79F ___ July 16 ___ warmest recent (1980-2024) tied 1983, after eventual record 1952 (80F) _78F __ Aug 26 ___ eventual record high minimum tied 1948 __ also 1900 (77F), 1893 (76F), 1961, 2016 (75F) _54F __ Dec 16 ___ eventual record high minimum __ broke 1971 (48F), also 2015 (46F), 1928 (45F) _48F ___ Dec 31 ___ warmest recent (1980-2024) tied 2011, after eventual record 1965 (51F) ___________________________ 2022 __ So far the year has set 3.0 high maxima, 1.0 low maximum (33F on Mar 28), and 5.0 high minima. _68F __ Feb 17 __ eventual record __ (1976 2nd (67F), 2011 3rd (63F), 1981 4th (62F), 1891 5th (59F) _68F __ Mar 6 ___ tied eventual record set in 1935 __ (1921 3rd (64F), 2004 4th (63F), 1894 5th (62F) _74F __ Mar 7 ___ tied eventual record set in 1946 __ (1987 3rd (71F), 2009 4th (70F), 1878,1974 t5th (69F)) _75F __ Nov 6 ___ 1948, 2015 (74F) _____ 2024 (80F) __ 1959 5th (73F), 1938,78,94,2020 t6th (70F), 2005 10th (69F). _ 62F __ Dec 30 __ not a record, second warmest for date (record 65F 1984) Record high minima (4.0) _50F ___ Jan 1 ___ warmest recent (1980-2025) tied 1979 __ warmest since eventual record 1966 (52F) _49F __ Feb 17 __ eventual record high minimum __ broke 1981, 2011 (46F), also 1891, 1948 (44F) _72F __ May 22 ___ eventual record high minimum tied 1959 __ also 1875 (69F), 1903,11 (68F) _77F ___ Aug 6 ____ warmest recent (1980-2024) tied 2018 __ warmest since eventual records 1906,08,18 (80F) _61 F ___ Oct 25 ___ warmest recent (1980-2024) __ tied 1975 __ warmest since 1913 (62F) and eventual record 69F (1908) _64F __ Nov 5 ___ eventual record high minimum __ broke 1938 (63F), 1961 (62F), 1935 (61F) _66F ___ Nov 6 ___ eventual record high minimum tied 2015 __ broke 1938 (64F) later tied 2024, also 1948,94 (61F) _60F ___ Nov 12 __ eventual record high minimum __ broke 1912,35 (56F), also 1982 (55F), 1909 (54F) _54F ___ Dec 7 ___ eventual record high minimum __ broke 1951,56 (53F), also 1884,1932 (52F), 1879, 1998 (50F) 2023 _ The year 2023 logged the mildest January on record, but this surprisingly produced only one tied record in each category, and one recent warmest high minimum ... eventually also the warmest year at NYC (58.0 F) but not a huge number of daily records (3.83), April led the way, October and December had close calls as noted. A somewhat higher count of record high minima (6.33), but not particularly high on list for that category either. What made 2023 warmest year was a near total absence of colder days, and long spells of warm to near record temperatures. Record high max count 3.83 _ 66F ___ Jan 5 __ tied record maximum set in 1950 __ 1993 3rd (64F), 1998 4th (62F), 1951 5th (61F), 1906,1907,2000 t6th (60F)) _ 61F ___ Feb 10 __ eventual record tied by 1990,2001 .. (1898 4th (58F), 1955 5th (57F), 1909 6th (56F), 2002 7th (55F)). _ 80F ___ Apr 6 __ eventual record maximum __ previous 79F (1912, 1921, 1947), also 5th 78F 2010, t-6 1928, 1991 (77F), 8th 1910 (76F). _ 90F ___ Apr 13 __ eventual record maximum __ previous 88F (1977), also t-3rd 82F 1968, 2018, 5th 1945 81F. _ 91F ___ Apr 14 __ eventual record maximum __ previous 85F (1941), also t-3rd 83F 1945, 4th 1880 80F. _ 80F ___ Oct 28 __ not a record, but warmest on date since record set (83F) in 1919. _ 62F ___ Dec 15 __ not a record, but warmest on date since record set (63F) in 1984 tying 1937. ______ Record high min count 6.33, 5.33 survived after Feb 10, 2024 _ 49F ___ Jan 2 __ tied record high minimum set 1890, 1911 _ also 48F 1930, 46F 1876, 43F 2000 _49F ___ Jan 4 ___ warmest recent (1980-2025) __ __ __ __ ___ warmest since eventual daily and monthly record 1950 (59F) replaced 2000 (46F), also 1933, 97, 98 had 44F _ 45F ___ Feb 10 _____________ 1999 (43F) __ 2024 (47F) ___ also 2020 (42F), 1960 (41F), 1876,81,93,1925,56 (39F) _ 56F __ Feb 16 __ record high minimum __ broke 2002 (44F), also 1954,76,82,84 (43F), 1882 (42F) _64F __ Apr 12 __ record high minimum __ broke 58F (1947, 2017) _ also 1945 (57F), 1948 (56F), 1889, 1996 (55F) _67F __ Apr 13 __ record high minimum __ broke 61F (1945) _ also 1977, 2018 (60F), 2019 (59F), 2002,06 (55F), 1886 (53F) _70F __ Apr 14 __ record high minimum __ broke 60F (2019) _ also 1896, 2014 (59F), 1945, 2022 (57F) _77F __ Sep 6 __ warmest since record 78F set 1985. _76F __ Sep 7 __ warmest recent 1980-2024, surpassed 75F 1983, with record high minimum 79F 1881 _ also 1884, 1983 (75F) _49F __ Dec 28 __ record high minimum __ broke 47F (2008) _ also 1881 (45F), 1954,82 (44F). 2024 __ Record high max count 2.5 _68F ___ Mar 3 ___ eventual record high maximum __ broke 65F (1991) t3rd 64F (1961, 1967), ___________________________________________t5 63F (1871,1923,1972) _ 8 (61F) 2002 , t9_ 2002, 2007, 2020 (59F) _74F ___ Mar 14 ___ not a record, 75F (1946) record. Now t-3rd 70F 1903, 2007, 2017. _87F ___ Apr 29 ___ not a record, 89F (1974) record, 2nd warmest for date. (2017 3rd (85F), 1951 4th (84F), 1888 5th (83F), 1903 6th (82F), 1938 7th (81F)). _81F ____ Oct 31 ___ tied record high maximum set 1946 __ (1933,45,50,61 t3rd (76F), 1919 7th (74F), 1942,94 t8th (73F)). _80F ____ Nov 6 ___ eventual record high maximum __ broke 75F (2022), also 74F in 1948, 2015 and 73F 1919. _60F ___ Dec 29 __ 3rd highest for date (70F 1984, 65F 1982) Record high min count 2.0 _44F __ Jan 10 ___ warmest recent (1980-2025) __ tied 2000, warmest since 1972 (45F), record 1935 (47F) _43F _ Jan 27 _ warmest recent (1980-2025) _ warmest since 1952,74 (45F), record 1916 (53F) _replaced 2002 (41F) _47F __ Feb 10 __ record high minimum ___ broke 45F (2023) _ 3rd 1999 (43F) __ also 4_ 2020 (42F), 5_ 1960 (41F), _______________________________________________t6_ 1876,81,93,1925,56 (39F) _46F ___ Mar 4 ___ warmest recent (1980-2025) repl 2008 tied with 2020 (45F) _ warmest since record 1880 (51F) _49F __ Mar 15 __ record high minimum ___ broke 47F (1913, 2019) __ also 2002 (48F), 1946 (47F), 1945, 1989 (46F) _63F ___ Apr 29 ___ tied second warmest after 64F (2017). 1956, 1983 also 63F. 65F __ May 8, not a record (70F in 2000 record) 68F __ May 28, warmest (tied 1980) since record values 70F 1884, 1902, 1964. 72F __ June 3, warmest since record 75F set 1943. (replaces 68F 1985, 1990) 72F __ June 20 warmest since 74F 1987 and record 77F set 1957. (replaces 71F 1995,2006,10,17) 76F __ June 21 _ not a record (79F 2012) 75F __ June 22 _ warmest recent (t1988) since record 76F (1941) 79F __ July 7 __ not a record (84F 1908, also 80F 1883 and 2010) 77F __ July 8 __ not a record (80F 1993) 78F __ July 10 __ not a record (80F 1993) 78F __ July 16 __ not a record (80F 1952) (79F warmest recent 1980-2023 was 1983 tied in 2021) _58F ___ Oct 30 __ warmest recent (1980-2024) tied 1949,50,55,61 2019 __ warmest since eventual tied records 1918,46 (64F) 61F __ Oct 31 __ not a record (62F 1881, 1961) warmest recent 1980-2024 replaces 60F 1989 64F __ Nov 6 __ not a record (66F 2015, 2022) 49F __ Dec 17 _ second only to tied records 50F 1888, 2015. Overnight low was 51F, 49F by evening. 50F __ Dec 29 _ second only to record 55F (1984) 48F __ Dec 30 _ second only to record 52F (1948) 2025 2025 records to June 25 _96F ___ June 23 ___ eventual record high tied 1888 _99F ___ June 24 ___ eventual record high broke 1888 (96F) _96F ___ June 25 ___ not a record (99F 1943, 1952) _58F ___ Dec 18 ___ tied record highs set 1899, 1931 .. (1895,1929,1967 t-3rd (56F), 2017 6th (55F), 1924,57 7th (55F)). (count 1.83) _ record high minima _ _57F ___ Apr 4 ___ warmest recent (tied 1981) after eventual record 62F 1892 _60F ___ Apr 25 ___ broke 58F (1979,82) __ also 57F 1897, 56F 1913, 1953, 2008, 2011 _59F ___ Apr 30 ___ warmest recent (replaced 1998 58F) after 60F 1942,74 and eventual record 63F 1903 _80F ___ June 23 ___ broke 77F (1888) _81F ___ June 24 ___ broke 79F (1909) and tied June 26, 1952 for June monthly record. _81F ___ June 25 ___ broke 78F (1909) and tied June 26, 1952 and June 24, 2025 for June monthly record. _77F ___ June 29 ___ 77F not a record (78F 2021), tied second with 1870 (77F), also 1901, 1999 (76F). _70F ___ Sep 25 ___ warmest recent (1980-2025) tied 2011,17 _ warmest since tied eventual records 1881, 1970 (71F) (count 4.0) =================================================================== =================================================================== I have now finished making a count of the eventual records in all categories, adding high minimum, low maximum and low minimum to the already completed high maximum counts for NYC. I have not gone into as much detail about temporary records that are broken, and only have these final values from the end of the data period. This table will be maintained going forward so if you read it in the future, it will have updates for the rest of 2021, future years as long as I am able to monitor the data, and changes to the past numbers as a result of any new records being set. For now, here's the full count for all four types of records, plus a feature of interest, "extinction date" which for those years that have lost all record highs set (or never set one in four cases), the extinction date reveals when they were eliminated from active participation in the current records. For years that never set a record (1958, 1992, 2004, 2014) the extinction date will be the date when their last relatively high temperature (defined as any reading that would have been a starter record in 1869-1900) became extinct in the data set. So their extinction dates will be before the start of their years. The graph at the bottom of this post shows the extinction dates of all 154 years, in graphical format, and if a year is shown at 2023, then it still has record highs intact and will have a future extinction date (possibly) depending on when those records fall. Some years just made it to that status, 1913 has a one-third share in a rather weak August record high that could easily be gone soon. If that happens this year, then that date would be 1913's extinction date. 1912 has just become "extinct" as of Apr 6, 2023. A reminder, these counts include reductions for ties, 0.50 for ordinary ties, 0.33 for three-way ties etc. There is one six-way tie involved in the low minimum category (11F on March 3rd has been tied six times). I have ensured that my counts are complete as they all add up to 366 (rounded, they actually add to totals like 365.94 because of the plurality of 0.33 to 0.67 or 0.17 type rounding entries for three-way ties). Doing all of the above work assisted in quality control in that a small number of mistakes were found in the record temperature tables that preceded the counts listed above (wrong years or values were identified). Note: random expectation for each year at the end of data is the same, 2.4 records per category. There is a very small statistical difference for leap years which have a slightly higher expectation with that one day of fewer competitors, the differential is something like 2.43 to 2.41. Since they are available, I have added the count of daily precipitation and snowfall records (cols E and F). Snowfall records refer to measurable amounts only. Precipitation is always rainfall from about mid-April to mid-October and is often rainfall with some snow or sleet mixed in during the winter but can on some occasions be all snowfall. U.S. weather records do not list rainfall and snowfall separately as is the practice in Canada so I cannot provide daily rainfall records as such. Only one daily precip record was a tie (1903,1910) so this is why almost all the numbers in column E end in .0, there were two ties with the snowfall data. Count of Records Set (by end of data Feb 28 2026 _________________________________________________________ (for "2021" entries below, the number of retained records can be seen in column A) _________________A __________B __________C _________D ________________________ Daily precip (E), snowfall (F) records _____ YEAR _______ High max __ High min __ Low max _ Low min ____High max extinction date ___ E ____ F ____ 1869 __________ 0.0 _______ 0.0 ________ 6.83 ______ 4.0 ________ 1955 Aug 21 ____________ 2.0 ___ 1.0 1870 __________ 0.0 _______ 1.0 ________ 1.5 _______ 0.0 ________ 1969 Jun 28 _____________ 0.0 ___ 2.0 1871 __________ 0.0 _______ 0.5 ________ 6.83 ______ 6.5 ________ 1986 May 30 ____________ 4.0 ___ 1.0 1872 __________ 0.0 _______ 0.0 ________ 6.33 ______ 6.5 ________ 2015 Sep 8 ______________ 0.0 ___ 1.0 1873 __________ 0.0 _______ 0.0 ________12.5 ______ 6.33 _______ 1987 Jul 25 _______________4.0 ___ 2.0 1874 __________ 2.0 _______ 0.0 ________ 6.0 _______10.0 __________ 2023 ___________________2.0 ___ 1.0 1875 __________ 0.0 _______ 0.0 _______ 13.33 _____ 14.5 ________ 1970 Feb 3 ______________ 0.0 ___3.5 1876 __________ 2.0 _______ 1.5 ________ 5.5 _______ 6.0 ___________ 2023 ___________________2.0 ___1.5 1877 __________ 0.0 _______ 0.0 ________ 2.5 ______ 0.33 _______ 1932 Feb 12 _______________1.0 ___1.0 1878 __________ 0.0 _______ 0.0 ________ 3.5 ______ 3.0 ________ 1946 Mar 7 ________________ 6.0 ___0.0 1879 __________ 1.0 _______ 0.5 ________ 9.0 ______ 8.5 __________ 2023 _____________________ 1.0 ___2.0 1880 __________ 5.0 _______ 3.5 ________ 6.0 ______ 6.7 __________ 2023 _____________________ 1.0 ___2.0 1881 __________ 5.0 _______ 3.5 ________ 7.5 ______ 4.5 __________ 2023 _____________________3.0 ___1.0 1882 __________ 0.0 _______ 0.0 ________ 5.5 ______ 3.0 _______ 1972 Mar 2 __________________2.0 ___3.0 1883 __________ 0.0 _______ 0.0 ________ 9.0 ______ 4.5 _______ 1991 Feb 4 ___________________1.0 ___2.0 1884 __________ 0.0 _______ 2.83 ______ 7.75 _____ 3.5 _______ 1961 Sep 5 ___________________3.0 ___2.0 1885 __________ 0.0 _______ 1.0 ________6.33 ______6.5 _______ 1987 Jul 25 ___________________2.0 ___0.0 1886 __________ 0.0 _______ 0.0 ________7.25 _____ 6.17 _______ 2001 Apr 24 _________________2.0 ___3.0 1887 __________ 0.0 _______ 1.0 ________3.33 _____ 4.5 ________ 1975 Jan 29 __________________4.0 ___3.0 1888 __________ 0.5 _______ 0.5 _______12.83 ____12.75 __________ 2023 ______________________ 2.0 ___1.0 1889 __________ 0.0 _______ 0.0 ________ 4.0 ______ 2.0 ________ 2015 Dec 25 _________________6.0 ___0.0 1890 __________ 1.5 _______ 1.33 _______ 0.0 ______ 6.0 ___________ 2023 ______________________1.0 ___1.0 1891 __________ 3.33 ______ 3.5 ________3.83 _____ 4.0 ___________ 2023 ______________________1.0 ___0.0 1892 __________ 1.25 ______ 3.5 ________1.33 _____ 1.0 ___________ 2023 ______________________2.0 ___5.0 1893 __________ 0.0 _______ 0.0 ________ 2.33 _____ 3.08 ________ 1943 Aug 25 _______________ 3.0 ___1.5 1894 __________ 0.0 _______ 0.0 ________ 7.7 ______ 2.50 ________ 1967 Jan 24 ________________ 1.0 ___0.0 1895 __________ 6.83 ______ 6.5 ________ 2.5 ______ 4.0 ____________ 2023 _____________________ 0.0 ___0.0 1896 __________ 1.0 _______ 3.5 _________3.0 ______ 3.0 ____________ 2023 _____________________ 3.0 ___5.0 1897 __________ 1.0 _______ 1.0 _________2.5 ______ 2.5 ____________ 2023 _____________________ 1.0 ___1.0 1898 __________ 0.0 _______ 5.5 _________1.5 ______ 0.5 ________ 1990 Feb 10 __________________1.0 ___2.0 1899 __________ 0.33 ______ 0.33 _______ 6.0 ______ 1.83 __________ 2023 _______________________2.0 ___1.5 1900 __________ 3.0 _______ 2.5 ________ 3.5 ______ 1.0 ____________2023 _______________________3.0 ___0.0 1901 __________ 1.5 _______ 1.33 _______ 3.0 ______ 0.0 ___________ 2023 _______________________3.0 ___0.0 1902 __________ 0.0 _______ 0.33 _______ 3.0 ______ 0.5 _______ 1972 Mar 1 ____________________ 3.0 ___0.0 1903 __________ 0.0 _______ 2.83 _______ 5.25 ____ 2.5 _______ 1976 Feb 28 ____________________ 3.5 ___1.0 1904 __________ 0.0 _______ 1.0 ________ 4.0 ______ 2.0 _______ 1938 Feb 7 _____________________0.0 ___1.0 1905 __________ 0.0 _______ 2.5 ________ 0.5 ______ 1.0 _______ 1986 Sep 30 ___________________ 0.0 ___1.0 1906 __________ 0.0 ______ 10.67 _______0.0 ______ 0.0 _______ 2017 May 18 __________________ 2.0 ___1.0 1907 __________ 1.0 _______ 0.25 _______ 2.0 ______ 3.7 _________ 2023 ________________________ 1.0 ___2.0 1908 __________ 0.0 _______ 8.83 ________0.0 ______ 0.0 ________1966 Jul 12 ___________________ 4.0 ___0.5 1909 __________ 0.0 _______ 2.0 _________2.53 _____ 1.0 ________1930 Feb 19 __________________ 4.0 ___1.0 1910 __________ 0.0 _______ 1.33 ________0.0 ______ 1.0 ________ 1999 Jul 24 ___________________ 2.5 ___1.0 1911 __________ 0.0 _______ 0.33 ________5.0 ______ 1.83 _______ 1999 Jul 6 ____________________ 6.0 ___1.0 1912 __________ 0.33 ______ 0.0 _________1.0 ______ 1.83 _______ 2023 Apr 6 ___________________ 3.0 ___2.0 1913 __________ 0.33 ______ 3.0 _________1.0 ______ 1.0 _________ 2023 ________________________ 7.0 ___0.0 1914 __________ 0.83 ______ 0.0 _________2.67 _____ 8.83 ________2023 ________________________ 4.0 ___1.0 1915 __________ 4.0 _______ 1.0 _________1.5 ______ 1.25 ________ 2023 ________________________ 4.0 ___1.0 1916 __________ 6.0 _______ 2.5 _________3.83 _____ 2.0 _________ 2023 ________________________ 2.0 ___2.0 1917 __________ 1.25 ______ 2.0 _________7.0 ______ 6.33 ________ 2023 ________________________ 3.0 ___2.5 1918 __________ 2.0 _______ 2.83 ________6.0 ______ 6.0 _________ 2023 ________________________ 0.0 ___2.0 1919 __________ 2.0 _______ 0.0 _________3.5 ______ 7.0 _________ 2023 ________________________ 3.0 ___0.0 1920 __________ 2.0 _______ 0.0 _________2.0 ______ 5.5 _________ 2023 ________________________ 2.0 ___1.0 1921 __________ 2.5 _______ 0.0 _________1.0 ______ 0.0 _________ 2023 ________________________ 1.0 ___1.0 1922 __________ 1.0 _______ 0.0 _________0.0 ______ 1.0 _________ 2023 ________________________ 0.0 ___1.0 1923 __________ 2.5 _______ 1.0 _________3.0 ______ 5.0 _________ 2023 ________________________ 1.0 ___1.0 1924 __________ 0.0 _______ 0.0 _________3.67 _____3.83 ______ 1995 Jan 16 ___________________ 2.0 ___2.0 1925 __________ 4.0 _______ 2.0 _________3.33 _____5.67 _________ 2023 ________________________3.0 ___2.0 1926 __________ 0.0 _______ 1.0 _________3.0 ______ 6.33 ______ 2005 Aug 3 ____________________2.0 ___1.0 1927 __________ 4.0 _______ 1.0 _________1.25 _____ 2.5 _________ 2023 ________________________ 1.0 ___0.0 1928 __________ 4.0 _______ 3.0 _________0.5 ______ 1.5 _________ 2023 ________________________ 2.0 ___3.0 1929 __________ 3.0 _______ 0.0 _________0.33 _____3.53 ________ 2023 ________________________ 2.0 ___2.0 1930 __________ 1.5 _______ 2.5 _________1.5 ______ 5.33 ________ 2023 ________________________ 3.0 ___0.0 1931 __________ 7.08 ______ 2.0 _________0.33 _____ 0.0 _________ 2023 ________________________0.0 ___0.0 1932 __________ 3.0 _______ 2.0 _________ 0.5 ______ 3.5 __________ 2023 _______________________ 2.0 ___1.0 1933 __________ 5.58 ______ 0.0 _________2.33 _____ 3.5 _________ 2023 ________________________3.0 ___1.0 1934 __________ 1.0 _______ 0.0 _________3.5 ______ 3.5 _________ 2023 ________________________ 4.0 ___0.0 1935 __________ 0.5 _______ 1.0 _________3.5 ______ 0.0 _________ 2023 ________________________ 0.0 ___0.0 1936 __________ 2.5 _______ 1.0 _________0.0 ______ 5.0 _________ 2023 ________________________ 3.0 ___1.0 1937 __________ 1.0 _______ 1.0 _________0.83 _____ 0.0 _________ 2023 ________________________ 3.0 ___2.0 1938 __________ 2.0 _______ 2.5 _________2.0 ______ 2.0 _________ 2023 ________________________ 1.0 ___2.0 1939 __________ 2.0 _______ 1.0 _________0.0 ______ 0.33 ________ 2023 ________________________ 1.0 ___0.0 1940 __________ 1.75 ______ 0.0 _________5.0 ______ 5.5 _________ 2023 ________________________ 5.0 ___0.0 1941 __________ 5.0 _______ 2.5 _________0.0 ______ 0.0 _________ 2023 ________________________ 3.0 ___1.0 1942 __________ 1.0 _______ 0.0 _________1.0 ______ 1.33 ________ 2023 ________________________ 1.0 ___0.0 1943 __________ 0.5 _______ 3.5 ________ 2.17 _____ 3.17 ________ 2023 ________________________ 3.0 ___0.0 1944 __________ 6.5 _______ 0.0 _________0.0 ______ 0.0 _________ 2023 ________________________ 2.0 ___1.0 1945 __________ 5.0 _______ 0.83 ________5.0 ______ 4.2 _________ 2023 ________________________ 1.0 ___0.0 1946 __________ 5.5 _______ 3.5 _________2.0 ______ 0.7 _________ 2023 ________________________ 1.0 ___0.0 1947 __________ 2.0 _______ 1.5 _________1.33 _____4.5 _________ 2023 ________________________ 1.0 ___1.0 1948 __________ 4.0 _______ 4.5 _________0.5 ______ 0.0 _________ 2023 ________________________ 2.0 ___2.0 1949 __________ 7.58 ______ 3.83 _______ 0.0 ______ 1.0 _________ 2023 ________________________ 0.0 ___1.0 1950 __________ 4.0 _______ 1.0 _________1.33 _____ 2.17 ________ 2023 ________________________ 2.0 ___1.0 1951 __________ 3.5 _______ 2.0 _________1.0 ______ 0.33 ________ 2023 ________________________ 0.0 ___0.0 1952 __________ 2.5 _______ 4.0 _________0.83 _____ 0.0 _________ 2023 ________________________ 1.0 ___1.0 1953 __________ 8.0 _______ 2.0 _________0.5 ______ 2.0 _________ 2023 ________________________ 2.0 ___0.0 1954 __________ 3.5 _______ 3.0 _________1.0 ______ 1.5 _________ 2023 ________________________ 2.0 ___0.0 1955 __________ 4.83 ______ 0.0 _________0.0 ______ 1.0 _________ 2023 ________________________ 2.0 ___1.0 1956 __________ 3.0 _______ 2.33 ________2.33 _____2.0 _________ 2023 ________________________ 1.0 ___3.0 1957 __________ 1.0 _______ 2.83 ________1.5 ______ 1.5 _________ 2023 ________________________ 0.0 ___2.0 1958 __________ 0.0 _______ 0.0 _________3.5 ______ 0.0 _______ 1939 Oct 10 ___________________ 0.0 ___1.0 1959 __________ 1.5 _______ 5.5 _________1.33 _____ 0.0 _________ 2023 ________________________ 0.0 ___1.0 1960 __________ 0.5 _______ 0.0 _________1.25 _____ 3.0 _________ 2023 ________________________ 2.0 ___3.0 1961 __________ 3.5 _______ 1.0 _________1.0 ______ 1.5 _________ 2023 ________________________ 1.0 ___1.0 1962 __________ 1.33 ______ 0.0 _________5.33 _____1.17 ________ 2023 ________________________ 2.0 ___0.0 1963 __________ 4.0 _______ 0.0 _________3.25 _____ 6.5 _________ 2023 ________________________1.0 ___1.0 1964 __________ 2.5 _______ 1.33 ________2.0 ______ 3.5 _________ 2023 ________________________ 0.0 ___1.0 1965 __________ 1.0 _______ 2.0 _________2.0 ______ 1.33 ________ 2023 ________________________ 0.0 ___1.0 1966 __________ 6.83 ______ 4.5 _________0.0 ______ 1.5 _________ 2023 ________________________ 2.0 ___1.0 1967 __________ 3.0 _______ 2.5 _________4.0 ______ 3.0 _________ 2023 ________________________ 1.0 ___1.0 1968 __________ 0.0 _______ 0.0 _________2.5 ______ 3.33 ______ 1990 Nov 29 __________________ 3.0 ___0.0 1969 __________ 2.0 _______ 1.5 _________0.2 ______ 2.0 _________ 2023 ________________________ 1.0 ___1.0 1970 __________ 2.5 _______ 2.5 _________1.5 ______ 0.0 _________ 2023 ________________________ 2.0 ___1.0 1971 __________ 2.0 _______ 2.0 _________1.5 ______ 0.0 _________ 2023 ________________________ 2.0 ___0.0 1972 __________ 3.0 _______ 1.0 _________1.0 ______ 1.5 _________ 2023 ________________________ 6.0 ___1.0 1973 __________ 2.67 ______ 1.0 _________0.0 ______ 1.0 _________ 2023 ________________________ 4.0 ___0.0 1974 __________ 3.0 _______ 0.0 _________2.0 ______ 2.33 ________ 2023 ________________________ 4.0 ___0.0 1975 __________ 3.5 _______ 1.5 _________1.0 ______ 0.5 _________ 2023 ________________________ 3.0 ___0.0 1976 __________ 3.0 _______ 4.0 _________1.0 ______ 6.0 _________ 2023 ________________________ 2.0 ___0.0 1977 __________ 4.0 _______ 0.5 _________4.0 ______ 2.0 _________ 2023 ________________________ 4.0 ___0.0 1978 __________ 0.0 _______ 0.5 _________1.0 ______ 0.0 _______ 1982 Dec 4 ____________________4.0 ___1.0 1979 __________ 5.0 _______ 8.0 _________1.0 ______ 4.83 ________ 2023 ________________________ 4.0 ___1.0 1980 __________ 2.33 ______2.75 ________0.0 ______ 2.0 _________ 2023 ________________________ 4.0 ___0.0 1981 __________ 2.0 _______ 2.0 _________0.5 ______ 0.33 ________ 2023 ________________________ 3.0 ___1.0 1982 __________ 1.0 _______ 3.0 _________3.33 _____ 4.33________ 2023 ________________________ 2.0 ___1.0 1983 __________ 2.5 _______ 1.33 ________1.0 ______ 1.0 _________ 2023 ________________________ 9.0 ___1.0 1984 __________ 2.5 _______ 6.5 _________2.0 ______ 0.0 _________ 2023 ________________________ 6.0 ___1.0 1985 __________ 3.0 _______ 3.25 ________1.0 ______ 1.33 ________ 2023 ________________________3.0 ___0.0 1986 __________ 1.5 _______ 2.5 _________0.0 ______ 2.33 ________ 2023 ________________________ 1.0 ___0.0 1987 __________ 2.33 ______ 3.0 _________2.83 _____ 0.0 _________ 2023 ________________________ 1.0 ___1.0 1988 __________ 7.08 ______ 4.0 _________2.33 _____ 3.5 _________ 2023 ________________________ 2.0 ___0.0 1989 __________ 1.5 _______ 2.0 _________1.0 ______ 0.5 __________ 2023 ________________________ 6.0 ___3.0 1990 __________ 7.83 ______ 6.5 _________2.0 ______ 1.5 __________ 2023 ________________________ 3.0 ___1.0 1991 __________ 7.5 _______ 8.0 _________0.0 ______ 0.0 __________ 2023 ________________________ 2.0 ___1.0 1992 __________ 0.0 _______ 0.5 _________2.2 ______ 0.0 _______ 1964 May 23 __________________ 2.0 ___0.0 1993 __________ 5.0 _______ 3.0 _________0.0 ______ 2.0 _________ 2023 ________________________ 2.0 ___1.0 1994 __________ 1.33 ______ 0.0 _________2.0 ______ 3.0 _________ 2023 ________________________ 3.0 ___1.0 1995 __________ 2.0 _______ 4.5 _________0.0 ______ 0.25 ________ 2023 ________________________ 6.0 ___0.0 1996 __________ 2.0 _______ 3.0 _________1.2 ______ 1.0 _________ 2023 ________________________ 3.0 ___3.0 1997 __________ 3.0 _______ 0.0 _________0.0 ______ 0.33 ________ 2023 ________________________ 1.0 ___0.0 1998 __________ 7.0 _______ 6.5 _________0.0 ______ 0.0 _________ 2023 ________________________ 4.0 ___0.0 1999 __________ 3.58 ______2.5 _________0.0 ______ 0.5 _________ 2023 ________________________ 2.0 ___0.0 2000 __________ 3.5 _______ 4.0 _________3.5 ______ 0.0 _________ 2023 _______________________ 2.0 ___1.0 2001 __________ 9.17 ______2.83 ________0.0 ______ 0.5 _________ 2023 ________________________ 0.0 ___0.0 2002 __________ 4.0 _______ 9.0 ________ 0.0 ______ 0.5 _________ 2023 _______________________ 3.0 ___0.0 2003 __________ 1.0 _______ 0.0 _________1.17 _____ 0.17 ________ 2023 ________________________ 5.0 ___5.0 2004 __________ 0.0 _______ 0.0 _________0.33 _____ 0.5 _______ 1979 Nov 25*________________ 2.0 ___0.0 2005 __________ 2.0 _______ 5.5 _________1.0 ______ 0.0 _________ 2023 ________________________3.0 ___2.0 2006 __________ 3.5 _______ 4.0 _________0.0 ______ 0.0 _________ 2023 ________________________3.0 ___1.0 2007 __________ 3.0 _______ 2.0 _________2.0 ______ 0.0 _________ 2023 ________________________5.0 ___0.0 2008 __________ 3.0 _______ 2.0 _________0.0 ______ 0.0 _________ 2023 ________________________3.0 ___1.0 2009 __________ 2.0 _______ 2.5 _________2.33 _____ 0.0 _________ 2023 _______________________ 0.0 ___1.0 2010 __________ 3.5 _______ 4.25 ________0.0 ______ 0.0 _________ 2023 _______________________ 2.0 ___3.0 2011 __________ 3.5 _______ 5.5 _________0.0 ______ 0.0 _________ 2023 ________________________ 4.0 ___3.0 2012 __________ 2.0 _______ 5.0 _________0.25 _____ 0.0 _________ 2023 _______________________ 1.0 ___2.0 2013 __________ 2.0 _______ 4.0 _________1.5 ______ 0.0 _________ 2023 ________________________4.0 ___0.0 2014 __________ 0.0 _______ 1.5 _________0.0 ______ 1.0 _______ 1979 Nov 25 __________________ 5.0 ___2.0 2015 __________ 6.0 _______12.92 _______0.5 ______ 1.0 _________ 2023 ________________________ 2.0 ___2.0 2016 __________ 3.0 _______ 3.5 _________0.0 ______ 1.0 _________ 2023 ________________________ 2.0 ___1.0 2017 __________ 3.33 ______12.67 ______ 0.25 _____ 2.0 _________ 2023 ________________________ 2.0 ___1.0 2018 __________ 3.0 _______ 9.75 _______ 0.0 ______ 0.0 _________ 2023 ________________________ 1.0 ___4.0 2019 __________ 1.0 _______ 0.5 _________1.5 _______ 2.5 _________ 2023 ________________________ 0.0 ___0.0 2020 __________ 4.5 _______ 5.5 _________0.0 ______ 2.0 _________ 2023 ________________________2.0 ___0.0 2021 __________ 2.0 _______ 5.0 _________1.5 ______ 0.0 _________ 2023 ________________________ 6.0 ___1.0 2022 ___________2.0 _______5.0 _________ 1.0 ______ 0.0 _________ 2023 _______________________ 2.0 ___ 1.0 2023 __________ 3.83 ______5.33 ________0.0 _____ 0.0 __________ 2023 _______________________ 3.0 ___ 0.0 2024 ___________ 2.50 _____ 2.0 _______ -- -- _____ -- -- _______ -- -- _________________________ 3.0 ___ 0.0 2025 ___________ 1.83 _____ 4.0 _______ 1.0 _____ 0.0 __________ -- -- _________________________ 2.0 ___ 0.0 2026 ___________ -- -- ___ -- -- _______ -- -- ____ -- -- ________ ---- ___ 2.0 * becomes 1972 Mar 2 if 2014 and 2004 both entered as starter years to determine extinction since 2014 had higher Nov 25 temp than 2004. (years with no records, 1958, 1992, 2004, 2014 have their extinction dates calculated from last record to surpass their close readings as determined by treating them as starter years to establish near-records. On Feb 17th 2022, 1976 lost one high max and 1981, 2011 lost 0.5 high min each. =================================================================== COUNT TOTALS by DECADES Decade ______ High max _ High min ___ Low max _ Low min ____ Prec __ Snow 1869-70 _______ 0.0 _______ 1.0 _________ 8.33 ______ 4.0 _________2.0 ___3.0 1871-80 _______10.0 ______ 6.0 _________71.5 _______68.36 _______21.0___16.0 1881-90 _______ 7.0 ______10.17 ________ 63.5 ______53.42 ______ 26.0___ 16.0 1891-1900 ____16.75 ____ 26.33 _______ 33.2 ______ 23.41 _______17.0___ 16.0 1901-10 _______ 2.5 ______ 31.07 ______ 20.28 ______ 11.7 ________23.0___ 8.5 1911-20 _______18.41 ____ 11.67 _______ 33.5 _______ 41.57 _______34.0___12.5 1921-30 _______22.50 ____ 10.5 _______ 17.58 ______ 34.69 _______17.0___13.0 1931-40 _______26.42 ____ 10.5 _______ 18.0 _______ 23.33 _______22.0___ 7.0 1941-50 _______41.08 ____ 21.16 _______ 13.33 _____ 17.07 ________16.0___ 7.0 1951-60 _______28.33 ____ 21.66 ______ 13.24 _____ 11.33 ________10.0___12.0 1961-70 _______26.66 ____ 15.33 ______ 21.78 _____ 23.83 ________13.0___ 8.0 1971-80 _______28.50 ____ 21.25 ______ 12.50 _____ 20.16 ________37.0___ 2.0 1981-90 _______31.25 ____ 34.08 ______ 16.0 ______ 14.82 ________ 36.0___ 9.0 1991-2000 _____34.91 ____ 32.00 ______ 8.9 _______ 7.08 _________ 27.0___ 7.0 2001-10 _______31.17 ____ 32.08 _______ 6.83 ______ 1.67 _________ 26.0___12.0 2011-20 _______28.33 ____ 60.84 _______ 4.0 ______ 9.5 __________23.0___15.0 2021-26 _______12.17 ____ 20.33 ________ 3.5 _______0.0 ___________16.0 ___ 4.0 =========================================================================== May 28-29 2021 took 1.5 low max records from 1884, and 1 daily precip record from 1906. Those changes are reflected in the tables above. Three new record high minima set in summer 2021 (one a tie with 1948, two others replaced records from 1870 and 1883, changes reflected in the tables above). Also a new record high for Dec 11 taking one away from 1879, reflected above. And records set on Feb 17 2022 took one max away from 1976 and a shared min from 1981, 2011. Records in March tied those set in 1935 and 1946 on 6th and 7th. Records in Nov took one high min from 1938 and one half share from 2015 Also taken were 0.5 shares in record high max 1948 and 2015. Dec 2022 high min took 0.5 shares from 1951 and 1956. Those changes are incorporated into the table. 2023 to 2026 changes are also in the table. Below is a graph showing the extinction dates of the 153 years, many are at 2021 meaning they still have intact record highs. Note the shift around 1910 from a regime where most years eventually lose their records, to a regime where maintaining records is normal. After 1926, only two years (1968, 1978) failed to keep at least one record set (and four others failed to set one).
-
The decade of 1941-50 set more surviving record highs than any other decade ending in a zero (41.08), and the years 1944-53 have the highest ten-year count (50.41), ahead of 1993-2002 (40.74), with a third more recent maximum 29 for 2006-15. By 1956-65 the ten-year count had declined to under twenty and it only recovered gradually through the 1970s and 1980s. The decade had a total record count of 99.50 from 117 total records including 23 ordinary ties and 9 three-way ties, and set records on 106 days of the year (a few were cases of more than one year participating), with twenty-nine of those being no more than ties of earlier records (eight untied records, two tied once and one tied three times were broken within the decade), so that the count for the decade was 90.17, about twice what one would expect at random for years 73 to 82 of the data set (that being around 45). The decade produced four shared or outright monthly maxima, October (94F in 1941), March (86F in March 1945 later tied in 1998) and two in 1950 (Jan 72F later tied in 2007, and November 84F). Other notable warm spells were in August of 1944, 1948; October 1947; both March 1945 and 1946 which were very similar and near the top of the March average rankings, June 1943, and frequent spells in both 1941 and 1949. There were some brief cold spells in the decade but it is largely remembered for setting warmth records. 1941 _ The year 1941 had a very warm spring and rather warm summer and autumn, after a fairly average sort of winter (1940-41). The warmth continued into December before fading near the end of the month and year. The year produced 15 record highs with three ties for a count of 12.50 (expected 5.0, ratio 2.50). Of these five have survived for a survival rate of 40.0%. The average increase of 1941 records over previous marks was 2.5 F deg. The average year breaking ten records was 1971, but that would change to 1986 if all five surviving records fell within the next year. The average surplus of eventual records to ten broken from 1941 is 4.3 F deg but this falls to 2.8 F deg counting the five surviving records. No surviving record low maxima exist. Two were set during the year (61F on June 13th, 64F on July 4th) but both have since been broken, the second just once (1978, 62F). There are likewise no surviving record low minima. One was set on Aug 14th (55F) and later broken on that date in 1964 (54F) which becomes the extinction date for 1941 record low minima. Three of the original count of 5.0 record high minima have survived (count 2.50), 67F on April 15 between two record highs, 69F (tied 1980) on May 23, 76F on June 22, Minima during the very warm spell in October failed to break records set in 1898 (first two) or 1910, although the minimum on the 5th (71F) was equal to the 1910 record for the 6th and as noted below was tied second warmest for the date with 1910. It made the mean temperature for the date 82.5, highest for October. Temp ___ date ___ replaces _ ties ________ broken ___ eventual end of data record max, recent max _85F ___ Apr 14 ___ 1880 (80F) ___________2023 (91F) __ 2023 (91F) __ also 1945 3rd (83F), 1880 4h (80F), 1949 5th (79F), 1938, 2018 t6th (77F), 1960 8th (76F)). _87F ___ Apr 15 ___ eventual record .. (1938 2nd (84F), 1960 3rd (83F), 2002 4th (82F), 2003 5th (81F), 2006 6th (80F), 1896 7th (79F)). _86F ___ Apr 30 ___ 1903 (82F) _________ 1942 (91F) __ 1942 (91F) __ (1941 2nd (86F), 1985 3rd (84F), 1903 4th (82F), 1901,10,44,65,2007 t5th (80F)). _96F ___ May 22 ___ eventual record .. (1992 2nd (93F), 1959 3rd (91F), 1991 4th (90F), 1914,21,34 t5th (89F), 1944,74 t8th (88F)). _96F ___ June 22 __ 1921 (95F) _________ 1988 (98F) __ 1988 (98F) ___ (1941 2nd (96F), 1921 3rd (95F), 1943 4th (94F), 1888 5th (93F)). _94F ___ June 27 __ 1875,76,80,1900 (92F)_ 1943 (98F) __ 1966 (101F) ___ (1943 2nd (98F), 1963,83 t3rd (95F), 1941 5th (94F)). _95F ___ Aug 8 _____________ 1896 (95F) _ 1980 (96F) __ 2001 (99F) ___ (1980 2nd (96F), 1896,1941,1983 t3rd (95F), 1916,18,79 t6 (94F)). _93F ___ Aug 26 ____________ 1900 (93F) _ 1948 (103F) _1948 (103F)__ (1993 2nd (96F), 1980 3rd (95F), 1900,41 t4th (93F)). _91F ___ Sep 17 ____________ 1915 (91F) __ 1972 (92F) __1991 (93F) __ (1972 2nd (92F), 1915,41 t3rd (91F), 1942 5th (90F)). _88F ___ Oct 4 ___ eventual record .. (1959, 2013 2nd (86F), 1891, 1967, 1983, 2007 t4th (84F), 1954 8th (83F)). _94F ___ Oct 5 ___ eventual record .. (1922 2nd (89F), 1891, 1967 t3rd (86F), 1931,51 t5th (84F). 2007,17 (83F)). [Oct monthly max] _90F ___ Oct 6 ___ eventual record -- (1959 2nd (88F), 1946 3rd (87F), 1931,95 t3rd (86F), 1910,90 t5th (84F), 2007 7th (83F)). _66F ___ Nov 14 ___ 1937 (64F) __________ 1951 (67F) __1993 (72F) __(1973,80 t2nd (71F), 1989 4th (70F), 2011 5th (69F), 1955 6th (68F), 1951,59,78 (67F)). _61F ___ Dec 24 ___ 1891 (60F) __________ 1990 (63F) __ 2015 (72F) __ (1990,96 t-2nd (63F), 1941 4th (61F), 1891 5th (60F)). 5.0 record high minima, 2.5 have survived. _67F ___ Apr 15 ___ eventual record high minimum __ 1960 (62F), broke 1896 (61F), recent 2002 (59F) _64F ___ Apr 16 ___ 1896 (63F) __________ 2002 (69F) __ 2002 (69F) __ also 2012 (65F), 1969, 2017 (59F) _59F ___ Apr 29 _____________ 1888 (59F) __1956,83 (63F) _ 2017 (64F) __ also 1957 (62F), 1974 (61F) _69F ____ May 23 ___ eventual record high minimum later tied by 1980 __ broke 1880 (68F), also 2021 (68F) _76F ___ June 22 ___eventual record high minimum __ broke 1909 (75F), recent 1988 (75F), also 1908,97 (74F) _71F ___ Oct 5 ___ not a record in 1941 (1898 _ 74F) but tied with 1910 second highest for date (with max 94F) _48F ___ Dec 3 ______________ 1932 (48F) __ 1970 (49F) __ 1998 (59F) __ also 1982 (58F), 2009,12 (49F) (a reminder that in these tables of high minima, underlined "also" entries are warmest recent (1980 to present) -- if that occurs within the earlier portion of the entry, it is not underlined there (e.g. 1998 above Dec 3 was record while 1988 June 22 is underlined as recent high min. Lower recent contenders are not underlined. ++++++++++++++++++++++++________________________________________________+++++++++++++++++++++++++++++ 1942 _ The year 1942 was somewhat closer to average and its main warm intervals came in April and November. The year set seven new records, two ties reduced the count to 6.00. Of those, one (Apr 30) has survived, a rate of 16.7%. The average amount by which these 1942 records increased previous values was 1.9 F deg. The average year breaking six 1942 records was 1977, which changes to 1984 if the April 30 record goes in 2022. The average surplus of eventual records to the 1942 marks is 4.6 F deg. There was one surviving record low maximum, 37F on April 10th. A second record set in 1942 (Jan 8, 14F) was broken by one degree in 1968 (13F). A value of 8F on Dec 20th was one higher than a record set in 1884 and remains second coldest for that date. From an original count of 2.33 record low minima, there were two surviving record low minima, including a one-third share of 42F on Sep 29, and -4F on Dec 20 (count 1.33). A record set on Jan 8th (5F) was later broken in 1968 (2F). The year has no surviving record high minima after setting 4.417 during the year. The extinction date for those is June 12, 2015. Temp ___ date ___ replaces _ ties ________ broken ___ eventual end of data record max, recent max _69F ___ Mar 8 ___ 1878 (65F) ___________ 1987 (76F) __ 1987 (76F) __ (2012 2nd (71F), 2016 3rd (67F), 1878 4th (65F), 2009 5th (64F)). _84F ___ Apr 26 ___1872 (83F) ___________ 2009 (92F) __ 2009 (92F) __ (1942 2nd (84F), 1872, 2011 t-3rd (83F), 1970 5th (82F), 1925,69,85 t6th (80F)). _91F ___ Apr 30 __ eventual record .. (1941 2nd (86F), 1985 3rd (84F), 1903 4th (82F), 1901,10,44,65,2007 t5th (80F)) _83F ___ May 4 ___ 1919 (82F) ___________ 1944 (85F) __ 2001 (92F) __ (1965 2nd (90F), 1963 3rd (86F), 1944, 2015 t-4th (85F), 2018 6th (84F), 1942,49 t-5th (83F)). _92F ___ May 30 ______________1871 (92F) _1986 (94F) __1987 (97F) __ (1986 2nd (94F), 1871,1942 t3rd (92F), 1931 5th (91F), 1895,1969,1991,2013 t6th (90F)). _95F ___ July 14 ___ 1936 (93F) ___________ 1952 (96F) __1954 (100F) _ (1952, 1995 t2nd (96F), 1942,66,74 t4th (95F), 1983,97 t7th (94F)). _74F ___ Nov 20 ______________ 1934 (74F) _1985 (77F) __1985 (77F) ___ (1934,42,48,91 t2nd 74F), 1913,41 t-6th (72F), 1953 8th (71F)). Record high minima (4.417), none have survived, extinction date is June 12, 2015 _43F ___ Jan 19 ___ 1876,80,1933 (40F) ___ 1973 (44F) __ 1986 (45) ___ also 2010 (40F) _40F ___ Jan 24 ________ 1909,13,14 (40F) ___ 1950 (41F) __ 1967 (54F) __ also 1953 (49F), 2002 (45F) _49F ___ Apr 7 ______________1908 (49F) ___ 1954 (53F) __ 1991 (63F) __ also 2010 (56F) _68F ___ May 4 ___ 1878 (65F) ____________ 2001 (71F) __ 2018 (72F) __ also 1895, 2010 (62F) _64F ___ May 13 ______1879, 1906 (64F) ___ 1956 (69F) __ 1956 (69F) __ also 1985,91 (66F) _64F ___ May 14 ___ not a record in 1942 (or tied 1944) _ record was 1909 _ 65F _72F ___ June 12 __ 1880,98,1914,39 (71F) __ 2015 (73F) __ 2017 (74F) __ 1942 later tied with 1973,97 (72F) _62F ___ Oct 22 __________ 1935,36 (62F) ___ 1979 (67F) __ 1979 (67F) __ also 2020 (64F), 1984 (62F) +++++++++++++++++++++++ ______________________________________ +++++++++++++++++++++++++++++++ 1943 _ A rather cold first five months were followed by a hot June, but the rest of 1943 was rather average most of the time. The year set only five record highs, a bit more than its random expectation of 4.87. Of these, one has survived with a later tie (June 25, tied by 1952). This is a count of 0.50 and a survival rate of 10%. The average amount by which 1943 broke previous records was 2.2 F deg. We now see a year that broke mostly non-starter records (four of five). The average year breaking four 1943 records was only 1953, which changes to 1967 if the June 25 record falls this year. The average surplus of eventual records to 1943 values was 3.25 F deg which reduces to 2.6 F counting the surviving record. 1943 had shares in four eventual record low maxima, but with one ordinary tie and two three-way ties, the count was only 2.17. (a reminder, random expectation here is 2.4 since we are discussing surviving records), and the most noteworthy was 8F on Feb 15th. The year set five record low minima, including a benchmark -8F also on Feb 15th (no later readings in the first part of the calendar year this low, and the third lowest temperature recorded at NYC, only 1917 and 1934 have colder records (Dec 30 and Feb 9). This was a brief cold spell that quickly reverted to near-record warmth in the low 60s for several days. Later in the year, 1943 was part of a six-way tie for March 3rd (11F), and holds the record for April 15 (28F), July 1 (52F) after a week of record heat, this was July's lowest minimum in the data set, and 1988 hit 53F on this date after similar heat earlier. It's interesting that even with the urban heat island well advanced by 1943 (and more so by 1988) these July 1st minima were colder than anything recorded in the 1869-1900 era in July. The only other July minimum of 53F occurred in 1979. The total count for these four records is 3.17. The only loss of records set during the year was the further three ties for March 3rd as the count was 3.33 during the year itself, a survival rate of 95%. The June heat wave produced two surviving record high minima, but before those, June 3 and 4 also produced record high minima of 75F and 78F. Then 76F on 27th set another record, and 77F on 28th tied 1876. A reading of 78F on 25th (tying 1904) fell to 81F in 1952. The count is 3.50 from the original 6.33. Temp ___ date ___ replaces _ ties ________ broken ___ eventual end of data record max, recent max _99F ___ June 25 __ eventual record tied later by 1952 .. (1923 3rd warmest (97F), 1963 4th (95F), 1870,80,98 t-5th (94F)). 1997 (93F).) _96F ___ June 26 ___ 1923 (94F) ___________ 1952 (100F) _ 1952 (100F) __ (1943,49,63 t2nd (96F), 1950 5th (95F), 1923 6th (94F)). _98F ___ June 27 ___ 1941 (94F) ___________ 1966 (101F) _ 1966 (101F) __ (1943 2nd (98F), 1963,83 t3rd (95F), 1941 5th (94F)) _94F ___ Aug 25 ___ 1893,1900 (93F) ______ 1948 (95F) __ 1948 (95F) __ (1943,69,93 t-2nd (94F), 1893,1900,68,80 t-5th (93F)). _83F ___ Oct 7 ____ 1912,27,39 (81F) ______ 1944 (88F) __ 1944 (88F) __ (1946,61 t-2nd (86F), 1943,63 t-4th (83F), 1990,2007 t-6th (82F)). Record high minima (6.33), 3.50 have survived _41F ___ Feb 5 ____ 1909 (37F) ____________ 1991 (51F) __ 1991 (51F) __ also 2019 (44F) _45F ___ Feb 23 ___ 1875 (42F) ____________ 1985 (55F) __ 1985 (55F) __ also 1990 (55F), 1975 (44F) _75F ___ June 3 ___ eventual record high minimum __ broke 1877 (70F) also 1960 (70F), recent 1985,90 (68F) _78F ___ June 4 ___ eventual record high minimum __ broke 1925 (76F), recent 2010 (72F) _78F ___ June 26 ______________ 1904 (77F) __1952 (81F) __ 1952 (81F) __ 2003 (79F), 1949 (77F) _76F ___ June 27 ___ eventual record high minimum __ broke 1894,1901,1909 (74F), recent 1999 (75F) _77F ___ June 28 ___ eventual record high minimum tied 1876 __ also 1880, 1966, 2010, 2021 (76F) _62F ___ Oct 15 ____________ 1915,38 (62F) __ 1955 (63F) __ 2014 (69F) __ also 1975 (66F), 1960 (65F) +++++++++++++++++++++++++++++++_________________________ ---------------------------------------------- 1944 _ The year 1944 is mainly noteworthy for severe heat in August that lasted about two weeks setting frequent records, most of which have survived. Most other months were either near average or occasionally slightly warmer than average but not so warm as to produce a lot of record highs. Twelve days set records but three were ties (one ordinary, one three-way) for a count of 10.17. Seven of these have survived, one being tied in 2015, for a count of 6.50. That is a survival rate of 63.9%, the highest so far encountered, and not surpassed until 1953 (84.2%). These records surpassed earlier marks by an average of 2.5 F deg. The five broken 1944 records were broken by 1973 on average, but that changes to 2001 if the seven surviving records fall later this year. Five 1944 records have been surpassed by an average of 4.4 F deg, but this reduces to 1.8 F if the seven unbroken ones are included. The year set no surviving low maximum records and none even within the year. In that regard, it was the third such year after 1936 and 1939. Nor were there any low minimum records, with the one tied record (50F June 5th) being broken the next year by 1945's eventual record low of 47F (so this is also the extinction date for 1944 record low minima). With the count of 0.5 for the year, 1944 was tied with 1931 at second lowest (1908 had zero) until 1948 also had zero during the year. Surprisingly, there were also no surviving record high minima. The long August heat wave must not have been very humid because minima consistently dropped to the low to mid 70s, while earlier records already set in many cases were in the high 70s or even low 80s. It was oppressive enough with the lowest reading August 11-17 being 73F. (highest min was 77F on the 14th). However the year had set 2.33 records and one (64F) was only surpassed on May 5, 2015 at 66F (after being tied in 2006 at 64F). A third share on June 17th (73F) lasted one year and the record of 65F on Oct 7th lasted only until 1955 (66F) eventually bettered by 2005 at 70F. So the extinction date for 1944 high minimum records was May 5, 2015. This was a month earlier than 1942's extinction. Temp ___ date ___ replaces _ ties ________ broken ___ eventual end of data record max, recent max _85F ___ May 4 ___ 1942 (83F) __________ 1963 (86F) __ 2001 (92F) __ (1965 2nd (90F), 1963 3rd (86F), 1944, 2015 t-4th (85F), 2018 6th (84F), 1942,49 t-5th (83F)) _94F ___ July 25 __________1873,85 (94F) _1987 (95F) __ 1999 (97F) __ (1987 2nd (95F), 1873,85,1944 t3rd (94F)). _100F ___ Aug 4 ___ eventual record .. (1993,1995 t2 (96F), 1936,55,2005 t4 (95F), 1888,1928,1987 t7 (94F)). _101F ___ Aug 5 ___ eventual record .. (1955 2nd (100F), 2005 3rd (98F), 1930 4th (96F), 1918,31,2010 t-5th (95F)). _102F ___ Aug 11 __ eventual record .. (1949 2nd (99F), 2005 3rd (97F), 1896,1900 t-4th (96F), 1988 6th (95F)). _97F ___ Aug 12 ___ eventual record .. (2002,05 t-2nd (96F), 1988,95 4th (94F), 1896,2016 t-6th (93F), 1872,91,1907,29 t-8th (92F)). _96F ___ Aug 13 ____________ 1881 (96F) _ 2002 (98F) __ 2005 (99F) __ (1881,1944,1988,2016 t-3rd (96F), 1947 7th (95F)). _96F ___ Aug 16 ___ eventual record .. (1938 2nd (95F), 1888 3rd (94F), 1970,1997,2002,2015 t4th (93F)) _95F ___ Aug 17 ___ eventual record tied later by 2015 .. (1922,1987,2002 t3rd (94F), 1913,59,97 t-6th (93F), 1937,56, 2009 t-9th (92F) _97F ___ Sep 2 ___ 1929, 32 (96F) ______ 1953 (102F)_ 1953 (102F) __ (t 2nd 1944 (97F), t3rd 1929,32,80 (96F), t5 1921, 2010 (94F)). _90F ___ Sep 5 __________ 1884,98 (90F) _1961 (93F) __ 1985 (94F) __ (1961 2nd (93F), 1983 3rd (91F), 1884,98,1944,59,70,71 t-3rd (90F)). _88F ___ Oct 7 ___ eventual record .. (1946,61 t-2nd (86F), 1943,63 t-4th (83F), 1990,2007 t-6th (82F) 1912,27,39,2017 t-8th (81F)). Record high minima (2.33), none have survived, extinction date is May 5, 2015 _64F ___ May 5 ___ 1896 (62F) _________ 2015 (66F) __ 2015 (66F) __ 1944 later tied by 2006 (62F) _73F ___ June 17 _____ 1892, 1905 (73F) _1945 (74F) __ 1957 (77F) __ 1967 (74F), 2000,04 (72F) _76F ___ Aug 17 ___ not a record in 1944 (1888 _ 77F), closest to a record in long August 1944 heat wave _65F ___ Oct 7 ____ 1903,36 (64F) ______ 1955 (66F) __ 2005 (70F) __ also 2007,18 (67F), 2017 (66F) ________________ 1945 _ After a cold January, the spring turned very warm and set numerous records until around mid-April when the trend went in the other direction, and frequent cold records were set into early June. (After two records were set Apr 12-13, the 14th was a warmer day at 83F but had already been beaten by 1941 (85F)). The rest of the year alternated between near normal and somewhat warmer than average spells and there were a few more records set in the autumn before a cold December spell set in. With a total of 18 records, including five ordinary ties and two three-way ties, the count was 14.17, roughly three times random expectation (4.68). After 1945, only 1949 held more records at the end of its run. The survival rate is 35.3% for the five untied (four in March) survivors which include a monthly maximum of 86F (29th, later tied 31st 1998). 1945 records surpassed earlier marks by an average of 2.2 F deg, and the 13 since broken were overtaken on average by 1964. This would change to 1980 if the five surviving records fell by this time next year. The 13 records broken have been surpassed by an average of 6.8 F deg by eventual records, which falls to 4.9 F deg counting the five surviving records. There were also six record low maxima, with two ties reducing that count to 5.00, so 1945 reaches the end of the series with equal counts. Four records fell June 1st to June 5th and 52F on June 4th is tied with 2nd 1907, 1946 as the lowest for any June day (and a benchmark being later than those). Others include a share of Aug 24th and 57F on Sep 17th. There were five record low minima, again most of them in early June, one also in January (2F on 25th). 44F on June 1st was the June monthly minimum also. The count was 4.20 with one five-way tie entered. As 1945 was the fourth year to enter that tie (1946 completed the set of five), and there were no other 1945 low minimum records that have not survived, the survival rate for the count of 4.25 is 98.8%, ranked fourth so far behind three years with 100% survival rates (1891, 1910, 1932). It would remain fourth until 1949 joined the 100% group (and also 1953, 1955). However as 1945 had more records than any of the years mentioned, it can be seen as the most robust year for maintaining record lows. Two other values (53F Aug 24th, and 38F on Oct 4th, tied 1974) came within one degree of breaking records established in 1888 and 1890, and those would probably have succeeded without the much larger (by 1945) urban heat island. Two others were within 1F of records set in 1926. There were three record high minima in 1945, but none from March have survived. Readings of 59F, 60F and 58F March 28-30 all survived until 1998 (63F, 62F, 59F). Earlier March candidates fell to years such as 1948 and 1990. April 13th had more luck, 61F surviving 60F lows in 1977 and 2018 but falling to 67F in 2023. June 15 and 30 have tied values and the count for three days with shares is 1.83, all that remains of the original count of 11.5 which is higher than most later years (1948, 2015 and 2017 were higher) and twice the expected number at random. Although no records were set in the autumn, three notable near misses are included in the table below. Temp ___ date ___ replaces _ ties ________ broken ___ eventual end of data record max, recent max _63F ___ Mar 15 _____________ 1913 (63F) _ 1983 (68F) __ 1990 (77F) ___ 1913, 1945 later tied by 1971 _75F ___ Mar 17 __ eventual record .. (1990 2nd (72F), 1989 3rd (70F), 2003 4th (69F), 1927,35 t5th (67F)). _83F ___ Mar 20 __ eventual record .. (1921 2nd (78F), 2020 3rd (77F), 2010 4th (74F), 2012 5th (73F), 1976 6th (72F)). _74F ___ Mar 27 ___ 1914,39 (73F) _________ 1949 (75F) __ 1998 (83F) ___ (2007 2nd (78F), 1949 3rd (75F), 1945, 1985 t-4th (74F)). _84F ___ Mar 28 __ eventual record .. (1921 2nd warmest (82F), 1998 3rd (80F), 1946 4th (79F), 1985 5th (78F)). _86F ___ Mar 29 __ eventual record .. (1985 2nd (82F), 1977,1998 t-3rd (81F), 1946 5th (78F)) [monthly max later tied 31st 1998] .* _75F ___ Apr 3 ______________ 1892 (75F) _ 1967 (76F) __ 1981 (81F) __ (2002 2nd (77F), 1967 3rd (76F), 1892, 1945 t4th (75F)). _73F ___ Apr 12 ___ 1889 (68F) ___________1947 (78F) __ 1977 (90F) ________ 1996 (80F). _81F ___ Apr 13 ___ 1890 (79F) ___________ 1968 (82F) __ 1977 (88F) ___ (1968, 2018 t-2nd (82F), 1945 4th (81F), 1890 5th (79F), 2006 6th (78F)). _93F ___ June 17 ________1892, 1939 (93F) _1952 (95F) __1957 (96F) _ (1892,1939,1945 t3rd (93F), 1891,1929 t6th (92F), 1944,2017 8th (91F)). _97F ___ June 30 ___ 1901,31 (95F) _______ 1964 (99F) __ 1964 (99F) __ (1945 2nd (97F), 1901,31 t3rd (95F), 1906,66,68 t5th (94F)). _93F ___ Aug 29 _____________ 1926 (93F) _1948 (95F) __ 1953 (99F) ____ 1926, 1945 (93F) t5, 1948t1973 t2, 2010 (94F) 4th. _88F ___ Sep 29 ___ eventual record .. (1921 2nd (86F), 1923,48 t-3rd (84F), 1952,53,59,2015 t-5th (83F), 1884,91 t-7th (82F)). _80F ___ Oct 19 ___ 1928 (79F) __________ 1963 (83F) __ 2016 (85F) __ (1963 2nd (83F), 1965 3rd (81F), 1945 4th (80F), 1928 5th (79F)). _71F ___ Oct 29 ________ 1918,35 (71F) ___ 1946 (77F) __ 1971 (78F) __ (1946 2nd (77F), 1989 3rd (76F), 1984 4th (74F), 2015 5th (73F)). _76F ___ Oct 31 ___________ 1933 (76F) ___ 1946 (81F) _ 1946,2024 (81F) __ (1933,45,50,61 t3rd (76F), 1919 7th (74F), 1942,94 t8th (73F)) _72F ___ Nov 8 ___ 1938 (71F) ___________ 1975 (76F) __ 1975 (76F) __ (2020 2nd (75F), 1945 3rd (72F), 1938 4th (71F)). _72F ___ Nov 9 ____________1895 (72F) ____1975 (75F) __ 1975,2020 (75F) _ (1986 3rd (73F), 1895,1945,1950 t4th (72F), 1916 7th (71F)) . * Mar 29 previous high 76F 1910. Record high minima (11.5), end of data 0.83 survived _49F ___ Mar 16 ___ 1921 (43F) ________ 1948 (52F) __ 1990 (55F) __ also 2000 (51F), 1973 (49F), 2016 (48F) _49F ___ Mar 19 ___ 1894,1898 (48F) ___1983 (52F) __ 2012 (55F) __ 2010 (49F) _59F ___ Mar 28 ___ 1905 (53F) ________ 1998 (63F) __ 1998 (63F) __ 1945 later tied by 1985 (59F), 1985 (56F) _60F ___ Mar 29 ___ 1907 (58F) ________ 1998 (62F) __ 1998 (62F) __ also 1946 (57F), 1985 (55F) _58F ___ Mar 30 ___ 1936 (53F) ________ 1998 (59F) __ 1998 (59F) __ also 1977,81 (56F), 1910 (51F) _51F ___ Mar 31 ___ 1910 (48F) ________ 1962,81 (57F) _1998 (66F) __ also 1986 (60F), 1945 later tied by 1960 (51F) _49F ___ Apr 1 ___ not a record in 1945 (record then was 51F in 1918) _54F ___ Apr 2 _____ 1933 (50F) _________1967 (61F) __ 1967 (61F) __ also 1955 (53F), 1981,86 (52F), 2000 (51F) _57F ___ Apr 12 ____ 1889 (55F) _______ 1947, 2017 (58F) _ 1947,2017 (58F) _ also 1948 (56F), 1996 (55F). _61F ___ Apr 13 ___ 1886 (53F) _________ 2023 (67F) _ 2023 (67F) __ also 1977, 2018 (60F), 2019 (59F). 2002,06 (55F) _76F ___ June 15 ___ eventual record high minimum tied 1899, 1956 __ also 1988 (74F), 1902,87 (73F), 2004 (72F) _74F ___ June 17 ___ 1892, 1905,1944 (73F) _1957 (77F) __ 1957 (77F) __ 1967 (74F), 2000,04 (72F) _79F ___ June 30 ___ eventual record high minimum later tied by 1959 __ 2012 (77F), broke 1908 (76F), 1872,1906,2001 (75F) _70F ___ Sep 25 ___ not a record in 1945 (record was 1881, later tied by 1970 _ 71F) _62F ___ Nov 9 ____ not a record in 1945 (record was 1895 _64F, 1945 second highest value) _57F ___ Nov 13 ___ not a record in 1945 (record was 1909 _ 59F, 1945 second highest value) ______________________________________________ 1946 _ The following year took a somewhat different path to a similar warm March outcome, from modest warmth in January and February. After this warm spell ended in early April, there was no return to warmer than normal conditions through the summer which was relatively temperate by NYC standards. The autumn however was almost as warm as the March spell, and for much of the time in both October and November, with the warmth fading gradually in December. The count for fourteen days with records was 12.50 (well above the random expected 4.68). Of these, seven have survived, one later tied in 1961 and also in 2022, 2024, for a count of 5.50 and a survival rate of 44%. Jan 7 (62F) was tied second warmest after 1907 (64F). Two days in late March were near 80F but had been beaten the previous year by all-time records. The records set in 1946 surpassed earlier marks by an average of 3.4 F deg. The average year breaking seven of these records was 1973, but if the other seven are broken within the next year, that would change to 1997. The average by which seven broken records of 1946 were surpassed by eventual record highs was 4.6 F deg, which is reduced to 2.4 F counting the surviving records. There were three record low maxima surviving from 1946, two tied for a count of 2.00. April 27th (45F) was the lone exclusive mark, but a tie with 1907 on June 2nd (52F) matched the June monthly minimum set the previous year. A third tied record was 70F (tied 1881) on Aug 19th. Two tied low minima survive from 1946 (June 2nd 48F tied with four other years and July 16th 56F tied 1926) for a count of 0.70. During the year 1946 had a count of 1.70, holding Jan 20th (5F) until 1985 (4F) (eventually 1994 set this record at 0 deg F). There are also five record high minima, including 54F on Jan 7, Oct 29 and 30 (63F and 64F, tied 1918), Nov 26 (55F, tied in 2020), and Dec 10 (54F tied in 1966) for a count of 3.50. This was the surviving portion of the 7.75 records set during 1946. Temp ___ date ___ replaces _ ties ________ broken ___ eventual end of data record max, recent max _62F __ Jan 6 ____ 1929 (61F) ____________ 1950 (63F) __ 2007 (72F) ___ (1946 3rd (62F), 1929 4th (61F), 1998 5th (59F)). _63F ___ Feb 14 ___ eventual record .. (1949 2nd (59F), 1938, 1990, 2011 t3rd (58F), 1984 6th (57F)). _69F ___ Mar 4 ______________1880 (69F) __1974 (70F) __ 1974 (70F) __ (1880,1946 t-2nd (69F), 1874 4th (64F), 2008 5th (63F)). _74F ___ Mar 7 ___ eventual record .. (1987 2nd (71F), 2009 3rd (70F), 1878, 1974 t-4th (69F), 1921 6th (68F)). _75F ___ Mar 14 __ eventual record .. (2024 2nd (74F), (1903,2007,2012 t-3rd (70F), 1957 6th (69F), 1990 7th (68F), 1953,2002 t-8th (67F)). _90F ___ Sep 19 _____________ 1906 (90F) __1983 (94F) _ 1983 (94F) __ (1906,46 t2nd (90F), 1947 4th (88F), 1882,1963,67 t-5th (87F)). _77F ___ Oct 24 ______________1900 (77F) _ 2001 (79F) _ 2001 (79F) __ (1900,46,63 t-2nd (77F), 1973 5th (76F), 1940,72, 2017 t6th (74F)). _77F ___ Oct 29 ____1918,35,45 (71F) _____1971 (78F) __ 1971 (78F) __ (1946 2nd (77F), 1989 3rd (76F), 1984 4th (74F), 2015 5th (73F)). _82F ___ Oct 30 ___ eventual record later tied by 1961 .. (1950 3rd (79F), 2016 4th (76F), 1918,94 t5th (75F), 1971 7th (74F)). _81F ___ Oct 31 ___ eventual record later tied by 2024 .. (1933,45,50,61 t3rd (76F), 1919 7th (74F), 1942,94 t8th (73F)). _63F ___ Nov 25 ___ 1931 (62F) __________1966 (64F) __ 1979 (73F) __ (2014 2nd (68F), 2001 3rd (66F), 1973,90 t-4th (65F), 1966 6th (64F)). _67F ___ Nov 26 __ eventual record .. (1895,1979,1988 t2nd (66F), 2011,2020 t-5th (65F), 1986,99 t-7th (63F)). _61F ___ Dec 9 ___ 1889, 1924 (60F) ____1966 (66F) __ 1966 (66F) ___ (1991 2nd (64F), 1980 3rd (63F), 1946,53 t4th (61F), 1889,1924,87 t6th (60F). _70F ___ Dec 10 ___ eventual record .. (2008 2nd (65F), 1953 3rd (63F), 1966 4th (62F), 1911,39 t5 (61F), 1878,1885,2015 t-7th (60F)). Record high minima (7.75), end of data 3.50 survived _53F ___ Jan 6 ___ 1890 (50F) __________ 2007 (54F) __ 2007 (54F) _ also 1950 (45F). _54F ___ Jan 7 ___ eventual record high minimum __ 1907 (49F), 2012 (46F), 2008 (45F), 1895, 1930 (44F) _50F ___ Mar 14 ___ 1927 (46F) ________ 1953 (51F) __ 1953 (51F) __ 2012 (50F), 1977 (47F) _51F ___ Mar 26 ___ 1921 (49F) ________ 1986,2021 (52F) __ 1986,2021 (52F) _ also 1963, 2000 (51F) _70F ___ June 8 ______ 1871,73,1922 (70F) _1971 (73F) __1984 (77F) __1871,73,1922,46 later tied by 1965,66 (70F) _63F ___ Oct 29 ___ eventual record high minimum __ broke 1918 (62F), also 1947,1950,1984 (61F), 1971,2017 (60F) _64F ___ Oct 30 ___ eventual record high minimum tied by 1918 __ broke 1881 (62F), also 1896 (60F), 1949,50,55,61,2019 (58F) _55F ___ Nov 26 ___ eventual record high minimum later tied by 2020 __ broke 1908 (53F), also 1979 (53F), 1897 (50F) _54F ___ Dec 10 ___ eventual record high minimum later tied by 1966 __ 2015 (51F), broke 1907 (50F), 1878 (46F) ______________________________ 1947 _ While parts of Europe were having record-breaking cold, as well as northwestern Canada and Alaska, the regime in eastern North America was rather close to normal in temperatures, with the occasional brief spell of milder readings. The colder period for NYC was in the spring and early summer. This reversed to heat waves in August and September and the warmth persisted into October when it peaked relative to normal (although not in absolute terms), leaving the month near the top of the October average rankings with several records to show for it. Oct 21st (83F) lost out to earlier 1920 (84F). This autumn warmth oscillated away to a colder pattern by December. Some later spikes in temperature can be seen across the Atlantic in Britain in late November 1947 with several CET daily records set. The year set or tied 12 records, for a count of 9.33 (four ordinary ties, one three-way ties). Three have survived, with two tied for a count of 2.0, and a survival rate of 21.4%. The 1947 records surpassed earlier marks by an average of 2.7 F, and the average year breaking nine of them was 1973 which would change to 1987 if the three surviving records fell within the next year. The average by which eventual records broke 1947 records was 3.4 F, which changes to 2.5 F deg counting the surviving records. There were just two record low maxima, for a count of 1.33, but May 8th (50F) was only beaten by one degree later in 1962. 56F on June 8 marked the third consecutive year to break records in early June. With the count originally 8.0, there were six eventual record low minima in 1947, two ties in May (one with 1920 and one with 1966), and four more records (including one tie) September 23rd (41F) to October 1st (36F). The latter was a benchmark for earliest in season. The count was 4.50 with the ties. Also the year produced a total of three record high minima, 58F on April 12th later tied in 2017, 74F on Sep 14th, and 64F on Oct 21st (tied in 1979) for a count of 2.0 reduced to 1.5 on April 12, 2023 when that tied record was broken (64F); this was the remnant of the 5.5 count during the year. A long string of near misses can be added during mid-August and before the two actual records set in October (one since eclipsed in 1971). For example, 65, 66 and 64F on Oct 17-19 were all close to previous record values. Temp ___ date ___ replaces _ ties ________ broken ___ eventual end of data record max, recent max _60F ___ Jan 20 ___1907 (58F) _________ 1951 (61F) __ 1951, 2006 (61F) __ (1947 3rd (60F), 1907 4th (58F), 1900 5th (57F), 1913, 1933 t6th (56F)). _56F ___ Jan 25 ____________ 1938 (56F) _1967 (60F) __ 1967 (60F) __ (2010 3rd (56F), 1938,47,90 t3rd (56F), 1916,34 t6th (55F)). _63F ___ Jan 30 ___ 1932 (60F) _________ 2006 (64F) __ 2006 (64F) __ (1947 2nd (63F), 2002 3rd (61F), 1932 4th (60F), 2013 5th (59F)). _63F ___ Jan 31 ___ eventual record tied by 1916 .. (1913, 2013 t-3rd (61F), 1974 5th (60F), 2012 6th (59F), 1953 7th (57F)). _79F ___ Apr 6 ____________ 1912,21 (79F) __ 2023 (80F) _ 2023 (80F) __ also 2010 (78F), 1928,91 (77F), 1910 (76F). _78F ___ Apr 12 __ 1945 (73F) __________ 1977 (90F) __ 1977 (90F) __ (1996 2nd (80F), 1947 3rd (78F), 2008,17 t-4th (76F), 1965 6th (74F)). _93F ___ Aug 24 ____________1898 (93F) _ 1972 (94F) __ 1972 (94F) __ (1898,1947 t-2nd (93F), 1969 4th (92F), 1895,1905,19,53,64,74,80,95 t-5th (91F)). _89F ___ Sep 13 ____________ 1931 (89F) _ 1952 (94F) __ 1952 (94F) __ (2005 2nd (92F), 1957 3rd (91F), 1931,47,48,76 t4th (89F)). _80F ___ Oct 20 ___ eventual record later tied by 1969 .. (1965 3rd (79F), 1938,53 t-4th (78F), 1916,36,39 t-5th (77F), 1979,84 t-8th (76F)). _85F ___ Oct 23 ___ eventual record .. (1979, 2007 t-2nd (78F), 1871,1900,1978 t-4th (76F), 1901,86,95 t-7th (75F), 1928,2017 t-10th (74F)). _76F ___ Oct 26 ___1924 (73F) __________1963 (78F) __ 1963,64 (78F) _ (1989 3rd (77F), 1947 4th (76F), 1971,73 t5 (75F), 1924 7th (73F)). _78F ___ Oct 27 ___1899 (75F) __________1963 (82F) __ 1963 (82F) __ (1947 2nd (78F), 1989 3rd (76F), 1899.1991,2010 t-4th (75F)) Record high minima (5.5), end of data 1.5 survived _41F ___ Jan 25 ___________ 1896 (41F) __ 1967 (43F) __ 2010 (49F) __ also 1990 (45F) _42F ___ Jan 28 ___ 1879 (41F) __________ 1974 (44F) __ 2002,18 (46F) _58F ___ Apr 12 ___ 1889 (55F) __ tied by 2017 (58F) _ broken 2023 (64F) __ also 1945 (57F), 1948 (56F), 1996 (55F) _74F ___ Sep 13 ___ not a record in 1947 (record was 75F in 1890) _ 1947 tied 1906 _74F ___ Sep 14 ___ eventual record high minimum __ 1915 (73F), 1903,31,61 (72F), 1994,2005 (70F) _64F ___ Oct 21 ___ eventual record high minimum later tied 1979 __ 1984 (62F), broke 1884,1906,15 (59F) also 2020 (59F) _61F ___ Oct 28 ___ 1918 (60F) _________ 1971 (64F) __ 1971 (64F) __ 1984 (62F), 1899,1946 (59F) _________________________________________________________ 1948 _ There were brief warm spells in the spring of 1948 although nothing exceptional, then after a rather cool July, August turned very hot near the end of the month. This warmth persisted through much of September, disappeared for October and returned in November, fading somewhat in December. Nine days set or tied records, the count reaching 7.67 as two cases were three-way ties set. Of these, four have survived, all in late August, for a count of 4.00, which is a survival rate of 52.2%. These 1948 records increased previous marks by 4.2 F deg. The average year breaking five of them is 1971, and with the four surviving records added this changes to 1996. The heat wave Aug 25-28 was similar to one that started around the 28th in 1953 and again in 1973. The average by which five 1948 records were surpassed by eventual records was 4.0 F deg which reduces to 2.2 F counting the surviving four. There was just one low maximum, a tie with 1940 for 41F on April 14th. No record low minima were set during the year, although 0 deg F on Jan 31st was one above the 1920 record. This became the second year after 1908 not to set any record low minima. There were five record high minima for a count of 4.5. Two were in mid-March (57F on 20th, 22nd). The next two were in the August heat wave (78F and 79F from 26th and 27th survive, while 78F on 28th and 29th have been edged out by 79F, 81F in 2018. The final record was 52F on Dec 30. The year had set 12.83 record high minima, a value only later surpassed by 2015 and 2017. Temp ___ date ___ replaces _ ties ________ broken ___ eventual end of data record max, recent max _59F ___ Feb 19 ___ 1930 (57F) _________ 1961 (63F) __ 1997 (66F) __ (2017 2nd (65F), 1961 3rd (63F), 1994 4th (61F), 1948,49,54.81 t5th (59F)). _95F ___ Aug 25 ___ eventual record .. (1943,69,93 t-2nd (94F), 1893,1900,68,80 t-5th (93F)). _103F __ Aug 26 ___ eventual record .. (1993 2nd (96F), 1980 3rd (95F), 1900,41 t4th (93F), 1912,25,33,59 t6th (92F)). _101F __ Aug 27 ___ eventual record .. (1980 2nd (97F), 1993 3rd (96F), 1953 4th (95F), 1900,33,59,83 t-6th (92F)). _100F __ Aug 28 ___ eventual record .. (1953,73 t-2nd (98F), 1980,93 t-4th (95F), 1959,2018 t-6th (94F)). repl 1886 (90F). _95F ___ Aug 29 ___ 1926,45 (93F) _______ 1953 (99F) __ 1953 (99F) __ (1948t1973 t2 (95F), 2010 4th (94F), 1926,45 t-5th (93F)). _89F ___ Sep 13 __________ 1931,47 (89F) _ 1952 (94F) __ 1952 (94F) __ (2005 2nd (92F), 1957 3rd (91F), 1931,47,48,76 t4th (89F)). _74F ___ Nov 6 ___ 1938 (70F) _____ later tied 2015 __ 2024 (80F) _2022 (75F) __1959 5th (73F), 1938,78,94,2020 t6th (70F), 2005 10th (69F). _74F ___ Nov 20 ________ 1934,1942 (74F) __1985 (77F) __ 1985 (77F) ___ (1934,42,48,91 t2nd 74F), 1913,41 t-6th (72F), 1953 8th (71F)). Record high minima (12.83), end of data 4.5 survived _44F ___ Feb 17 ___________ 1891 (44F) __1981,2011 (46F) _ 2022 (49F) _52F ___ Mar 16 ___ 1945 (49F) ________ 1990 (55F) __ 1990 (55F) __ also 2000 (51F), 1973 (49F) _57F ___ Mar 20 ___ eventual record high minimum __ broke 1903 (56F), 2012 (55F), 2010 (54F) _57F ___ Mar 22 ___ eventual record high minimum __ 2012 (56F), broke 1938 (54F), 1929 (52F) _52F ___ Apr 1 ____ 1918 (51F) _________ 1986,2008 (58F) _ 2016 (61F) _ 1948 also later tied by 1952 (52F) _55F ___ Apr 6 _________ 1912,21 (55F) __ 2010 (58F) __ 2010 (58F) __ also 1985,91 (53F) _78F ___ Aug 26 ___ eventual record high minimum later tied by 2021 __ broke 1900 (77F), also 1893 (76F) _79F ___ Aug 27 ___ eventual record high minimum __ broke 1893,1900 (76F), recent 1980 (76F) _78F ___ Aug 28 ___ 1893 (76F) __________ 2018 (79F) __ 2018 (79F) __ 1973 (77F), 1959 (75F) _78F ___ Aug 29 ___ 1895 (76F) __________ 2018 (81F) __ 2018 (81F) __ 1979 (77F), 1953,73 (76F) _59F ___ Nov 4 ____ 1896,1903,1934 (54F) __ 1961,75 (61F) _ 1982 (62F) __ also 1994 (58F) _48F ___ Dec 4 ____ 1938 (47F) ___________ 1982 (58F) __ 1998 (59F) __ also 1873,1925 (46F) _48F ___ Dec 13 ___ 1896 (45F) ___________ 1983 (50F) __ 2015 (55F) __ also 1991 (51F), 2020 (47F) _52F ___ Dec 30 ___ eventual record high minimum _ also 2024 (48F), 1992 (46F), broke 1898,1907 (43F) ______________________________________________ 1949 _ This was quite a warm year in general with a very mild and snowless winter (1948-49) while parts of the western U.S. suffered from cold and blizzards. Record highs were frequent through the spring and summer and returned in October after a relatively cool September. A very mild winter followed in 1949-50. The year could have added a few near misses to this list, such as 61F on Jan 19 (62F in 1929), 88F on Oct 10, which lost out to earlier 91F in 1939, also 80F on Oct 21 (84F in 1920). There were 17 records, including four ties and one three-way tie, for a count of 14.33, over three times random expectation of 4.51. Of those, ten have survived, two are ordinary ties, one is a three-way tie, and one a four-way tie, for a count of 7.58. That is a survival rate of 52.9%. No year after 1949 held as many records, and now it ranks fourth in record count behind 2001 (9.33), 1990 (8.00) and 1991 (8.5). The count of 1949 by 1990 was 10.17 so this year competed well through a very warm period. The average increase of 1949 records over previous marks was 2.7 F. The average year breaking seven 1949 records was 1981, which would change to 2002 if the ten existing records all fell within the next year. The average surplus of eventual records to seven broken from 1949 is 5.7 F deg, which reduces to 2.4 if the ten surviving records are also counted. There were no surviving record low maxima from 1949. The year managed one record low minimum, 55F on Aug 20th. As this was the only record low during 1949 (no others have been broken since) the survival rate is 100%, the fourth time this happened so far. Two readings that came within 3 deg of records in late May are the closest approach to the record table otherwise. Also there were five record high minima that have survived to the end of the data, those being 50F Feb 14th, 61F Mar 27th, 61F Apr 27th (tied in 2011), 45F Dec 19 (later tied twice) and 57F Dec 27th for a count of 3.83 surviving, from 10.5 records set during 1949. In addition, ten days came within 1F of the existing low minimum record so the year narrowly missed out on setting a higher count than 1948 or even the two top finishers, 2015 and 2017. Some of those near misses are included in the record log, quite a few of those that do not appear were readings around 77F in the summer months. Temp ___ date ___ replaces _ ties ________ broken ___ eventual end of data record max, recent max _60F ___ Feb 9 ___ 1898,1937 (51F) _______ 1990 (63F) __ 1990 (63F) ___ (1949 2nd (60F), 2001 3rd (58F), 1960 4th (57F)). _73F ___ Feb 15 ___ eventual record .. (1954 2nd (69F), 1939,2018 t-3rd (62F), 1967 5th (60F), 2019 6th (59F), 1915,72,84 t-7th (58F)). _59F ___ Feb 19 ______________ 1948 (59F) _ 1961 (63F) __ 1997 (66F) __ (2017 2nd (65F), 1961 3rd (63F), 1994 4th (61F), 1948,49,54.81 t5th (59F)). _75F ___ Mar 27 ___ 1945 (74F) _____________ 1998 (75F) __ 1998 (83F) ___ (2007 2nd (78F), 1949 3rd (75F), 1945, 1985 t-4th (74F)). _90F ___ May 5 __ eventual record tied later by 1955, 1980 .. 1930, 1934 t4th (89F), 1919 6th (88F), 1944 7th (87F), 2000 8th (86F). _92F ___ May 6 __ eventual record tied later by 1986 .. (1930 3rd (91F), 1918 4th (90F) 1934,39,2000 t5 (89F)). _96F ___ June 26 ________________ 1943 (96F) _ 1952 (100F) _ 1952 (100F) _ (1943,49,63 t-2nd (96F), 1950 5th (95F), 1923 6th (94F) 2003 (93F). _102F __ July 4 ___ eventual record .. (1919 2nd (99F), 1966 3rd (98F), 1911,55 t-4th (97F), 1898,1999,2002,2010 t-6th (96F)). _98F ___ July 28 __ eventual record tied by 1892, 1931, 1999 .. (5th warmest 1983 (96F), t6th 1929, 1963, 2015,16 (95F)) _99F ___ July 29 __ eventual record .. (1892 2nd (97F), 1894, 2002,15 t3rd (96F), 1898, 1933 t-6th (95F), 1993 8th (94F)). _100F __ Aug 9 ___ 1896 (98F) _____________ 2001 (103F) _ 2001 (103F) __ (1949 2nd (100F), 1896 3rd (98F), 1941 4th (97F), 1924 5th (96F)). _98F ___ Aug 10 ___ eventual record tied by 1891 .. (1944,2001 t-3rd (97F), 1900,13,79 t5th (95F)). 1896,1911 t8th (94F)). _85F ___ Oct 11 ___ eventual record .. (1954 2nd (84F), 1914,55 t-3rd (83F), 1960 5th (81F), 1919 6th (80F), 1904 7th (79F), ________________________ 1918, 1962 t-8th (78F), 1920, 1928,1930,1934,1990,1995,2017,2018 t-10th (77F)).** _74F ___ Nov 11 ___ eventual record .. (2020 2nd (72F), 1880, 2002 t-3rd (68F), 1984,99, 2006 t-5th (66F)). _63F ___ Dec 22 ___ 1875 (59F) _________ 2013 (71F) __ 2013 (71F) __ (1949,1998 t2nd (63F), 1967, 2015 t-4th (62F), 1990 6th (61F)). _63F ___ Dec 27 ___ eventual record .. (1973,2015 t-2 (61F), 1936,1964,2016 t-4th (60F)). _59F ___ Dec 28 _____________ 1936 (59F) _ 1954 (61F) __1982, 2008 (65F) __ (1954 3rd (61F), 2018 4th (60F), 1936,49,88 t5th (59F)). ** Oct 11 _ full list of warm days is unusual for the number near the top and also the relative lack of recent warmth on this date. Record high minima (10.5), end of data 3.83 survived. _50F ___ Feb 14 ___ eventual record high minimum ___ broke 1882 (43F), 1966,1990 (42F) _45F ___ Feb 15 ___ 1908 (40F) __________ 1984 (49F) __ 1984 (49F) __ also 2005,18 (46F), 1954 (44F) _61F ___ Mar 27 ___ eventual record high minimum ___ broke 1908 (58F), 1998 (56F), 1945,48 (54F) _61F ___ Apr 27 ___ eventual record high minimum later tied by 2011 __ broke 1869 (60F), also 1979,86,2009 (58F) _63F ___ May 5 ___ not a record in 1949 (1944 _64F, later tied by 2006, then 2015_66F) _78F ___ July 21 _____________ 1940 (78F) _ 1980 (82F) __ 1980 (82F) __ 1940,49 later tied by 1977 (78F) also 2019 (80F) _79F ___ Aug 10 ___ not a record in 1949 (1896 _80F) remains second warmest, 2010 (78F) _67F ___ Oct 8 _______________ 1922 (67F) _ 2017 (72F) __ 2017 (72F) __ 1922,49 later tied by 1982,90,2007 (67F) _69F ___ Oct 10 ___ 1922 (67F) __________ 2018 (71F) __ 2018 (71F) __ also 1990 (68F), 1879,1919 (65F) _68F ___ Oct 11 ___ 1914 (64F) __________ 2018 (69F) __ 2018 (69F) __ also 1990 (67F), 1898,1913 (63F) _65F ___ Oct 12 ______________ 1884 (65F) _ 1954 (67F) __ 1954 (67F) __ 1990 (66F), 1983 (65F) _55F ___ Nov 11 ___ not a record in 1949 (1935 _56F) later records 1970 (56F), 2020 (64F) _45F ___ Dec 19 ___ eventual record high minimum later tied by 1957, 2017 __ broke 1895 (43F) also 1967 (44F) _48F ___ Dec 22 ___ 1905 (46F) __________ 1990 (58F) __ 2013 (61F) __ also 2015 (53F) _57F ___ Dec 27 ___ eventual record high minimum* __ 1973, 2015,19 (46F), 1971 (45F), broke 1881 (44F) * Dec 27 1949 (57F) was warmest in December until Dec 4, 1982 (58F), record now Dec 24, 2015 (63F) +++++ __________ ___ +++ 1950 _ January was one of the mildest on record and holds extreme value records for both max (72F on 26th) and min (59F on 4th). The year turned relatively cool from February to mid-summer, then the autumn became warm again, with Nov 1-2 in the 80s. The year missed an opportunity to add a record with 86F (Oct 1st) already taken by 1927 (88F). A memorable storm occurred in late November (24th-26th), bringing heavy snowfalls (over two feet in places) to a region west of the Appalachians into south central Ontario, and very strong southeast winds to NYC, but it had little impact on the temperature records. There were nine record highs set with one ordinary tie and one three-way tie, for a count of 7.83. Of those, five have survived, two later tied in 1993 and 2023, for an eventual record count of 4.0, and a survival rate of 51.1%. The average 1950 record increase over previous marks was 4.8 F deg. The four broken 1950 records went down to 1975 on two occasions, 1997 and 2007 for an average of 1989. That would change to 2007 if the five surviving records fell within the next year, and this is the most recent such statistic encountered yet (a year with no broken records would come out to 2022 in this case). Noting that two of the five are monthly maxima, it seems likely that 1950 will survive a while longer in the list of records. The average surplus of the eventual records to the four broken is 8.0 F deg and that reduces to 3.6 F counting the five surviving records. The count of record low maxima surviving from 1950 is 1.33, with a third of the March 3rd record of 26F (tied 1943, 2009), and 48F on May 19th. The record low minimum count for 1950 is 2.17 with a share of March 3rd (six tied) and also the records for April 14th (26F) and June 18th (48F). The count during the year was 5.45, and 1950 has a worse survival rate (39.8%) than any year except 1951 (after 1944) except for those which set no records that could be preserved. No year since 1950 has lost three record lows. It will be mentioned again at the appropriate time, but Jan 20, 1985 is the last record low minimum not to survive to the end of the data (it was broken in 1994). After the 1950s there are very few temporary record lows. There was only one surviving record high minimum, 59F on January 4th, which is the monthly maximum value for high minima. The late October and early November warm spell had several near misses including 61F on Oct 29th (already set at 63F in 1946). Readings of 58F, 59F on Nov 1-2 were not records even in 1950, but the values that exceeded them then have since been broken by eventual records of 65F in 1956 and 67F in 1971. Even so, the mean temperatures of 71F for both dates (Nov 1-2) in 1950 were more typical of early September at NYC. Toronto also had its warmest November day on Nov 1st (75F). During the year four records were set, all in January. Temp ___ date ___ replaces _ ties _____ broken ___ eventual end of data record max, recent max _60F __ Jan 3 ____ 1913 (59F) __________ 1997 (62F) __ 2000 (64F) ___ (1950 3rd (60F), 1913,51 t-4th (59F), 1876, 2004,05 t-6th (58F)). _66F __ Jan 4 ___ eventual record later tied by 2023 .. (1993 3rd (64F), 1998 4th (62F), 1951 5th (61F), 1906,1907,2000 t6th (60F)), _64F __ Jan 5 ___ eventual record later tied by 1993 .. (2007 3rd (62F), 1874 4th (59F), 1916 5th (58F), 1997 6th (57F)). _63F __ Jan 6 ____ 1946 (62F) ___________ 2007 (72F) __ 2007 (72F) ___ (1950 2nd (63F), 1946 3rd (62F), 1929 4th (61F), 1998 5th (59F)). _72F __ Jan 26 ___ eventual record .. (1916,52 t-2nd (60F), 1990 4th (59F), 1967 5th (58F), 1913, 2002,17 t-5th (56F)). [monthly max later tied 6th, 2007] _53F __ Jan 29 _____________ 1887 (53F) _ 1975 (55F) __ 2002 (69F) __ (1975 2nd (55F), 1887, 1950, 2006 t3rd (53F)). _84F ___ Nov 1 ___ eventual record .. (1974 2nd (81F), 1982, 2003 t-3rd (77F), 1927,29,52 t-5th (73F)). [Nov monthly max] _83F ___ Nov 2 ___ eventual record .. (1982 2nd (79F), 1968 3rd (77F), 1929 4th (76F), t5th 1971,2001 (75F)). _72F ___ Nov 9 _______1895,1945 (72F) __1975 (75F) __ 1975,2020 (75F) _ (1986 3rd (73F), 1895,1945,1950 t4th (72F), 1916 7th (71F)) . Record high minima (4.0), end of data 1.0 survived. _43F ___ Jan 3 ___ 1876,97 (41F) ________ 1998 (48F) __ 2000 (51F) __ 1950 later tied by 1997 (43F) _59F ___ Jan 4 ___ eventual record high minimum __ 2000 (46F), broke 1933 (44F), 1906 (42F) _41F ___ Jan 24 ___1909,13,14,42 (40F) ____ 1953 (49F) __ 1967 (54F) __ 2002 (45F), 1969,2012 (42F) _40F ___ Jan 29 ___ 1903 (39F) ___________ 1970 (42F) __ 2002 (50F) __ 2006 (44F) ___________________________________ (decade of 1951-60) __________________________ We now reach the decade of 1951-60 which started out very warm but saw some tendency to cooling later. The decade now holds 28.33 of the 366 daily record highs, and the first half holds 22 of those. There were 59 records for a count of 51.08 daily records set, one or two were duplicates on certain dates; the decade held shares of 54 days, 13 being ties reducing the count to around 46.58 total records set by 1960 (of which 28.33 have survived). As we move into this decade, survival rates generally increase towards 60% but it becomes harder for years to run up large totals as most of the weaker "low hanging fruit" has been taken by the aggressively warm 1930s and 1940s. Now it begins to require the sort of temperature that will not be easily toppled to set records. The first half of this decade continued the run of very warm conditions noted for most of the 1940s, and there were long summer heat waves in 1952, 1953, 1954, 1955 and 1959. Most other summers were average but 1956 and 1958 were relatively cool. The year 1958 is the first one in the study that failed to set a daily maximum record. The closest that it came to doing so was a reading of 89F on September 26th, two below the already existing record of 91F (1881) that was later tied in 1970. Three more such years were found (1992, 2004, 2014). 1951 _ This was often a rather average sort of year with mild spells in the winter and brief warm spells in other seasons, but also a notable cold period in early November. From seven record highs came a count of 7.00, well above the random expectation which by this point has fallen to 4.40. Of those, four survive, one being tied and the count is 3.5, for a survival rate of 50.0%. These 1951 records break existing values by an average of only 1.9 F. The average year breaking the three 1951 records that have fallen is 1962. Counting the four surviving records, the average would be 1996. The average surplus of eventual records to the three broken is 7.0 F but this reduces to 3.0 if we count the four surviving values. The year produced one surviving record low maximum (48F Oct 11) and that was the only one set during the year. The year has a count of just 0.33 for record low minima, with a share of August 5th. During the year 1951, the count was 1.83, records on June 12th (51F) and June 13th (52F tied 1922) were later broken (in 1979 with 48F and 1953 with 51F). The tied record for Aug 5th had already been tied by 1886 and 1912. This made for a survival rate of just 18.2%. Of all years that set any records at all after 1951 (and about two dozen did not), this is the third lowest survival rate, the lowest after it were 1952 and 1959 (0.0%) which failed to preserve their 0.5 counts. However as mentioned quite a few years set no low minimum records after about 1997. There were three record high minima set late in the year: Nov 14 (58F), and Dec 7-8 which had 53F and 52F, the first was shared with 1956 until that tie was broken by 2022 (54F). The count is 2.0, from an original count of 6.0. The lowest temperature from Dec 5 to 8 was 51F and all four days held records, as of Dec 2022 only one as noted has survived at least in part. Temp ___ date ___ replaces _ ties _____ broken ___ eventual end of data record max, recent max _64F ___Jan 19 ___ eventual record .. (1929 2nd (62F), 1949 3rd (61F), 1876 4th (59F), 1915 5th (58F), 1972 6th (57F), 1933,73,96 t-7th (56F)). _61F ___ Jan 20 ___ eventual record tied later by 2006 .. (1947 3rd (60F), 1907 4th (58F), 1900 5th (57F), 1913, 1933 t6th (56F), 1890 8th (55F)) _64F ___ Feb 13 ___ eventual record .. (1869 2nd (61F), 1880, 1976 t-3rd (58F), 1900,37 t-5th (57F), 1876,82 t-7th (56F), ___ ___ ___ 1903,39,49,71,74 t-9th (55F), 1932,1966.2008 t-14th (54F)). (This is a rare case of a day without a top ten finish since 1975). _84F ___ Apr 29 ___ 1888 (83F) ________1974 (89F) _ 1974 (89F) __ (2024 2nd (87F), 2017 3rd (85F), 1951 4th (84F), 1888 5th (83F), 1903 6th (82F), 1938 7th (81F)). _90F ___ May 16 __ eventual record .. (1965,91 t-2nd (87F), 1870 4th (86F), 1998, 2017 t-5th (85F), 1877,1906,29,31,32,54 t-7th (83F)). _67F ___ Nov 14 ___ 1941 (66F) ________1955 (68F) __1993 (72F) __(1973,80 t2nd (71F), 1989 4th (70F), 2011 5th (69F), 1955 6th (68F), 1951,59,78 (67F)) _64F ___ Dec 7 ____ 1932 (63F) ________ 1956 (67F) __ 1998 (75F) __ (1956 2nd (67F), 1951 3rd (64F), 1932 4th (63F), 2011 5th (62F)). Record high minima (6.0), end of data 2.0 survived _46F ___ Feb 26 ___ 1880,90 (43F) _____ 1957 (48F) __ 1976 (49F) __ 1996 (44F) _42F ___ Mar 7 ____________ 1876 (42F) __ 1974 (48F) __ 2009 (51F) __ also 1987 (45F) _62F ___ May 17 ___ not a record in 1951 (1879, later 1991 _64F) _58F ___ Nov 14 ___ eventual record high minimum __ 1961, 2008 (57F), broke 1929 (55F) _53F ___ Dec 5 ____________ 1916 (53F) __1973,82 (56F) __ 1973,82 (56F) __ also 2001 (55F), 1998 (52F) _51F ___ Dec 6 ___ 1912 (48F) __________ 1982 (57F) __ 2001 (58F) __ also 2011 (56F), 1993 (54F) _53F ___ Dec 7 ___ 1884,1932 (52F) _tied 1956 (53F) __ 2022 (54F) __ also 1879, 1998 (50F) _52F ___ Dec 8 ___ eventual record high minimum __ 1966 (50F), broke 1883 (49F), 1974 (49F), also 1980, 2004 (46F) _________________________________________________________ 1952 _ The year is noteworthy for its hot summer, and the June and September portions were hottest relative to normal so it had an extended nature. Other than a rather cool October, all months of 1952 were somewhat above normal in temperature so there were frequent opportunities for warm temperature records, however, the total for the year was only seven records and a count of 6.00. Numerous days fell a few degrees short of records in both winter and summer, and again in early October. Of these, three have survived, one tied earlier 1943, and the count is 2.50 for surviving records, a survival rate of 41.67%. The average 1952 record improved on a former record by an average of 2.4 F deg. The average of years breaking four records from 1952 was 1958, with the three surviving records counted this becomes 1975. The average surplus of eventual records to four 1952 broken records was 3.75 F deg and this reduces to 2.1 F if the three surviving records are counted. There were two low maximum records broken, each tied for a surviving count of just 0.83 (from 2.17 during the year). There were no daily minimum records that survived from 1952, for which the count was only 0.5 after tying the Oct 20th record with 33F (tied with 1940, broken 1972 32F and eventually 1974 31F). With 1959, this is one of a handful of years in the entire record to set some records and fail to preserve any to the end. Four high minimum readings were included, 42F on Feb 2nd, 81F on June 26th (a monthly maximum also), 78F on July 14 and 80F on July 16. This was the first of four consecutive summers with a lot of heat and humidity (1952-55). Temp ___ date ___ replaces _ ties ______ broken ___ eventual end of data record max, recent max _95F __ June 17 ___1892,1939,45 (92F) _ 1957 (96F) _ 1957 (96F) __ (1952 2nd (95F), 1892,1939,45 t-3rd (93F), 1891,1929 t-6th (92F), 1962,2018 8th (91F)). 1952 _99F ___ June 25 __ eventual record tied by 1943 .. (1923 3rd warmest (97F), 1963 4th (95F), 1870,80,98 t-5th (94F) 1997 (93F).) _100F ___ June 26 __ eventual record .. (1943,49,63 t-2nd (96F), 1950 5th (95F), 1923 6th (94F) 2003 (93F). _96F ___ July 13 ___ 1916 (94F) ___________ 1966 (101F) _ 1966 (101F) _ (1952,54,94 t2nd (96F), 1979,93 t5th (95F), 1916 6th (94F)). _96F ___ July 14 ___ 1942 (95F) ___________ 1954 (100F) _ 1954 (100F) _ (1952, 1995 t2nd (96F), 1942,66,74 t4th (95F), 1983,97 t7th (94F)) _95F ___ July 23 _____________ 1918 (95F) __ 1955 (95F) _ 2011 (100F) _ (1955,91 t-2nd (99F), 2016 4th (96F), 1918,52,78 t5th (95F)). _94F ___ Sep 13 ___ eventual record .. (2005 2nd (92F), 1957 3rd (91F), 1931,1947,1948,1976 t4th (89F)). Record high minima (6.0), end of data 4.0 survived _44F ___ Jan 1 ______________ 1876 (44F) __ 1966 (52F) _ 1966 (52F) __ 1979 (50F), 2022 (50F), 2007 (45F) _42F ___ Feb 2 ___ eventual record high minimum __ 1999 (40F), broke 1922,33 (40F) _52F ___ Apr 1 ______________ 1948 (52F) __ 1986,2008 (54F) _ 2016 (61F) __ also 1918 (51F) _81F ___ June 26 __ eventual record high minimum (June max) _ 2003 (79F), broke 1904,43 (78F) _78F ___ July 14 ___ eventual record high minimum __ 1966, 1995 (77F), broke 1876,1905 (76F) _76F ___ July 15 ___ not a record in 1952 (record was 1891,96 _77F), since 1995 (84F) _80F ___ July 16 ___ eventual record high minimum __ 1983, 2021 (79F), broke 1869,1901 (78F) _55F ___ Nov 21 ___ 1931 (54F) __________ 1991 (62F) __ 1991 (62F) ______________________________________________________________________________ 1953 _ One of the warmest years on record, 1953 is best known for a heat wave in late summer with September's highest reading of 102F set on the 2nd, and also frequent warmth in November. 1949 and 1953 were almost as warm as recent years and without the full benefit of the modern urban heat island (although have estimated 80% or so), so in adjusted terms they are among the warmest years. 67F on Feb 21 was not a record (68F 1930). Also 90F on May 11 was one degree short of the 1896 record already set, but would have been a record or tied on any day from 13th to 21st. And 97F on June 20 fell one degree short of the 1923 record, the next day had the same reading which is currently tied with 1988 as a daily record. 97F on July 16 was one degree below the record from 1879. Three days were in the low 70s slightly below record values Nov 18-20 after the record high on Nov 17th. Dec 10th had a reading of 63F, higher than previous day's record value but lower than previously set 70F (1946). So the count of 11 records (10.00 with two ties) for 1953 could have been considerably higher, and of those, nine remain as records, two being tied for a count of 8.00. That is a survival rate of 80.0% (highest so far, not overtaken until 1964 on 2.5 for 3.0 for 83.3%) and gives 1953 the highest record count so far, eventually tied third with 1990 (2011 9.33 and 1991 8.50). These eleven 1953 records broke previous marks by an average of 3.0 F deg, and the two since broken were surpassed by an average of 3.0 F but this reduces to 0.6 F with the nine surviving records included. The two records broken fell in Dec 1966 and Jan 1995 (average Dec 1980) but that would become 2016 if all nine of the surviving records fell in 2021. There was a share of one record low maximum (38F Nov 6th tied with 1878) in 1953 (count 0.50). Also, there were two record low minima (count 2.00): 51F on June 13th and 57F on July 25th. That was the count during the year also, for a survival rate of 100% (now the fifth such year, and about to become more and more frequent, if years set any records they more often managed to hold on to them). From an original count of only 5.0, the year has held on to 2.0 record high minima (count 2.0), 51F on March 14th, 78F on Aug 31 (but all other minimum readings in high 70s in that hot spell have been broken recently, or were already eclipsed by 1898), Minima during the November warm spell were several degrees below existing record highs, 55F on 22nd compared to 58F 1931 (later tied 1992). The table of records includes four near miss readings in early September to go along with the daily maximum readings in that period. Temp ___ date ___ replaces _ ties ______ broken ___ eventual end of data record max, recent max _57F ___Jan 16 ____________ 1924 (57F ) _ 1995 (58F) _ 1995 (58F) __ (1924,53 t-2nd (57F), 1943 4th (56F), 1890,1933,90,91,2007 t-5th (55F)). _97F ___ June 21 __ eventual record tied later by 1988 .. (1923 2nd warmest (96F), 1949 3rd (95F), 1941, 2012 t-3rd (94F), 1966 5th (93F)). _100F __ July 17 ___ eventual record .. (1955,68,99 t-2nd (98F), 1885,1900,1977,2013 t-5th (97F), 1905,91,97 t-8th (96F)). _101F __ July 18 ___ eventual record .. (1977, 2012 t-2nd (100F), 1991 4th (99F), 1982,1999,2013 t5th (98F), 1955 8th (97F), 1905.88 t-9th (96F)). _ 99F ___ Aug 29 ___ eventual record .. (1948t1973 t2 (95F), 2010 4th (94F), 1926,45 t-5th (93F), 1991,2018 t-7 (92F)). _ 98F ___ Aug 30 ___ eventual record tied later by 1973 .. (1921 3rd (95F), 1991 4th (94F), 1945 5th (93F), 1928,1966,2010 t-6th (92F)). _100F ___ Aug 31 ___ eventual record .. (2010 2nd (96F), 1973 3rd (94F), 1881 4th (93F), 1924,25,41,45, 69 t5th (92F)). _ 97F ____ Sep 1 ____ eventual record .. (2010 2nd (96F), 1924,29,73,80 t3rd (95F), 1961 7th (94F), 1898,1941,69 t8th (93F)). _102F ___ Sep 2 ___ eventual record .. (1944 2nd (97F), 1929,32,80 t3rd (96F), 1961 6rh (95F), 1921,73,77,2010 t7th (94F)). [Sep monthly max] _71F ____ Nov 17 ___ eventual record .. (1896 2nd (70F), 1928 3rd (68F), 1927,87 t-4th (66F), 1903 6th (65F), 1891,1960,1993,2006 t7th (64F)). _61F ___ Dec 9 ______________ 1946 (61F) __1966 (66F) __ 1966 (66F) ___ (1991 2nd (64F), 1980 3rd (63F), 1946,53 t4th (61F), 1889,1924,87 t6th (60F). Record high minima (5.0), end of data 2.0 survived. _49F ___ Jan 24 ___ 1950 (41F) __________ 1967 (54F) __ 1967 (54F) __ 2002 (45F), 1969, 2012 (42F) _42F ___ Feb 27 ____________ 1902 (42F) __ 1971 (44F) __ 1976 (49F) __ 1997 (47F) _51F ___ Mar 14 ___ eventual record high minimum __ broke 1946 (50F), 2012 (50F), 1977 (47F) _77F ___ June 21 ____________ 1923 (77F) __ 2012 (79F) __ 2012 (79F) __ also 1964,88 (76F) _76F ___ Aug 30 ___ 1928 (75F) ___________ 1973,2018 (78F) _ 1973,2018 (78F) _ 1953 later tied by 1960 (76F) _78F ___ Aug 31 ___ eventual record high minimum __ 2010,15 (76F), broke 1898 (75F) _75F ___ Sep 1 ___ not a record in 1953 (record was 1898 _76F later tied 1980, 2010, 2015) _77F ___ Sep 2 ___ not a record in 1953 (record was 1898 _79F) __ also 2010 _ 78F _77F ___ Sep 1 ___ not a record in 1953 (record was 1898 _78F) __ also 1993 _ 76F _76F ___ Sep 1 ___ not a record in 1953 (record was 1898 _78F) __ also 1907, 2018 _ 77F _60F ___ Oct 28 ___ not a record in 1953 (record was 1947 _61F) later 1971 _ 64F _55F ___ Nov 22 ___ not a record in 1953 (record was 1931 _58F later tied in 1992) _____________________________________________________________________________ 1954 _ This year was fairly similar to the previous two but had a few colder spells than they had managed. After a somewhat colder January, February was a notably warm month, and the first half of October very warm, culminating in the northward moving destructive Hurricane Hazel which tracked through NC, VA,WV,PA and wNY into southern ON where its remnants (at tropical storm intensity although people in Ontario remember the event as "hurricane Hazel") set a daily rainfall record in the Toronto area on 15th-16th, the effects at NYC were more in terms of strong south-southeast wind gusts and an end to the warmest part of the late summery spell that had prevailed, although the rest of the autumn stayed quite mild. The year set eight records including three ordinary ties and one three-way tie, for a count of 5.83 (random expectation has fallen to 4.24), of which four (count 3.5) have survived (survival rate of 60%). 69F on Feb 15th, 100F on July 31 and 84F on Oct 11th failed to set records. These 1954 records broke previous marks by an average of 3.1 F deg, and for the first time no starter record was broken or tied (1905 was tied). The average year breaking four 1954 records was 1973. This would change to 1997 if the four surviving records fell within the next year. The average amount by which four records were surpassed eventually is 7.25 F deg, which reduces to 3.6 F if the four surviving records are counted. One low maximum record was set (57F on Sep 15th). There were two record low minima, 24F on April 3rd and 39F on Oct 7 (tied later by 1999) for a count of 1.50. The original count was 2.50, half of the difference explained by the later tie in 1999, and the other half being a tied record of 51F on Sept 13th later broken in 1963 (46F). Four October nights set high minimum records (count 3.00) with 72F on 1st (t1881) and 2nd, 68F on 3rd (t1969), and 67F on 12th. Readings of 66F the next two days fell to 1990 (69F, 68F). A low of 43F on Feb 16th was also one degree short of the 2002 record and 44F on Dec 28 was already beaten by 45F in 1881, was itself tied in 1982 then all these fell to 47F in 2008. The growing urban heat island has displaced a lot of record high minima to more recent years. The count during the year had been 7.5, records in other portions of the year have since been overtaken. Temp ___ date ___ replaces _ ties ______ broken ___ eventual end of data record max, recent max _71F __ Feb 16 ___ eventual record .. (1921 2nd (62F), 1976 3rd (60F), 2006 4th (59F), 2018 5th (58F), 1949,82,99 t-6th (57F)). _59F ___ Feb 19 __________ 1948,49 (59F) _ 1961 (63F) __ 1997 (66F) __ (2017 2nd (65F), 1961 3rd (63F), 1994 4th (61F), 1948,49,54.81 t5th (59F)). _96F ___ July 13 _____________ 1952 (96F) _ 1966 (101F) _ 1966 (101F) _ (1952,54,94 t2nd (96F), 1979,93 t5th (95F), 1916 6th (94F)). _100F __ July 14 ___ eventual record .. (1952, 1995 t2nd (96F), 1942,66,74 t4th (95F), 1983,97 t7th (94F)) _86F ___ Oct 12 ___ eventual record tied by 1928 .. (1962 3rd (85F), 1949 4th (83F), 1995 5th (81F), 1938,55,69 t6th (80F)). _87F ___ Oct 13 ___ eventual record .. (1995 2nd (86F), 1940, 61 t3rd (80F), 1928,30 t5th (78F), 1884,1989 t7th (77F)). _61F ___ Dec 28 ___ 1936, 49 (59F) _______ 1982 (65F) __1982,2008 (65F) __ (1954 3rd (61F), 2018 4th (60F), 1936,49,88 t-5th (59F), 1984 8th (56F)). _57F ___ Dec 29 ______________ 1905 (57F) _1982 (65F) __1984 (70F) __ (1982 2nd (65F), 2024 3rd (60F), 1905,54,2018 t4th (57F), 1948 6th (56F), 1901,40,96 t-7th (55F)). Record high minima (7.5), end of data 3.0 survived. _43F ___ Feb 16 ___ 1882 (42F) __________ 2002 (44F) __ 2023 (56F) __ 1954 later tied by 1976, 82, 84 (43F) _53F ___ Apr 7 _____ 1908,42 (49F) ______ 1991 (63F) __ 1991 (63F) __ also 2010 (56F), 1962 (51F) _58F ___ Apr 21 ___ not a record in 1954 (1923 _60F) remains third warmest, 1957 (59F) second. _72F ___ Oct 1 ___ eventual record high minimum tied 1881 __ 1986, 2018, 2019 (66F) _72F ___ Oct 2 ___ eventual record high minimum __ broke 1927 (69F), 1905,71 (67F), 1879, 2002 (66F) _68F ___ Oct 3 ___ eventual record high minimum later tied by 1969 __ broke 1898 (67F), 1927 (66F), 2007 (65F) _67F ___ Oct 12 __ eventual record high minimum __ 1990 (66F), broke 1884,1949 (65F) also 1983 (65F) _66F ___ Oct 13 ___ 1901 (64F) __________ 1983 (67F) __ 1990 (69F) _66F ___ Oct 14 ___ 1938 (63F) __________ 1990 (68F) __ 1990 (68F) _55F ___ Nov 20 ___ not a record in 1954 (1900,1913 _ 56F), later record 1985 _ 62F _44F ___ Dec 28 ___ not a record in 1954 (1881 _ 45F), later record 2008 _ 47F _______________________________________________________________________________ 1955 _ This was the last of the string of very warm years, on the higher level 1952-55, and on a more moderate level 1948-55 or even 1944-55 can be identified as a warm period which rivals the recent past in many ways. This year had a rather average winter season then saw occasional warm spells through the spring, culminating in one of the hottest summers on record (also warm in Britain). The autumn saw this warmth fading relative to normal and the last two months of the year were near average again. There were 12 twelve record highs with four ties for a count of 10.00. Of those, with later additional ties the surviving records (six) had a count of 4.83, a survival rate of 48.3%. Also, Feb 10th (57F) fell one short of the 1898 set record high. The average by which 1955 broke existing record values was 1.4 F deg. The average year to break six records was 1986, so if the other six were broken later this year or early next year, that average would become 2004. The six broken records have been overtaken by an average of 4.3 F deg which drops to 2.1 F counting the six surviving records. There were no surviving record low maxima, nor were any set and later broken. There was one record low minimum of 0 deg F (Feb 3rd), which was the only record set in 1955 for a survival rate of 100%, and despite all the summer heat, no surviving record high minima, with a reading of 78F on July 23rd already beaten (80F 1906, eventually broken by 83F in 2011), and 79F on Aug 2nd (already broken by 80F in 1933 eventually falling to 83F in 2006). Five records were set, and the last to be broken was Temp ___ date ___ replaces _ ties ______ broken ___ eventual end of data record max, recent max _71F __ Mar 10 ___ 1879 (69F) _________ 2006 (74F) _ 2016 (79F) _ (2006 2nd (74F), 1955 3rd (71F), 1879,1977 t-4th (69F), 1878 6th (68F)). _67F __ Mar 11 ___ 1879 (66F) _________ 1967 (72F) _ 1977 (73F) _ (1967 2nd (72F), 2021 3rd (71F), 2016 4th (68F), 1955.86,90 t-5th (67F)). _84F ___ Apr 11 __ eventual record .. (2011 2nd (81F), 1922,2017 t-3rd (80F), 1887 5th (78F), 1987 6th (77F)). _90F ___ May 5 __ eventual record tied by 1949, 1980 .. 1930, 1934 t4th (89F), 1919 6th (88F), 1944 7th (87F), 2000 8th (86F). _98F ___ July 5 ___________ 1919 (98F) __ 1999 (101F) _1999 (101F) _ (2010 2nd (99F), 1919,55 t-3rd (98F), 1911 5th (97F), 1949,90,2012 t-6th (95F)). _100F __ July 22 __________ 1926 (100F)_ 1957 (101F) _ 2011 (104F) _ (1957 2nd (101F), 1926,55 t-3rd (100F), 1918 5th (98F), 1952,61 t-6th (97F)). _99F ___ July 23 ___ 1918,52 (95F) ______ 2011 (100F) _ 2011 (100F) __ (1955,91 t-2nd (99F), 2016 4th (96F), 1918,52,78 t5th (95F)). _100F___ Aug 2 __ eventual record .. (1917,33,75 t2nd (98F), 2002,06 t5th (97F) 1995 7th (96F), 1938,43,93,2005 t-8th (94F)). _97F ___ Aug 6 ____ eventual record tied by 1931 .. (1918 3rd (96F), 1900 4th (95F), 1906,24,30,89,2001 t5th (94F)). _97F ___ Aug 20 __ eventual record .. (1983 2nd (96F), 1937 3rd (95F), 1869, 1959 t-4th (93F)). _96F ___ Aug 21 __ eventual record .. (1869,1937,1995 t2nd (95F), 1899, 1942, 1959, 2005 t5th (93F)) _68F ___ Nov 14 ___ 1951 (67F) _________ 1973 (71F) __1993 (72F) __(1973,80 t2nd (71F), 1989 4th (70F), 2011 5th (69F), 1955 6th (68F), 1951,59,78 (67F)) Record high minima (5.0), end of data none survived, extinction date Apr 11, 2017. _51F ___ Mar 10 ___ 1871 (48F) __________ 2016 (63F) __ 2016 (63F) __ also 1977, 2006 (47F) _49F ___ Mar 11 ____________ 1925 (49F) __ 1967,77 (50F) _ 1966,77 (50F) __ 2016 (48F), 1935, 2006 (47F) _58F ___ Apr 11 _____________ 1922 (58F) __ 2017 (61F) __ 2017 (61F) __ also 2014 (56F) _79F ___ Aug 2 ___ not a record in 1955 (1933 _80F), later record 2006 (83F), 1955 remains third _78F ___ Aug 6 ___ not a record in 1955 (1906,08,1918 _ 80F), warmest (with 1881) other than tied records _75F ___ Aug 18 ___1878,1901,13,39 (74F)__1987 (76F) _ 2002 (78F) _66F ___ Oct 7 _____1944 (65F) ___________ 2005 (70F) __ 2005 (70F) __ also 2007,18 (67F) _63F ___ Oct 15 ___ 1915,38,43 (62F) ____ 1960 (65F) __ 2014 (69F) __ also 1975 (66F), 1985,2017 (65F) _________________________________________________________________________________________ 1956 __ This year turned rather cold for much of the time, brief respites around May-June and October-November provided some opportunities for records but the closest call in November was 71F on 16th (72F 1928). Four records were set (random expectation 4.16, so the first year since 1940 to fall short of that), of which three remain intact (75% survival). These broke previous marks by an average of 3.0 F deg. The one broken record fell in 1998, so that if the other three fell later this year, the average extinction year for all four would become 2015. There were three record low maxima, with a count of 2.33 -- 37F Apr 8 tied 1916, 2003, 61F July 6th was lowest all-time for July, and 66F July 26th. From an original count of 3.33, surviving record low minima were set on May 17th (39F), and July 30th (57F), for a count of 2.00. There were three high minima that have survived; May 13th (69F), June 15th (76F tied with 1899, 1945), and Nov 1st (65F), while Dec 7th (53F tied with 1951) survived until 2022 -- count is now 2.33 from the original 7.03. Temp ___ date ___ replaces _ ties ______ broken ___ eventual end of data record max, recent max _89F ___ May 13 __ eventual record .. (1930 2nd (87F), 1944,47,57,2004 t3rd (86F), 1970 7th (85F), 1900,06,85,91 t8th (84F). _99F ___ June 14 __ eventual record .. (1988 2nd (96F), 1892 3rd (94F), 1899,1945,1994 t-4th (92F) 1929,64,83,2005 t-7th (91F)). _84F ___ Oct 15 ___ eventual record .. (1897,1960,75 t-2nd (82F), 1965,85 t-5th (80F), 1915,63 t-7th (79F), 1899 9th (78F), 1947, 90, 2014 t-10th (77F)). _67F ___ Dec 7 ____ 1951 (64F) __________ 1998 (75F) __ 1998 (75F) __ (1956 2nd (67F), 1951 3rd (64F), 1932 4th (63F), 2011 5th (62F)). Record high minima (7.03), end of data 2.33 survived _41F ___ Jan 11 ____________ 1933 (41F) __ 1972 (44F) __ 2020 (51F) __ also 1975 (48F) _40F ___ Feb 9 ____ 1937 (39F) __________ 1990 (45F) __ 2006 (46F) _39F ___ Feb 10 _____1876,81,93,1925 (39F) _1960 (41F) __2024 (47F) __ also 2023 (45F), 1999 (43F), 2020 (42F) _63F ___ Apr 29 ___ 1888,1941 (59F) _____2017 (64F) __ 2017 (64F) __ 1956 later tied by 1983 (t-rec), 2024 (not rec) (63F) _69F ___ May 13 ___ eventual record high minimum __ 1985,91 (66F), broke 1879,1906,42 (64F) _76F ___ June 14 ___ 1899 (73F) __________ 2005 (78F) __ 2005 (78F) __ also 1983 (73F) _76F ___ June 15 ___ eventual record high minimum tied 1899, 1945 __ 1988 (74F), 1902,87 (73F) _62F ___ Oct 23 _____________ 1900 (62F) __ 1979 (67F) __ 1979 (67F) __ 2007 (66F), 2020 (63F) _65F ___ Nov 1 ___ eventual record high minimum __ 1971 (63F), 1982 (62F), broke 1919 (60F) _53F ___ Dec 7 _____________ 1951 (53F) __ 2022 (54F) __ 2022 (54F) __ tie broke 1884,1932 (52F), 1879, 1998 (50F) _____________________________________________________________ 1957 __ Although warmer than 1956 had been, records were fairly infrequent as several opportunities fell short: 85F April 21st was 2 deg below record set in 1923 and 95F June 16th was 2 deg below record set in 1891, 93F on June 18th 2 deg below record set in 1929, 95F Aug 3rd was one deg below ongoing tied 96F (1926,36,75). 91F on Sep 13th was three short of a 1952 record. And 59F was one short of the Dec 20th record from 1895. Only two records were set (count 2.00), with June 17th surviving (50% survival rate). The other record fell in 2011, so that if the June 17 record is broken this year, the average date of extinction of 1957 records would become 2016. The two 1957 records broke previous marks by just one degree each, and the eventual record breaker was three degrees above the July 22 value, with that average falling to 1.5 F deg counting the surviving record. The two records set represent (a) the lowest number so far although the next year had none, and (b) the lowest outcome relative to random expectation (4.1, 49%) since 1909 (39%). There were two record low maxima, 12F on Jan 15th and 51F on May 20th (tied in 2000) (count 1.50). 1957 had two record low minima (0 deg F on Jan 15th, 41F Sep 27th tied 1947) for a count of 1.50. No other records were set and later broken, so once again there is a survival rate of 100%. There were four surviving record high minima, including June 17th (77F), June 18th (76F tied with 2014), and Dec 19th, 20th (45F tied 1949, 2017, and 54F). The count was therefore 2.83. Two other high minima were set, 48F on Feb 26th fell to 49F in 1976 and 80F on July 22 fell to 84F in 2011. At the end of 1957 the count was 5.5, it fell by one in 1976 and one more in 2011, then 0.5 in June 2014 and a further 0.17 in Dec 2017 from ties. Temp ___ date ___ replaces _ ties ______ broken ___ eventual end of data record max, recent max _96F ___ June 17 __ eventual record .. (1952 2nd (95F), 1892,1939,1945 t3rd (93F), 1891,1929 t6th (92F), 1944,62,2017 8th (91F)). _101F __ July 22 ___ 1926,55 (100F) ____ 2011 (104F) _ 2011 (104F) _ (1957 2nd (101F), 1926,55 t-3rd (100F), 1918 5th (98F), 1952,61 t-6th (97F)). Record high minima (5.5), end of data 2.83 survived _48F ___ Feb 26 ___ 1951 (46F) _________ 1976 (49F) __ 1976 (49F) __ 1996 (44F), 1880,1890 (43F) _59F ___ Apr 21 ___ not a record in 1954 (1923 _ 60F was record), remains second highest for date _77F ___ June 17 ___ eventual record high minimum __ broke 1945 (74F), also 1967 (74F), 1892,1905,44 (73F), 2000,04 (72F) _76F ___ June 18 ___ eventual record high minimum later tied by 2014 __ broke 1905 (75F), also 1962 (74F) _80F ___ July 22 ___ 1885,1926 (78F) ____ 2011 (84F) __ 2011 (84F) __ also 1978,1998 (78F) _45F ___ Dec 19 ___ eventual record high minimum tied 1949 and 2017 __ 1967 (44F), broke 1895 (43F) _54F ___ Dec 20 ___ eventual record high minimum __ broke 1895 (47F), also 1998 (46F) ____________________________________________________________________ 1958 __ For the first time in the study, a year produced no record highs, the closest call was 89F on Sep 26th (1881 later tied by 1970 had hit 91F, also 90F in 1895). There were some slightly warmer than average months, including April and November, but warmth was limited. If 1958 had been a starter year, it would have set the following records: 53F Jan 22nd (tied 1891), 91F Aug 15 (1 higher than 1896), 84F Sep 15th (tied 1894), 88F Sep 16th (tied 1894), 83F Oct 10th (7 higher than 1887, would have been broken in 1939), 81F Oct 17th (4 higher than 1878), 62F Nov 14th (1 higher than 1879) so if 1958 had been a starter year, it would have had a rather low count even for that time, of only 5.5, fourth lowest among those years, and its extinction date would have been Oct 10, 1939, third behind 1909 and 1877. The other three years later to set no records (1992, 2004, 2014) all did better than 1958 vs starter years. A low maximum reading of 16F on Feb 17th was a record, but the 10F the previous day had been beaten by 7F set in 1896. Two more record low maxima occurred on June 20th (59F) and 21st (63F, tied by 2003). July 22nd (69F) was also a record (count 3.50). There were no record low minima set during 1958, the third such year after 1908 and 1948. At the time Oct 14th was within 1 deg of the record but that has changed to 2 deg with a lower reading in 1988. There were a number of days within 2 deg of a record low, and June 7th remains there (49F vs 47F in 1879) and by the end of the data, one of the more significant cold readings is now 3F on Feb 18th (record 0F in 1979). Also there were no record high minima, so 1958 was totally shut out of warm records. The closest it came to an eventual high minimum was on Nov 18th (54F vs record of 57F in 1928) and also fairly close again on Sep 26th (70F vs record of 74F in 1895). The closest to an existing record in 1958 was 2F (56F on Nov 15th, record then was 58F in 1869). As with 1924, the minima were compared to starter records, and while 1958 did a little better than 1924 (3.5 vs 1.0), it would still be a low producer by even starter era standards. Four more years will join them as having no high minima, 1963, 1994, 2003 and 2004. No record high minima were established, so none have survived. These six records (count 3.5) would have been set had 1958 been in the starter era. The extinction date is Nov 18, 1921. _38F ___ Jan 26 ____ broke 1878 (37F) __ broken by 1913 (40F). Eventual record 1916 (49F). _38F ___ Jan 27 ___ tied 1880 (38F) __ broken by 1911 (42F). Eventual record 1916 (54F). _37F ___ Jan 29 ___ tied 1891 (37F) __ broken by 1903 (39F). Eventual record 2002 (50F). _40F ___ Mar 26 ___ tied 1884 (40F) __ broken by 1903 (41F). Eventual record 1913 (61F). _75F ___ Aug 14 ___ tied 1872 (75F) __ broken by eventual record 1908 (84F) _54F ___ Nov 18 ___ tied 1896 (54F) __ broken by 1921 (55F). Eventual record 1928 (57F). ____________________________________________________________ 1959 __ June 29th (97F) fell short of 1934's 101F record. A hot August failed to set any daily records (94F 15th and 28th, 93F 20th,21st). Although Sep 5th (90F) crept in to complete a four-way tie, another 93F on Sep 9th fell one short of the 1915 record. 90F on Sep 23rd was well short of 1895 (97F) but the next day's 89F held that record until 2017 (91F). The year was unfortunate to reach a total of only six record highs (count 4.75), of which two have survived (count 1.5). This was a survival rate of 31.6%. The average 1959 record improved on previous values by 1.5 F deg. The average year to break four 1959 records was 1987, which would become 1999 if the two surviving records were broken in the next eight months. The average by which these four were surpassed eventually was 4.0 F deg which reduces to 2.7 F counting the two surviving records. The year had two record low maxima, 61F on June 17th, and a one-third share of Nov 18th (33F tied with 1914, 1924) (count 1.33). There were no surviving record low minima, with the count during the year only 0.5 (46F tied 1950 on Sept 17th, falling later to 45F in 1986, also 43F May 16th remains within one degree of the 1878 record low) and there were seven record high maxima, with two ties giving a count of 5.50 (reduced from 6.0 when May 22, 2022 tied). These were mostly in the spring and summer months : May 12th (67F), May 21st (71F), May 22nd (72F tied with 2022), May 28th (73F), June 30th (79F tied with 1945), Sep 29th (72F tied with 2015) and Sep 30th (70F). There were many readings in the mid 70s not quite into record range in August and early September (average minimum Aug 12 to Sep 10 was 71.9 F). This is a fairly good survival rate from the 8.5 records set during 1959. Temp ___ date ___ replaces _ ties ______ broken ___ eventual end of data record max, recent max _61F ___ Jan 22 ___ eventual record tied by 1916 .. (1906 3rd (60F), 1986 4th (59F), 1973 5th (58F), 1957 6th (57F), 1967 7th (56F), 1932 8th (54F), _91F ___ May 20 __ 1939 (90F) __________ 1996 (96F) _ 1996 (96F) ___ (1959 2nd (91F), 1939,1962,1978 t3rd (90F), 1903 6th (89F)). _94F ___ May 28 ___ eventual record .. (1977,2016 t-2nd (92F), 1918 4th (91F), 1931,39,91 t5th (90F), 2012 8th (89F), 1899,1935 t-9 (88F)). _92F ___ June 10 __ 1906 (91F) __________ 1974 (95F) _ 2008 (96F) __ (1974,84 t-2nd (95F), 1959,64,2000 t-4th (92F), 1906,67,73 t-7th (91F)). _90F ___ Sep 5 _______ 1884,98,1944 (90F) _1961 (93F) __ 1985 (94F) __ (1961 2nd (93F), 1983 3rd (91F), 1884,98,1944,59,70,71 t-3rd (90F)). _89F ___ Sep 24 ___ 1920 (88F) __________ 2017 (91F) __ 2017 (91F) __ (1959 2nd (89F), 1920 3rd (88F), 1961,70 t-4th (87F), 1922 6th (86F)). Record high minima (8.5), end of data 5.5 survived _60F ___ Apr 17 ___ 1896 (59F) __________ 1976 (66F) __ 2002 (74F) __ 1959 later tied by 1969 (60F), also 2012 (61F) _67F ___ May 13 ___ eventual record high minimum __ 1970,1985,1993 (66F), broke 1908 (65F) _71F ___ May 21 ___ eventual record high minimum __ 1978, 1986 (69F), 1975,2013 (68F), broke 1903 (67F) _72F ___ May 22 ___ eventual record high minimum later tied by 2022 __ broke 1875 (69F), also 1903,11 (68F) _73F ___ May 28 ___ eventual record high minimum __ 1991 (72F), broke 1939 (71F), also 2012,16 (71F) _75F ___ June 10 ___ 1906 (71F) __________ 1984 (79F) __ 1984 (79F) __ also 1974 (74F), 2000 (73F) _79F ___ June 30 ___ eventual record high minimum tied 1945 __ 2012 (77F), 1908 (76F) _ _ Aug 12 to Sep 10 __ no records set, but average minimum was 72F _72F ___ Sep 29 ___ eventual record high minimum later tied by 2015 __ also 1979 (71F), broke 1884, 1901 (70F) _70F ___ Sep 30 ___ eventual record high minimum __ 1986, 2010 (69F), broke 1884 (68F) _70F ___ Oct 1 ___ not a record in 1959 (1881, 1954_72F) but remains third highest value for date _ _ Oct 7 to 9 ___ readings of 65F, 66F and 67F were all one degree short of existing records ____________________________________________________________ 1960 __ Only two records were broken or tied in 1960, with a count of 1.50. One has survived (Feb 11, 65F) tied later by 2009, for a count of 0.50 and a survival rate of 33.3%. Although March was very cold, most of the other months were fairly average with few days warm enough to threaten existing records. 87F on Apr 25th was four short of the 1915 record. The hottest days of the year (91F) marked a tie for second lowest annual maximum with 1884, 1889 and 2004. Only 1902 (90F) was cooler. The two records broke or tied existing marks at an average of 1.0 F deg, and the one broken record was eventually topped by 7 F (average 3.5 F for the two). That record was first broken in 1982, so that the average will be 2002 if the Feb 11th record falls in 2022. There were two record low maxima, a quarter share of July 14th (71F) and a reading of 20F on Dec 13th. Three dates in March 1960 came within one degree of adding to this list, the count is 1.25. Record low minima were set on March 11th (14F) and March 26th (20F). A third one was added on Dec 13th (8F). (count 3.0) A fourth record was set on Dec 12th (9F) but that was broken in 1988 (5F), for a survival rate of 75%. There are no surviving record high minima in 1960, from the original count of 3.0 records. The minima now closest to an eventual record are two of those 3.0, now within 2F; 41F on Feb 10th (43F 1999 is record) and 76F on Aug 30 (tied 1953; 78F 1973, t2018 is now record). The extinction date for 1960 high minima was Feb 10, 1999 but the count had fallen to 0.5 after Oct 15, 1975. Temp ___ date ___ replaces _ ties ______ broken ___ eventual end of data record max, recent max _65F ___ Feb 11 ___ eventual record later tied by 2009 .. (1887 3rd (63F), 2018 4th (62F), 1966,81 t-5th (57F), 1925,55,2002 t7th (55F)), _64F ___ Dec 6 ___________ 1912 (64F) __ 1982 (68F) _ 2001 (71F) _ (1982 2nd (68F), 1998 3rd (66F), 1912,60 t-4th (64F), 1951,53,94 6th (63F)). Record high minima (3.0), end of data none survived, extinction date Feb 10, 1999 _41F ___ Feb 10 ___ 1876,81,93,1925,56 (39F)_ 1999 (43F) _ 2024 (47F) __ also 2023 (45F), 1999 (43F), 2020 (42F) _51F ___ Mar 31 ____________ 1945 (51F) __ 1962,81 (57F) _1998 (66F) __ also 1986 (60F) _76F ___ Aug 30 ____________ 1953 (76F) __1973,2018 (78F) _ 1973, 2018 (78F) _65F ___ Oct 15 ___ 1955 (63F) ___________ 1975 (66F) __ 2014 (69F) ______________________________________________________________________________
-
The 1920s were generally quite warm at either end of the decade, (1921-30 is covered here) and cool in the middle portions notably from 1923 to 1926 although with a few notable reversals to summer heat in those years. The overall number of record highs set was 106.9 (count includes reductions for ties). Occasionally two or even three years in the 1920s would successively break an existing record so the number of days of the year with records set in this decade (1921-30) is 97 with five of these being ties of previously set records, so a count of 94.50). That compares to the random expectation of about 64 new records, adding the annual expected values (if we take the interval 10/62 x 366 that is basically the rate expected at the end of the decade but it was 10/53 x 366 at the start). So the 1920s continued to see an accelerated pace of record warmth setting similar to the previous decade. The expected frequency per year dropped from 6.9 in 1921 to 5.9 by 1930. Most years in the decade either met or exceeded their quota, only 1926 fell below it. The decade did manage to stay somewhat ahead of random expectation for record low minima although not at the same pace as some previous decades. 1921 _ This was a generally warm year although one heat wave registered inland (at Toronto for example) in early July had limited impact at NYC, offshore low pressure and cloud held temperatures down to more average values. In addition to records 19 records set (count 17.0 due to four being ties), Mar 7 (68F) was not a record (69F 1871) but was warmer than records set on 6th and 9th. Sep 30 (87F) was also warmer than the previous day which set a record, but in this case did not quite reach the value already set in 1905 (88F). Of the 19 records (expected number after 53 years of data 6.9) three were eventually all-time or ties for a count of 2.50. That is a survival rate of 14.1%. 1921 produced an average increase of 3.9 F deg. Years that broke 16 of these records average 1946, if the three surviving records are broken this year or next, that will change to 1959. The average temperature increase from the 1921 records to eventual records is 5.5 F, which drops to 4.7 if the three surviving records are included. The year also had one record low maximum, 66F on Aug 3rd. 1921 has no surviving record low or high minima. The year set one record low, 56F on Aug 15th, which is now two degrees above the eventual record of 54F (Aug 15th, 1964) which marks the extinction date of 1921 record low minima. A reading of 4F on Jan 25th was one degree above the existing record and is now two degrees above it, since a lower reading (2F) was the eventual record in 1945. That two degree difference is now the closest that 1921 comes to any record low, also equal to the differential for Aug 1st (61F vs record 59F 1895 tied 1964). A reading of 7F on Dec 22nd was the coldest after the record value of 4F set in 1872. The count of 1.0 record low minima is tied second lowest with 1906 and 1910 among years before 1930 (1908 had zero). The year set 4.83 record low minima and most survived into the recent past. At the present time the closest reading of 1921 to an existing record high minimum is within 1F (March 9th 47F broken by 2000 48F) then 2F for Nov 18 (55F) which was quickly broken by 1928 (57F). Temp ___ date ___ replaces _ ties ________ broken ___ eventual end of data record max, recent max _62F ___ Feb 16 __ 1891 (54F) _________ 1954 (71F) __ 1954 (71F) __ 1921 second warmest, 1976 (60F) third, 2006 (59F) 4th. _64F ___ Mar 6 ___ 1894 (62F) _________ 1935 (68F) __ 1935 (68F) __ 1921 second warmest, 2004 (63F) third, 1894 (62F) 4th. _66F ___ Mar 9 ___ 1913 (65F) _________ 2000 (71F) __ 2016 (76F) __ 2020 (72F) 2nd, 1921 4th, later tied by 1977 and non-rec 2002. _64F ___ Mar 16 __ 1913 (63F) _________ 1927 (66F) __ 1990 (82F) _78F ___ Mar 20 __ 1903 (73F) _________ 1945 (83F) __ 1945 (83F) __ 1921 2nd warmest (78F), 2020 third (77F), 2010 fourth (74F). _82F ___ Mar 28 __ 1905 (73F) _________ 1945 (84F) __ 1945 (84F) __ 1921 2nd warmest (82F), 1998 3rd (80F), 1946 4th (79F). _84F ___ Mar 21 __ eventual record .. (1938 74F 2nd, 1948 70F 3rd, 1918 (69F) 4th) _ 2012 (67F). _79F ___ Apr 5 ___ 1910 (75F) __________ 1928 (80F) __ 1928 (80F) __ 1921 2nd warmest (79F), 1989 3rd (77F), 1910, 1985, 2010 t4 (75F). _79F ___ Apr 6 ___________ 1912 (79F) __ 2023 (80F) __ 2023 (80F) __ 1947 also 79F, fifth warmest 2010 (78F), t-6th 1928,1991 (77F)). 8th 1910 76F _78F ___ Apr 21 __________ 1889 (78F) __ 1923 (87F) __ 1923 (87F) _____ 1957 (85F), 1985 (83F). _89F ___ May 22 _________ 1914 (86F) __ 1941 (96F) __ 1941 (96F) _______ 1992 (93F). _92F ___ June 21 _________ 1896 (92F) __ 1923 (96F) __ 1953,88 (97F) _95F ___ June 22 ___ 1888 (93F) ________ 1941 (96F) __ 1988 (98F) ___ 1921 third warmest (95F), 1943 fourth (94F). _95F ___ Aug 30 ____ 1900 (89F) ________ 1953 (98F) __ 1953,73 (98F) __ 1921 third warmest (95F), 1991 fourth (94F). _94F ___ Sep 2 _____ 1898,1914 (93F) ___ 1929 (96F)_ 1953 (102F) __ (2nd 1944 (97F), t3rd 1929,32,80 (96F), t6 1921, 2010 (94F)). _96F ___ Sep 3 _____ 1898 (93F) _________ 1929 (99F) __ 1929 (99F) __ (t2nd 1921, 1973 (96F), 4th 1993 (95F), t5th 1944,53 (94F)). _86F ___ Sep 29 ____ 1884,91 (82F) ______ 1945 (88F) __ 1945 (88F) __ (2nd 1921 (86F), 3rd 1923 (84F), t4th 1959, 2015 (83F)). _73F ___ Nov 18 ___ eventual record later tied by 1928 .. (1953 2nd (72F), 1987 3rd (70F), 1963 4th (69F), 1931,34,38 t4th (68F)). repl 1918 (66F). _72F ___ Nov 19 ___ eventual record .. (1953 2nd (71F), 1934 3rd (69F), 1938 4th (68F), 1900, 1928, 1991 t-5th (67F)). Record high minima (4.83), none have survived, extinction date Apr 6, 2010 _47F ___ Mar 9 ____ 1903 (44F) ____________ 2000 (48F) __ 2000 (48F) __ also 1973 (45F), 1968 (44F) _43F ___ Mar 16 ___ 1898,1902 (41F) _____ 1945 (49F) __ 1990 (55F) __ also 1948 (52F), 2000 (51F), 1973 (49F) _49F ___ Mar 26 ___ 1913 (47F) ____________ 1946 (51F) __ 1986,2021 (52F) _ also 1963, 2000 (51F) _55F ___ Apr 6 _________________ 1912 (55F) __2010 (58F) __ 2010 (58F) __ 1912,21 also tied by 1948 (55F), also 1928 (54F) _75F ___ July 8 ____________ 1876,1900 (75F) _ 1929,81,86 (77F) __ 1993 (80F) __ also 2010,15 (77F) _55F ___ Nov 18 ___ 1896 (54F) _____________ 1928 (57F) __ 1928 (57F) __ also 1928 (54F), 1966 (52F), 1963,1994,2013 (51F) _________________________________________________________________ 1922 _ This was not as warm a year but had some notable warm spells in spring and autumn. Eight records were set, one a three-way tie for a count of 7.33. One survived (Apr 10, 86F) and another was broken earlier in 2021 (March 26). Survival rate is now 13.7%. The average increase of 1922 records over previous is 3.4 F deg. Of the seven that have been broken the average year replacing them is 1950, which changes to 1959 if the surviving record falls next April. The average eventual surplus of record values over 1922 records is 5.3 F, which falls to 4.6 F counting the surviving record. 1922 has one surviving low minimum, 53F on Aug 21 from a rather sparse crop of 3.5 record low minima during the year. There are no surviving record high minima from the initial set of 7.33 records set (matching the original count of high maxima). 58F on April 11 was tied in 1955 and broken in 2017. There were also a couple of 67s October 8, 10 that fell to slightly higher values in 2017 and 1949 then 2018 higher still. Temp ___ date ___ replaces _ ties ________ broken ___ eventual end of data record max, recent max _51F ___ Feb 2 ____ 1877 (49F) _________ 1933 (55F) __ 1988 (59F) _59F ___ Feb 20 ______ 1913,18 (59F) ___ 1930 (69F) __ 1939 (69F) __________ 2018 (67F). _76F ___ Mar 26 ___ 1913 (72F) ________ 2021 (82F) __ 2021 (82F) ___ 1922 2nd warmest (76F), 1986 (75F) 3rd, 1913,43 (72F) t-4th. _86F ___ Apr 10 ___ eventual record .. (second warmest 1871 (80F), third 1887, 1955 (79F), fifth 1991, 2008 (75F). _80F ___ Apr 11 ___ 1887 (78F) _________ 1955 (84F) __ 1955 (84F) ___ (1922 t 2017 third warmest (80F), 2011 2nd (81F). _94F ___ Aug 17 ___ 1913 (93F) _________ 1944 (95F) __ 1944,2015 (95F) __ 1922, 1987, 2002 t3 (94F), 1913,59 t6 (93F). _88F ___ Oct 2 ____ 1878 (79F) __________ 1927 (90F) __ 2019 (93F) __ (1927 2nd (90F), 1922 3rd (88F), 1954 4th (86F)). _89F ___ Oct 5 ____ 1891 (86F) __________ 1941 (94F) __ 1941 (94F) __ (1922 2nd (89F), 1891, 1967 t3rd (86F), 1931,51 t5th (84F). 2007,17 (83F). Record high minima (7.33), none have survived, extinction date Oct 8, 2017 _40F ___ Feb 2 ____ 1877,1903 (39F) ____ 1952 (42F) __ 1952 (42F) __ 1970 (41F), 1922 later tied by 1933 (40F), 1999 (40F) _42F ___ Feb 20 ___ 1909 (41F) __________ 1930 (47F) __ 1939 (48F) __ also 1981, 2018 (47F), 2002 (45F), 1994 (44F) _55F ___ Apr 8 _____1908 (51F) __________ 1929 (65F) __ 1991 (66F) __ also 2010 (64F) _58F ___ Apr 11 ___ 1915,19 (52F) _______ 2017 (61F) __ 2017 (61F) __ 1922 later tied by 1955 (58F), also 2014 (56F) _70F ___ June 8 ___________ 1871,73 (70F) _ 1971 (73F) __ 1984 (77F) __ 1871,73,1922 later tied by 1946,65,66 (70F) _72F ___ June 9 ____ 1876,82,98 (70F) _____1933 (76F) __ 1984 (77F) __ also 2008 (76F) _67F ___ Oct 8 ____ 1908 (64F) ____________ 2017 (72F) __ 2017 (72F) __ 1922 later tied by 1949,82,90,2007 (67F) _67F ___ Oct 10 ___ 1879,1919 (65F) _____ 1949 (69F) __ 2018 (71F) __ also 1990 (68F) ______________________________________________________________ 1923 _ There was a very cold interval right after a record high set on March 23, and the year had a relatively hot June, and a very mild December that was not prolific as far as setting daily records. The annual count was 10.83 with twelve days at least tying records, and of those three remain (count 2.5) for a survival rate of 23.1%. The average increase of 1923 records to previous marks was 3.5F, and the average year breaking nine 1923 records was 1970 (two December records only recently fell in the past decade). Counting the three surviving records, if they fell at next opportunity the average would then be 1984. The eventual surplus of the nine records broken is 4.0 F deg which falls to 3.0 if the three records are counted. 1923 also has three record low maxima, March 31 (34F), and July 31-Aug 1 (65F, 68F). A fourth record set on Apr 14 (42F) was tied in 1929 and broken in 1940 (40F, tied 1948). 1923 produced a count of 7.33 record low minima. Of those, five have survived. There were four record low minima in five days March 28 to April 1, including 10F on March 29 and 12F on April 1, both late season benchmarks and the April 1 low a monthly record value. After that, the year produced one more record low minimum (51F Aug 23) (count 5.0). There was one record high minimum, 60F on April 21st. This is the remnant of a rather sparse count of 2.83 during 1923. Temp ___ date ___ replaces _ ties _______ broken ___ eventual end of data record max, recent max _63F ___ Mar 3 ___________1871 (63F) ___ 1961 (64F) __ 2024 (68F) ___ 1871, 1923, 1972 t 4th, 1961 t1967 t3rd, 1991 (65F) 2nd. _76F ___ Mar 23 ___ eventual record tied by 2012 .. (third warmest 1938 (75F), fourth 1907 (72F) (2nd)). _83F ___ Apr 20 ___ 1915 (82F) __________ 1927 (90F) __ 1927 (90F) ____ also 1976 (89F), 2007 (85F). _87F ___ Apr 21 ___ eventual record .. (second warmest 1957 (85F), third 1938 (85F), fourth 1936,96 (81F). (repl 1921 (78F)). _98F ___ June 20 __ eventual record .. (second warmest 1931,1953 (97F), fourth 1987 (96F), fifth 1893, 1995 (95F). _96F ___ June 21 __ 1893,1921 (92F) _____ 1953 (97F) __ 1953,88 (97F) __ 1923 2nd warmest (96F), 1949 3rd (95F), 1941,2012 t-4th (94F)). _97F ___ June 25 __ 1870,90,98 (94F) _____ 1943 (99F) __ 1943,52 (99F) __ 1923 3rd warmest (97F), 1963 4th (95F) 1997 (93F). _94F ___ June 26 __ 1909 (93F) ___________ 1943 (96F) __ 1952 (100F) ___ (1943,49,63 t-2nd (96F), 1950 5th (95F), 1923 6th (94F) 2003 (93F). _99F ___ July 20 ___ 1876,95 (93F) ________ 1980 (101F) _ 1980 (101F) __ 1991 (100F) 2nd, 1923 3rd (99F), 1957 4th (97F) _90F ___ Aug 3 _______ 1873,79,1913 (90F) _ 1926 (96F) __ 2005 (97F) _64F ___ Dec 13 ___ 1919 (61F) ____________ 2015 (67F) __ 2015 (67F) __ (1923 2nd (64F), 1946,84 t3rd (63F), 2020 5th (62F)). _62F ___ Dec 21 ___ 1902 (54F) ____________ 2013 (65F) __ 2013 (65F) __ (1923 t 2011 t-2nd (62F), 2018 4th (61F), 1990 5th (59F)). Record high minima (2.83), eventual count end of data 1.0 _60F ___ Apr 21 ___ eventual record high minimum __ 1957 (59F), 1954 (58F), 1987 (57F), broke 1869 (57F) _71F ____ June 5 _________1883,1919 (71F)__1925 (78F) __ 1925 (78F) __ also 2010 (76F), 1940 (73F) _77F ____ June 21 ___ 1892 (75F) __________ 2012 (79F) __ 2012 (79F) __ 1923 later tied by 1953, also 1964,88 (76F) _48F ____ Dec 9 ______________ 1889 (48F) __ 1966 (54F) __ 1966 (54F) __ 1991,2004,12,19 (42F) ___________________________________________________________ 1924 _ This was generally a rather cool year and set only 6.5 record highs (although by this time, expected count is around the same). Also, Aug 7 (99F) was not a record (followed 104F 1918), and 96F on Aug 9th also not a rec (98F 1896). These seven records broke previous marks by an average of only 1.6 F deg. None have survived, the last to fall was in Jan 1995. The average year breaking 1924 records was 1947. The average surplus of eventual record highs was 5.0 F deg. The extinction date for 1924 records was Jan 16th, 1995. The year had shares in five record low maxima, two being three-way ties, for a count of 3.67. These were in the spring and again in November (30F on Nov 17 the most notable). The year set five eventual record low minima, for a count of 3.83, from the original count of 9.0 from ten records with two ties. For the first time in the series, there were no record high minima. The next such year would be 1958. During 1924, two minima were within 1F of existing records, 38F Jan 11, and 37F on Feb 3rd. These later fell well behind eventual records, and now the closest minimum to an eventual record is 74F on Sep 1, 2F lower than 76F (1898 at the time, since tied by 1980, 2010 and 2015). If 1924 had been a starter year it would have held two tied records (both third shares, count 0.67) and those would have become extinct by Jan 11, 1909. This technique will be used for all future years without records during the year to compare them to starter years. 1924 would have been the lowest producing starter year (without yet comparing other future years that blank out, checking 1958 it would have managed six records in the starter era (including five ties) for a count of 3.5 and an extinction date of Nov 18, 1921). Temp ___ date ___ replaces _ ties ________ broken ___ eventual end of data record max, recent max _57F ___ Jan 11 ___ 1913 (56F) ___________ 1933 (59F) __ 2020 (69F) _57F ___ Jan 16 ___ 1890 (55F) ___________ 1995 (58F) __ 1995 (58F) ___ 1924 later tied by 1953, second warmest Jan 16th. _95F ___ Sep 1 ____ 1898 (93F) ___________ 1953 (97F) __ 1953 (97F) ___ 1924 later t 1929 and non-rec 1973,80 t3 warmest, 2010 (96F) 2nd. _73F ___ Oct 26 ____1908 (72F) ___________ 1947 (76F) __ 1963,64 (78F) __ (1989 3rd (77F), 1947 4th (76F), 1971,73 t5 (75F), 1924 7th (73F). _61F ___ Dec 8 ____ 1892,1911 (58F) ______ 1927 (65F) __ 1927 (65F) ___ (1951,80 t2 (64F), 1966 4th (62), 1924,56 t-5th (61F)). 1991,2004 (59F). _60F ___ Dec 9 _______________ 1889 (60F) __1946 (61F) __ 1966 (66F) ___ (1991 2nd (64F), 1980 3rd (63F), 1946,53 t4th (61F), 1889,1924,87 t6th (60F). _57F ___ Dec 17 ___ 1888,94 (55F) _________1928 (60F) __ 2000 (62F) ___ (1984 2nd (61F), 1928 3rd (60F), 2015 4th (59F)). No record high minima were established, so none have survived. These two records would have been set had 1924 been in the starter era. The extinction date is Jan 11, 1909. _38F ___ Jan 11 ____ tied 1895,1898 (38F) __ broken by 1909 (39F) that later tied by 1913. Eventual record 2020 (51F). _50F ___ Nov 12 ___ tied 1879, 1882 (50F) __ broken by 1902 (52F). Eventual record 1912,35 (56F). ___________________________________________________________ 1925 _ After a cold January, several dates in February were quite mild but did not set records, e.g. 55F on 11th, 62F on 21st. The only notable warmth in the year came in early June with four record highs in the high 90s that still remain, one of the few four-day consecutive record breaking spells in the data set. Otherwise, one other day plus four ties add up to nine in total and a count of 7.00. This is a survival rate of 57.1% which is the best of any year until 1944 managed 64%. The average surplus of 1925 records to previous values is 2.1 F deg, and the average of the five years breaking 1925 records is 1952. That would change to 1982 if all four of the June records fell this year, although one might speculate that at least the first three of them might be safe for quite a while. The average by which the five broken records have been increased is 4.0 F which falls to 2.2 for the nine counting four surviving records. The year 1925 is also remembered for a very cold October. The year set a total of five record low maxima (count 3.5) of which three were in October (43F Oct 10th, 43F Oct 29th tying 1909, and 38F on 30th which is the monthly minimum value), and also missed breaking a record set in 1872 on Dec 27 (15F) by one degree (16F). Another record is 45F on April 30th. All records have survived but Oct 29th has added a third tie (in 1952) so the count has fallen off to 3.33 now. There were record low minima on seven days (count 5.67) and again several were in October, others have been broken by one or two degrees with the count 9.5 during the year. Two record high minima remain from the June hot spell (78F 5th and 77F 6th). The count during the year was 5.75. Temp ___ date ___ replaces _ ties ________ broken ___ eventual end of data record max, recent max _53F ___ Feb 7 _____________ 1904 (53F) __ 1938 (54F) __ 2020 (56F) ___ (1904,1925,1933,1990 t-3rd (53F), 1965, 2005 7th (52F)). _84F ___ Apr 23 ___________ 1886 (84F) ___ 1996 (85F) __ 2007 (86F) __ 1886, 1925 t3 warmest (84F), 1902,73 t5 (83F). _91F ___ May 23 ___ 1886,1902 (86F) ____ 1964 (94F) __ 1964 (94F) __ 1925 later tied by 1930, 1994 (all t3), 1992 (92F) 2nd. _99F ___ June 4 ___ eventual record .. (second warmest 1919,43 (95F), fourth 1930 (94F).) recent 2010 (88F). _99F ___ June 5 ___ eventual record .. (second warmest 1966 (95F), third 1899 (94F), fourth 1923,30,32 (92F). 2010 (88F). _98F ___ June 6 ___ eventual record .. (second warmest 1899 (95F), third 1953,68 (93F)). 2010 (89F). _96F ___ June 7 ___ eventual record .. (second warmest 1899, 1999, 2008 (94F), fifth 1971,84 (93F).) _91F ___ June 18 ___________ 1905 (91F) __ 1929 (95F) __ 1929 (95F) _________ 1994 (92F). _86F ___ Sep 13 ____________ 1903 (86F) __ 1931 (89F) __ 1952 (94F) _________ 2005 (92F). Record high minima (5.75), eventual count end of data 2.0 _39F ___ Feb 10 _______ 1876,81,93 (39F) __ 1960 (41F) __ 2024 (47F) also 2023 (45F), 1999 (43F) ___________________ ____ ____ ____ ____ ____ ____ ____ 2020 (42F), 1925 etc later tied by 1956 _47F ___ Feb 11 ___ 1898 (42F) __________ 1966 (50F) __ 1966 (50F) __ 2009,18 (45F), 2020 (43F) _49F ___ Mar 11 ___ 1903 (43F) __________ 1967,77 (50F)_ 1967,77 (50F) _ 1925 later tied by 1955, 2016 (48F) _76F ___ June 4 ____ 1897 (71F) __________ 1943 (78F) __ 1943 (78F) __ 2010 (72F) _78F ___ June 5 ___ eventual record high minimum __ 2010 (76F), 1940 (73F) broke 1883,1919,23 (71F) _77F ___ June 6 ___ eventual record high minimum __ 2021 (76F), broke 1899 (76F), 1940 (74F) _46F ___ Dec 4 _____________ 1873 (46F) __ 1938 (47F) __ 1998 (59F) __ also 1982 (58F), 1948 (48F) _____________________________________________________________ 1926 _ The cooler theme of the mid-1920 continued with 1926 which was quite a cold year apart from a hot spell in late July and early August. It was rather similar to 1917 in that regard. There were only five record highs set, one a tie for a count of 4.50 (expected at random 6.29). This was the lowest count after 1909 (3.50) until 1940 (3.33) and the lowest count relative to expected until 1940 (3.33 vs 5.08). None of these 1926 records have survived. The amount by which 1926 broke these five records was 1.8 F on average, and the average year replacing them was 1962. The eventual margin of records over 1926 values was 3.2 F deg. The extinction date for 1926 record highs was Aug 3rd, 2005 (tied with 1936,75 at that time). There were also three record low maxima set, two in the summer months. The original count was 5.83. 1926 set eight record low minima (count 6.33) including Dec 5-7, from an original count of 9.67, which is the second highest after 1920 to the end of the data set (1940 exceeded it at 10.33), and there was one record high minimum (April 23, 60F) from an original count of 3.5. Temp ___ date ___ replaces _ ties ________ broken ___ eventual end of data record max, recent max _100F __ July 21 __ 1885 (99F) ___________ 1930 (102F) _ 1977 (104F) __ 1930, 1980, 1991 (102F) t2, 1926, 1957 t5 (100F). _100F __ July 22 __ 1918 (98F) ___________ 1957 (101F) _ 2011 (104F) __ 1926 later tied by 1955 (100F), t3; 1918 (98F) 5th. _96F ___ Aug 3 ___ 1873,79,1913,23 (93F)__2005 (97F) __ 2005 (97F) ____ 1926 later tied by 1936,75 (96F) t2; 2006 non-rec (96F) t2. _93F ___ Aug 29 ___ 1877,95 (90F) ________1948 (95F) __1953 (99F) ____ 1926 later tied by 1945 (93F) t5, 1948t1973 t2, 2010 (94F) 4th. _89F ___ Sep 25 ____________ 1881 (89F) __ 1970 (90F) __ 1970 (90F) ____ (2nd 1881,1926,2010 (89F), 5th 2017 (88F) t6 1930,68 (87F)). Record high minima (3.5), eventual count end of data 1.0 _60F ___ Apr 22 ___ 1885 (59F) __________ 2016 (62F) __ 2016 (62F) ___ 1926 later tied by 1977 (60F), also 1974 (59F) _60F ___ Apr 23 ___ eventual record high minimum __ 2001 (59F), broke 1891 (58F), also 1996, 2007 (58F) _78F ___ July 22 ______________1885 (78F) _1957 (80F) __ 2011 (84F) __ also 1978, 1998 (78F), 1901,06,55,94 (77F) _77F ___ Aug 3 ____ 1879 (76F) __________ 1975,2006 (77F) _ 1975,2006 (77F) __ also 1995 (77F), 1938,60,79,88 (76F) _________________________________________________________________ 1927 _ There were warm intervals in spring and autumn of 1927, the winter of 1926-27 was generally cold to average at times, and the summer was cool. The year made good use of its warm spells and set 15 records of which three were ties for a count of 13.5. Since 1927, only these years have set more records (granted that the expected number was falling steadily) -- 1930, 1933, and 1949, while 1938 tied 1927. in terms of a ratio to expected, considerably more and mainly recent years have outperformed but the ratio at the time was 218% of expected. Of those 15, four have remained as eventual records (count 4.00) which is a survival rate of (4/13.5) 29.6%, better than most years to that point. The average amount by which 1927 records surpassed previous ones is 2.1 F deg. The average of years breaking eleven 1927 records is 1950 (one was broken just in 2019 so most of the others went fairly quickly). That average changes to 1969 if the four surviving records are broken either later this year or next April. The average surplus of the eventual record highs over 1927 values is 6.4 F deg which reduces to 4.7 F deg if the surviving records are counted also. The year also set two low maximum records, one in late August and a share in early November that has gone from three-way tie to four-way as of 2012 joining, so count at present is 1.25 for those two days. From an original set of 5.33 record low minima (eight with one tie, two three-way ties and one fourth share set), the year retains 2.5 record low minima including -1F on Jan 27, and one record high minimum survives (60F) on Nov 17th, from the original count of 6.83. Temp ___ date ___ replaces _ ties ________ broken ___ eventual end of data record max, recent max _66F ___ Mar 16 ___ 1921 (64F) __________ 1935 (77F) __ 1990 (82F) _67F ___ Mar 17 ___ 1898 (65F) __________ 1945 (75F) __ 1945 (75F) ___ later tied by 1935 _69F ___ Mar 18 ___ 1905 (67F) __________ 1934 (71F) __ 1989,2011 (77F) __ 1969,99 t4 (70F), 1927 6th warmest. _90F ___ Apr 20 ___ eventual record .. (1976 second (89F), 2005 third (87F), 1938 fourth (85F)). repl 1923 (83F). _92F ___ July 14 ____________ 1872 (92F) __ 1936 (93F) __ 1954 (100F) ___ 1927 also tied by 1932 _ 1995 (96F). _92F ___ Sep 15 ___ eventual record .. (1915,42 t 2nd (91F), 1993 (90F) 4th, 1901 (88F) 5th). _88F ___ Oct 1 ____ eventual record .. (1881 2nd (87F), 1950 3rd (86F), 1879 5th (85F), 1897,1968 t6 (84F)). recent 2013 (82F). _90F ___ Oct 2 ____ 1922 (88F) __________ 2019 (93F) __ 2019 (93F) __ (1927 2nd (90F), 1922 3rd (88F), 1954 4th (86F)). _81F ___ Oct 7 ______________1912 (81F) _ 1943 (83F) __ 1944 (88F) __ 1912,27 later tied by 1939. 1990, 2007 (82F). _73F ___ Nov 1 ____ 1919 (72F) __________ 1950 (84F) __ 1950 (84F) __ (1974 2nd (81F), 1982, 2003 t-3rd (77F), 1927,29,52 t-5th (73F)). _71F ___ Nov 16 ___ 1897 (68F) __________ 1928 (72F) __ 1928 (72F) __ (1927, 1956, 1990, 1991 t-2nd (71F), 1960, 2006 (69F) t-6)). _70F ___ Nov 23 ____________ 1913 (70F) __ 1931 (72F) __ 1931 (72F) ___ 1913, 1927 t3 warmest, 1992 (71F) 2nd. _67F ___ Nov 30 ___ 1919 (64F) __________ 1933 (69F) __ 1991 (70F) ___ (1933, 2006 2nd (69F), 1927 4th (67F)). _68F ___ Dec 1 ____ 1908 (64F) __________ 2001 (69F) ___2006 (70F) ___ (1927 t1962 3rd (68F), 1991 6th (66F), 2014 7th (65F)). _65F ___ Dec 8 ___ eventual record .. (1951,80 t2 (64F), 1966 4th (62), 1924,56 t-5th (61F)). 1991,2004 (59F). Record high minima (6.83), eventual count end of data 1.0 _46F ___ Mar 14 ___ 1878,1913 (45F) ____ 1946 (50F) __ 1953 (51F) __ 2012 (50F), 1977 (47F) _48F ___ Mar 18 ___ 1903 (46F) __________ 2010 (50F) __ 2011 (51F) __ 1927 later tied by 1990 (48F) _70F ___ June 11 _________ 1879,83 (70F) _ 1967 (71F) __ 1984 (78F) __ also 1973 (74F), 2015,17 (72F) _69F ___ Oct 2 ____ 1905 (67F) ___________ 1954 (72F) __ 1954 (72F) __ also 1971 (67F), 2002 (66F) _58F ___ Nov 16 _____________ 1892 (58F) _ 2006 (59F) __ 2006 (59F) __ also 1928 (57F), 1960 (54F) _60F ___ Nov 17 ___ eventual record high minimum __ also 1928 (57F), broke 1918 (53F), 1896, 1963, 2010,13 (51F) _51F ___ Nov 23 ___ 1883 (50F) __________ 1931 (58F) __ 1931 (58F) __ also 1934 (55F), 1999 (54F) _50F ___ Nov 30 ___ 1908 (49F) __________ 1934,2001 (56F) _2006 (58F) _ 1927 later tied by 1933 _____________________________________________________________ 1928 _ This year could be described as moderately warm most of the time although the summer was somewhat cooler than average. There were 13 records set or tied, and a count of 11.5. Of those, five have survived, two are ties (for a count of 4.00, one already was a tie upon occurrence, tying 1921, the other became a tie in 1954). That is a survival rate of 34.8%. Also, Nov 17 between two record highs (68F) was not a record (70F, 1896) and 67F on Nov 19 also not a record (72F 1921). The average by which 1928 replaced these was 2.4 F deg. The average of years replacing eight from 1928 was 1947, but that would become 1976 if all five surviving records fell at the next opportunity. The average surplus of eventual records to 1928 records was 7.4 F deg, but this falls to 4.5 if the five surviving values are included. There is only one surviving record low maximum, 62F (June 22) was tied in 1952 (when a few days later readings were near 100F, 1928 did not have that sort of outcome). Count was 0.50 from 2.83 original, the lowest survival rate (17.7%) for any year that had records (in later years, quite a few set no records). There were two record low minima (count 1.50) in February and April, with the original count just 2.75 (four records set with one tied and another becoming a fourth of a four-way tie). The warm autumn managed to retain three high minimum records (Oct 17-18 had 67F and 69F, and Nov 18 had 57F). (count 3.0 from 6.0 set during the year). Nov 16 and 17 were slightly cooler than record high minima already set in 1927 (58F, 60F) both at 57F. Temp ___ date ___ replaces _ ties ________ broken ___ eventual end of data record max, recent max _53F ___ Jan 15 ___ 1870,98 (49F) _______ 1932 (67F) __ 1932 (67F) _80F ___ Apr 5 ___ eventual record .. (1921 2nd warmest (79F), 1989 3rd (77F), 1910, 1985, 2010 t4 (75F)). _94F ___ Aug 4 _____________ 1888 (94F) __ 1936 (95F) __ 1944 (100F) ________ 1993,95 (96F). _90F ___ Aug 15 ____________ 1876 (90F) __ 1938 (96F) __ 1988 (97F) __ 1876, 1928 later tied by 1936 _86F ___ Oct 12 ___ eventual record later tied by 1954 .. (third warmest 1962 (85F), fourth 1949 (83F), fifth 1995 (81F)). repl 1880,86 (78F) _78F ___ Oct 13 ___ 1884 (77F) ___________ 1940 (80F) __ 1954 (87F) __ 1928 later tied by 1930 (78F). recent 1996 (86F). _83F ___ Oct 17 ___ 1908 (78F) ___________ 1938 (90F) __ 1938 (90F) __ (1928, 1963 t2nd (83F), 1958,68, 2016 t4th (81F)). _82F ___ Oct 18 ___ eventual record .. (2016 2nd (81F), 1899,1908,1945 t3rd (79F), 1881,1961,64,68 t6 (78F)). _79F ___ Oct 19 ___ 1905,10 (75F) _________1945 (80F) __ 2016 (85F) __ (1963 2nd (83F), 1965 3rd (81F), 1945 4th (80F), 1928 5th (79F)). _72F ___ Nov 16 ___ eventual record .. (1927, 1956, 1990, 1991 t-2nd (71F), 1960, 2006 (69F) t-6)). _73F ___ Nov 18 ___ eventual record tied by 1921 .. (1953 2nd (72F), 1987 3rd (70F), 1963 4th (69F), 1931,34,38 t5th (68F)). _60F ___ Dec 17 ___ 1924 (57F) ____________1984 (61F) __ 2000 (62F) ___ (1984 2nd (61F), 1928 3rd (60F), 2015 4th (59F)). _59F ___ Dec 18 ___ 1915 (57F) ____________ 1937 (63F) __ 1937,84 (63F) __ (1928, 2006 t3rd (59F), 1990,2001,16 t-5th (58F)). Record high minima (6.0), eventual count end of data 3.0 _44F ___ Jan 8 _____ 1907 (43F) ____________ 1930 (52F) ___ 2008 (53F) __ also 1965 (41F) _75F ___ Aug 30 ___ 1900 (74F) ____________ 1953,60 (76F) _1973,2018 (78F) __ also 1979 (77F) _67F ___ Oct 17 ___ eventual record high minimum __ broke 1878 (65F), 1947 (65F), 1879 (64F), 1908, 2019 (63F) _69F ___ Oct 18 ___ eventual record high minimum __ broke 1899 (67F), 2016 (67F), 1947 (66F). _57F ___ Nov 16, 17 __ not records in 1928 (58F, 60F in 1927) _57F ___ Nov 18 ___ eventual record high minimum __ broke 1921 (55F), 1896, 1958 (54F), 1963, 1994, 2013 (51F) _45F ___Dec 16 ____ 1897 (44F) ____________ 1971 (48F) ___ 2021 (54F) __ also 2015 (46F), 1982 (44F) __________________________________________________________ 1929 _ The temperatures in 1929 were often above normal and occasionally quite variable but the year managed to set 14 records for a count of 13.00. Of those, three have survived (a survival rate of 23.1%). Records set on Apr 7-8 and later broken would have remained as records on a number of later dates, even up to May 1st. The average amount by which 1929 replaced existing record highs was 3.8 F deg. The average of years breaking 1929 records was 1972 and would change to 1983 if the three surviving records were replaced later this year. While the count is now 3.00, it was 8.00 as recently as February 1990. There is just a count of 0.33 record low maxima with a share of the 50F record on May 21st (with 1892 and 1924). From the original 6.33 count of record low minima, there were five eventual record low minima, one is part of a five-way tie and one has two companions so the count is 3.53. 45F on June 3rd is a benchmark value (latest in season) and the second lowest minimum for June after June 1, 1945 (44F). A record high minimum of 65F on April 8 lasted until 1991 (66F) (similarly this could have been a daily record on a number of later dates including May 1st), and the hot spell in early September failed to break records already set in 1898, and another record value set on Nov 2 (64F) lasted to 1971 (67F), 75F on June 19 lasted to 1993, and 77F on July 8 while tied twice lasted to July 8, 1993, so the count for high minima has been zero since July 8, 1993. The count during the year 1929 was 8.5. Temp ___ date ___ replaces _ ties ________ broken ___ eventual end of data record max, recent max _61F ___ Jan 6 ____ 1913, 1916 (58F) _____1946 (62F) __ 2007 (72F) ___ 1929 fourth warmest Jan 6 (1950 second 63F). _62F ___ Jan 19 ___ 1876 (59F) ___________ 1951 (64F) __ 1951 (64F) ___ 1929 second warmest (1949 third (61F)). 1996 (56F). _70F ___ Mar 13 __ 1902 (67F) ___________ 1990 (85F) __ 1990 (85F) ___ 2012 (74F) 2nd, 1995 (71F) 3rd, 1929,2020 (70F) t4th. _77F ___ Mar 22 __ 1918 (69F) ___________ 2012 (78F) __ 2012 (78F) ___ 1929 later tied by 1938 (t2 warmest) 1948 (74F) 4th. _89F ___ Apr 7 ____ 1908 (75F) ___________ 2010 (92F) __ 2010 (92F) ___ 1929 2nd (89F), 1991 3rd (87F), 1942 4th (82F). _88F ___ Apr 8 ____ 1871 (85F) ___________ 1991 (90F) __ 1991 (90F) ___ 1929 2nd (88F), 1871 3rd (85F), 1959 4th (83F). _95F ___ June 18 ___ eventual record .. (second warmest 1944,57,62 (93F), fifth 1945,1994 (92F). (repl 91F 1905,25). _94F ___ June 19 ___ 1873 (92F) _________ 1993 (95F) __ 1994 (98F) ___ 1929 3rd (94F), 1962,1995 4th (93F), 1873,1943,57 t6th (92F)). _95F ___ Sep 1 _____________ 1924 (95F) _ 1953 (97F) __ 1953 (97F) ___ 1924, 1929 and non-rec 1973 1980, t3 warmest, 2010 (96F) 2nd. _96F ___ Sep 2 _____ 1921 (94F) _________ 1944 (97F)_ 1953 (102F) __ (t 2nd 1944 (97F), t3rd 1929,32,80 (96F), t6 1921, 2010 (94F)). _99F ___ Sep 3 ____ eventual record .. (t2nd 1921, 1973 (96F), 4th 1993 (95F), t5th 1944,53 (94F)). _97F ___ Sep 4 ____ eventual record .. (2nd 1961 (94F), 3rd 1973 (93F), t4th 1898, 1937, 1964, 2018 (92F)). _73F ___ Nov 1 ___________ 1927 (73F) ___ 1950 (84F) __ 1950 (84F) __ (1974 2nd (81F), 1982, 2003 t-3rd (77F), 1927,29,52 t-5th (73F)). _76F ___ Nov 2 ___ 1876 (73F) ___________1950 (83F) __ 1950 (83F) __ (1982 2nd (79F), 1968 3rd (77F), 1929 4th (76F), t5th 1971,2001 (75F)). Record high minima (8.5), none have survived, extinction date June 19, 1993 _38F ___ Feb 9 ____________ 1898 (38F) __ 1937 (39F) __ 2005 (46F) __ also 1990 (45F), 1956 (40F) _52F ___ Mar 22 ___1903,18 (46F) ______ 1938 (54F) __ 1948 (57F) ___ 2012 (56F) _65F ___ Apr 8 _____ 1922 (55F) _________ 1991 (66F) __ 1991 (66F) ___ also 2010 (64F), 1962 (53F) _69F ___ May 29 ___ 1876 (68F) _________ 1939 (72F) __ 1969 (74F) ___ 1987 (71F), 2016 (70F) _75F ___ June 19 ___ 1870 (74F) _________ 1993 (76F) __ 1993 (76F) ___ also 1994, 2018 (75F), 1977, 2006 (74F) _77F ___ July 8 _____ 1876,1900,21 (75F)__1993 (80F) __ 1993 (80F) __ 1929 later tied with 1981, 1986 (77F) also 2010,15 (77F) _61F ___ Oct 22 ____ 1920 (60F) __________1935,36 (62F) _1979 (67F) __ 2020 (64F), 1984 (62F) _64F ___ Nov 2 _____ 1876 (59F) __________ 1971 (67F) __ 1971 (67F) ___ 2018 (64F), 1982 (62F) _55F ___ Nov 14 ____ 1909 (53F) __________ 1951 (58F) __ 1951 (58F) ___ also 1961, 2008 (57F) _________________________________________________________________________________ 1930 _ 1930 is most remembered for a very warm spell in late February, and secondly for warmth in May and heat waves in the summer. A reading of 102F on July 21 was the hottest in July to that time (104F in Aug 1918 was hottest of any month until 106F the all-time record set in July 1936). The year set a total of 17 record highs, with three ties reducing the count to 15.50. This count was 263% of the expected 5.9, a rate only exceeded by these years in the period after 1900 -- 1913 (325%), 1931 (285%), 1938 (297%), 1945 (299%), 1949 (318%), 1988 (281%) 1990 (318%) and 1991 (337%), and 1998 (303%), 2001 (468%) -- 1955 and 2015 have similar values to 1930. Of those 17 records, two have survived, one later tied in 1939, for a count of 1.50 and a survival rate of just 9.7%. The average amount by which 1930 broke the earlier set records on 17 dates was 3.8 F deg. The average of years replacing 15 records set was 1961, although one is as recent as Feb 2018. That would change to 1968 if the two surviving records fell next February. The average amount by which 1930 records were surpassed by eventual records is 4.5 F deg which falls to 3.9 if the two surviving records are included. 1930 also accounts for 1.50 surviving record low maxima (Apr 24 tied 1883 at 44F, and Aug 23, 63F). The year retains six record low minima, one tied twice for a count of 5.33, two in spring, two in the summer months despite all the heat, and two in Nov-Dec. The original count was only slightly higher at 5.83, a survival rate of 91.4% which ranks third highest so far after the two years at 100% (1891, 1910). There are three surviving record high minima, one in the February warm spell (51F, Feb 25), two in May (71F May 6 and 70F May 7, tied 1918). The count is 2.50. A minimum of 81F on July 20th tied in 2013 (and later 2020) was broken in 2015 and 2019 (82F). A minimum of 79F on August 5 had already been broken by 81F in 1908. The original count in 1930 was 12.0, which was later surpassed by only four years (1948, 1990, 2015, 2017). Those years all had considerably lower expectations at random being further along in the series, but 1930 did produce more than twice its expected quota, and the most for any year since 1913. In addition to all the records set, several days in August and two days in mid-September fell one degree short of earlier set high minima and the entire annual production was done by July 27th. Jan 2 (48F) also fell one degree short of an existing tied record (1890, 1911 had 49F). Temp ___ date ___ replaces _ ties ________ broken ___ eventual end of data record max, recent max _64F ___ Jan 8 ____ 1907 (60F) ____________ 1998 (65F) __ 1998 (65F) ___ 1930 tied second warmest with 2008 (64F) _62F ___ Jan 9 ____ 1874 (56F) ____________ 1937 (64F) __ 1937, 2008 (64F) __ 1930 fourth warmest with 1998 (63F) third. _57F ___ Feb 19 ___ 1887,1909 (52F) _____ 1948 (64F) __ 1997 (66F) _69F ___ Feb 20 ___ eventual record tied later by 1939 .. (third warmest 2018 (67F), fourth warmest 1943 (63F)). repl 1913,18,22 (59F) _68F ___ Feb 21 ___ 1913 (62F) ___________ 2018 (78F) __ 2018 (78F) ___ 1930 second warmest, 1953 (67F) third warmest, 2002 (63F) fourth. _65F ___ Feb 24 ___ 1913 (62F) ___________ 1985 (75F) __ 1985 (75F) ___ 1930 third warmest, later tied by 1961, fifth warmest 2000 (64F). _75F ___ Feb 25 ___ eventual record .. (second warmest 1976 (70F), third 1985 (67F), fourth 2017 (63F)). repl 1912 (59F). _89F ___ May 5 ___ 1919 (88F) __________ 1949 (90F) __ 1949,55,80 (90F) ___ 1930 later tied by 1934 (t4th warmest 89F). _91F ___ May 6 ___ 1918 (90F) __________ 1949 (92F) __ 1949,86 (92F) ___ 1930 3rd (91F), 1918 4th (90F) 1934,39,2000 t5 (89F). _91F ___ May 7 ___ 1876 (87F) __________ 1939 (92F) __ 2000 (93F) ___ 1930 3rd (91F), 1943 4th (88F), 1876 5th (87F). _85F ___ May 8 _____________ 1872 (85F) _ 1936 (91F) __ 2000 (91F) ___ May 9 86F not a record (91F 1896). _87F ___ May 13 __ 1900,06 (84F) _______ 1956 (89F) __ 1956 (89F) ___ (1930 2nd (87F), 1944,47,57,2004 t3rd (86F), 1970 7th (85F)) _91F ___ May 23 ____________ 1925 (91F) _ 1964 (94F) __ 1964 (94F) __ 1925, 30, 94 (91F) (all t3), 1992 (92F) 2nd. _98F ___ July 19 ___ 1905 (95F) __________ 1977 (102F) _ 1977 (102F) _ 1930 2nd warmest (98F), 1942,63,99 t3rd (97F). _102F _ July 21 ___ 1926 (100F) _________ 1977 (104F)__ 1977 (104F) __ 1930, 1980, 1991 (102F) t2, 1926, 1957 t5 (100F). _96F ___ Aug 5 ____ 1918 (95F) ___________1944 (101F)__ 1944 (101F) __ 2nd 1955 (100F), 3rd 2005 (98F), 4th 1930 (96F). _78F ___ Oct 13 _____________ 1928 (78F) __1940 (80F) __ 1954 (87F) _________ 1996 (86F). Record high minima (12.0), 2.5 have survived _48F ___ Jan 2 ___ not a record in 1930 (record was 1890, 1911 _49F) _52F ___ Jan 8 _____ 1928 (44F) __________ 2008 (53F) __ 2008 (53F) ___ 1933 (44F), 1907,49 (43F), 1965 (41F) _40F ___ Jan 15 ____ 1869,98 (39F) ______ 1932 (48F) __ 1995 (55F) ___ also 1987 (46F) _47F ___ Feb 20 ___ 1922 (42F) __________ 1939 (48F) __ 1939 (48F) ___ 1981,2018 (47F), 2002 (45F), 1994 (44F) _50F ___ Feb 21 ___ 1913 (44F) __________ 2018 (55F) __ 2018 (55F) ___ 1930 later tied by 2002 (50F), 1981 (47F) _42F ___ Feb 22 ___ 1899 (41F) __________ 1981 (43F) __ 1996 (46F) ___ Feb 23rd min was 39F (record then 42F) _50F ___ Feb 24 ___ 1915 (45F) __________ 1985 (54F) __ 2017 (58F) ___ also 1981, 2000 (48F) _51F ___ Feb 25 ___ eventual record high minimum __ broke 1891 (48F), also 1996 (47F), 2020 (46F) _71F ___ May 6 ____ eventual record high minimum __ 1934, 2000 (68F), 1949 (63F), broke 1909 (61F) _70F ___ May 7 ___ eventual record high minimum tied 1918 __ 1894 (64F), 2000 (61F) _69F ___ May 8 ____ 1872,95 (66F) ______ 2000 (70F) __ 2000 (70F) __ also 1943,1964,2024 (65F) _81F ___ July 20 ____ 1876 (76F) _________ 2015,19 (82F) _2015,19 (82F) __ 1930 later tied by 2013 (81F) also 2020 (81F) _77F ___ July 21 ____ 1906 (76F) _________ 1940,49,77 (78F) _ 1980 (82F) __ also 2019 (80F) 1957 (77F) _77F ___ July 27 _____________ 1899 (77F) __ 1995 (78F) __ 1995 (78F) __ also 1882, 2020 (76F) _79F ___ Aug 5 ___ not a record in 1930 (1908 _81F) _72F ___ Sep 16 __ not a record in 1930 (1915 _73F) _71F ___ Sep 17 __ not a record in 1930 (1915 _72F) ______________________________ Decade of the 1930s (1931-40) ______________________ The decade set a total count of 94.65 records, but with a few coming on same dates where one year broke another member's earlier record, the number of days with new records in the decade drops to a count of 86.0 (98 dates but 24 only tied earlier values by end of the decade). This count of 86.0 is still considerably higher than one would expect at random for years 63 to 72 of the series (about 55 record count). 1931, 1933, 1936 and 1938 were relatively productive years. Only 1932 after Jan-Feb, 1937 and 1940 apart from July were relatively non-productive. The decade had some fierce heat waves emanating from the "dust bowl" situation further west and also some long-lasting winter mild records but it also produced the coldest reading of the data set in Feb 1934. 1931 _ A warm year in general, 1931 is most noted for its very warm spells in September and November. As noted above for 1930, only a handful of later years were more productive relative to their expected numbers, and in fact no later year has a higher count than 1931 (16.50) but as each later year had a lower expected number than the 5.8 for 1931, some outdid this year in relative terms. These 16.50 records came from 18 new records of which three were ties. Astoundingly, all but one of them were recorded between June 30th and the end of the year. This extreme warmth lasted into January-February 1932 (six more daily records, 22 in less than eight months) but then faded out and disappeared by spring 1932. A reading of 97F on June 20th fell one degree below an earlier record of 98F in 1923. May 28 and 30, while closer to 90F were also one degree below existing records. Aug 5 (95F) was one degree below a record set the previous year. 99F on Aug 7 had been beaten already by the 104F in 1918. Nov 21 (72F) was second warmest to 1900 (74F). So as impressive as the count is for 1931, it could have been even higher. (July 28, four-way tied eventual record (97F), is counted as 0.5 for 1931 as two years 1949 and 1999 later joined the then existing tie of 1892 and 1931 -- they reduced the eventual record share to 0.25 for each of those years; Dec 19 eventual record is also counted as 0.5 as it tied an earlier value set in 1899 but was later also tied by 2025). Of these 16.50 records, a count of 7.08 survive, this from 10 records, three tied once, one tied twice (1899 and 2025) and the other as noted above now in a four-way tie. This gives a survival rate of 42.9%. The 7.08 count is sixth all-time, behind 9.3 (2001), 8.5 (1991), 8.0 (1953, 1990), and 7.58 (1949). The average increase of the 1931 records was 2.7 F deg. The average year breaking eight that did not survive was 1967, but if all ten of the surviving records fell this year, that would change to 1998. The seven broken records have been surpassed by an average of 4.6 F deg but that falls to 1.9 F counting the ten surviving record values. The year has a one-third share of one record low maximum, 66F on Aug 11th, later tied in 1933 and 1962. (count 0.33) The year 1931 has no surviving record low minima, and only set one tie for a count of 0.50 during the year. That tie (with 1929) on May 23rd (46F) only survived to May 23, 1935 (44F) which becomes the extinction date for 1931 record low minima. The count of 0.5 is the second lowest after 1908 was blanked entirely, until the next zero count in 1948. There are shares of only three eventual record high minima, two tied for a count of 2.00. Another was broken in 2020 (July 28, 78F fell to 80F). The surviving records are 75F (Sept 15, tied in 2015), Nov 22 and 23 (both 58F, first is now tied with 1992). Again, this is a year that probably would hold more record high minima working with today's urban heat island, as several other readings have been outpaced by 2-4 deg since being set). The count during the year 1931 was 9.0 Temp ___ date ___ replaces _ ties ________ broken ___ eventual end of data record max, recent max _93F ___ May 29 __ 1919 (92F) __________ 1969 (97F) __ 1969 (97F) __ (1987 2nd (96F), 1931 3rd (93F), 1919 4th (92F)). _95F ___ June 30 ___________ 1901 (95F) __ 1945 (97F) __ 1964 (99F) __ (1901,31 t3rd (95F), _97F ___ July 28 ___ eventual record tied by 1892, 1949 and 1999 .. (5th warmest 1983 (96F), t6th 1929, 1963, 2015,16 (95F)). _97F ___ Aug 6 ____ eventual record later tied by 1955 .. (1918 3rd (96F), 1900 4th (95F), t5th 1906,24,30,89,2001 (94F)). _97F ___ Sep 10 ___ eventual record later tied by 1983 .. (1989 3rd (94F), 1894, 1897 t4th (93F) 1961, 1965 t6th (92F), 1884 8th (91F)). _99F ___ Sep 11 ___ eventual record later tied by 1983 .. (2013 3rd (96F), 1895,1897,1961,1964 t4th (92F), 1912,89 t8th (91F)). _89F ___ Sep 13 ___ 1903,25 (86F) ________ 1952 (94F) _ 1952 (94F) __ 1931 later tied by 1947,48, 76 t4th ( 2nd 2005 (92F) and 3rd 1957 (91F)). _93F ___ Sep 14 ___ eventual record .. (2016 2nd (91F), 1915, 1995 t3rd (90F), 1976,81 t5th (89F)). _86F ___ Oct 6 ____ 1910 (84F) ____________ 1941 (90F) _ 1941 (90F) __ (1959 2nd (88F), 1946 3rd (87F), 1931,95 t3rd (86F), 1910,90 t5th (84F)). _86F ___ Oct 8 ____ 1916 (84F) ____________ 2007 (87F) _ 2007 (87F) __ (1931 2nd (86F), 1916 3rd (84F), 1990 4th (81F)). _72F ___ Nov 10 __ 1895 (68F) ____________ 1985 (73F) _ 2020 (74F) _ (1931t 1999 t3rd (72F), 1966 5th (70F)). _73F ___ Nov 13 ___ eventual record .. (1964 2nd (71F), 1879,1935 t-3rd (69F), 1945 5th (68F), 1882 6th (67F), 1885,1914,38 t-7th (66F), 2005 9th (65F)). _72F ___ Nov 22 ___ eventual record .. (1940 2nd (70F), 1883 3rd (68F), 1983 4th (67F), 1953, 2007 t-5th (66F)). _72F ___ Nov 23 ___ eventual record .. (1992 2nd (71F), 1913, 1927 t3rd (70F), 1953,79 t5th (66F)). _68F ___ Nov 24 ___ 1886 (64F) _________1979 (73F) __ 1979 (73F) __ (2014 2nd (69F), 1931 3rd (68F), 1999 4th (66F)). _62F ___ Nov 25 ___ 1908 (60F) _________ 1946 (63F) __ 1979 (73F) _________ 2014 (68F). _68F ___ Dec 12 ___ eventual record .. (2015 2nd (66F), 1979 3rd (65F), 1911 4th (63F)). _58F ___ Dec 19 ___ eventual record tied by 1899 and 2025 .. (1895,1929,1967 t-3rd (56F), 2017 6th (55F), 1924,57 7th (55F)). Record high minima (9.0), 2.0 have survived _70F ___ May 30 ___________ 1919 (70F) __ 1986 (73F) __ 1987 (74F) ___ also 2013 (72F) _78F ___ July 28 ____ 1882 (77F) _________ 2020 (80F) __ 2020 (80F) ___ also 1949 (77F), 1921 (76F) _75F ____ Sep 15 ___ eventual record high minimum later tied by 2005 __ broke 1915 (74F), also 1903 (73F) _54F ___ Nov 11 ____ 1880 (53F) _________ 1935 (56F) __ 2020 (64F) ___ also 1970 (57F) _54F ___ Nov 21 ____ 1902,13 (51F) ______ 1952 (55F) __ 1991 (62F) ___ also 1983 (53F) _58F ____ Nov 22 ____ eventual record high minimum later tied by 1992 __ broke 1883 (56F), also 1909,53,91 (55F) _58F ___ Nov 23 ___ eventual record high minimum __ 1934 (55F), 1999 (54F), 1963,91 (53F), broke 1927 (51F) _54F ___ Nov 24 ____ 1896, 1908 (49F) ___ 1979 (61F) __ 1979 (61F) ___ 1999 (56F), 2014 (53F) _51F ___ Dec 23 _____________ 1891 (51F) ___1990 (57F) __ 1990 (57F) ___ also 2015 (52F), 2006 (48F) _50F ___ Dec 24 ____ 1895 (47F) ___________2015 (63F) __ 2015 (63F) ___ also 1941 (49F), 1979 (48F) ______________________________________________________________________ 1932 _ After the notable warmth of the years 1927 to 1931, this year became rather cool relative to normal after one last burst of warmth in January and early February. Eventually 10 records were set (four in January) for a count of 8.83 due to ties. While this was slightly above the expected value at random (5.84) the production of the period from Mar to Nov was below the expected pace. Three of the records (Jan 13 to 15) survive from an interval that saw a remarkable contrast from eastern to western North America, Los Angeles CA having one of its very rare snowfall events at the same time as these record highs. The 70F on Jan 14 was the highest in January until 1950 (72F) (since tied once in 2007) -- the survival rate of 1932 record highs is 34.0%. The average increase of the nine 1932 records over previous marks was 4.3 F deg. The average of years breaking seven 1932 records was 1947 and this would change to 1970 if the three surviving records fell next year. The average surplus of eventual record highs over the seven 1932 records broken is 5.9 F deg which reduces to 4.1 if the three surviving records are counted. There was just a tied record low maximum for the year (Nov 27 tied 1898 with 28F, count 0.50). The year produced four record low minima (count 3.50), mainly in the spring to early summer, but adding 12F also on Nov 27 with the low maximum tied record noted. These were the only records produced in 1932 so the survival rate is 100% for the third time in the series now (1891, 1910 also had 100%). The count of 3.50 is however only 61% of expected at random, so the year has done better long-term than it was doing at the time. The January warm spell had two record high minima, 56F on Jan 13th and 55F on Jan 14th. These remain well clear of any values on these dates since then, and are second and third highest minima for January after 59F on 4th of 1950. The count during the year was only 5.83, and all were in either January or December, with a few close calls during the relatively cool rest of the year. Temp ___ date ___ replaces _ ties ________ broken ___ eventual end of data record max, recent max _68F ___ Jan 13 ___ eventual record .. (1890 2nd (64F), 1972, 2017 t-3rd (62F), 1995 4th (61F), 1990 5th (59F)). _70F ___ Jan 14 ___ eventual record .. (2005 2nd (66F), 1937,1995 t-3rd (64F), 1972 5th (62F), 1949 6th (61F)). repl 1892 (59F). _67F ___ Jan 15 ___ eventual record .. (1937 2nd (66F), 1995 3rd (59F), 2007 4th (57F), 1951,62 t-5th (56F)). repl 1928 (53F). _60F ___ Jan 30 ___ 1914 (58F) ___________1947 (63F) _ 2006 (64F) ___ (2002 3rd (61F), 1932 4th (60F), 2013 5th (59F)). _58F ___ Feb 8 ____ 1890 (55F) __________ 1965 (61F) __ 2017 (62F) ___ (1965 2nd (61F), 1933 3rd (60F), 1932,1990,2001 t4 (58F). _56F ___ Feb 12 ___1877,80 (54F) ________1966 (58F) _ 1999, 2018 (62F) ___ (1984, 2009 t4th (57F), 1932 6th (56F)). _92F ___ July 14 _______1872, 1927 (92F) __1936 (93F) _ 1954 (100F) __________ 1995 (96F). _96F ___ Sep 2 _____________ 1929 (96F) __ 1944 (97F) _ 1953 (102F) __ (t 2nd 1944 (97F), t3rd 1929,32,80 (96F), t6 1921, 2010 (94F)). _63F ___ Dec 7 ___ 1879,84,1911 (58F) ___ 1951 (64F) _ 1998 (75F) _62F ___ Dec 31 __ 1895 (60F) ____________ 1965 (63F) _ 1965 (63F) __ (1932 2nd (62F), 1992 3rd (61F), 1895, 1936, 1990 t4th (60F)). Record high minima (5.83), 2.0 have survived _56F ___ Jan 13 ___ eventual record high minimum __ 2007 (45F), broke 1898 (44F) 1972 also 44F _55F ___ Jan 14 ___ eventual record high minimum __ 1995 (48F), broke 1892 (44F) 2014 also 44F _48F ___ Jan 15 ___ 1930 (40F) ____________ 1995 (54F) __ 1995 (54F) __ also 1987 (46F) _40F ___ Jan 16 ___________1899, 1913 (40F) _ 1995 (53F) __1995 (53F) __ 1899,1913,1932 later tied by 1974 (40F) _48F ___ Dec 3 ____ 1902 (47F) ___________ 1970 (49F) __ 1998 (53F) __ also 1982 (51F), 1932 later tied by 1941 (48F) _52F ___ Dec 7 _______________ 1884 (52F) _1951,56 (53F) _2022 (54F) __also 1879, 1998 (50F) _47F ___ Dec 25 ___ 1895 (46F) ___________ 1964 (49F) __ 2015 (57F) __ also 1979 (50F) ________________________________________________________________________________________________ 1933 _ After another mild winter (1932-33) the spring was rather variable and the summer quite hot, then the autumn was generally much colder than normal, in particular November and December but even so, record highs were set in each autumn month quite against the run of temperatures for the season. There were records set on sixteen days, with four ties and one three-way tie, for a count of 13.33. Of those, seven have survived as records (count 5.58), a survival rate of 41.9%. The average increase of 1933 records over previous marks is 1.9 F deg. The average year breaking nine of these records was 1965, which would change to 1990 if the seven surviving records fell later this year. The average surplus of eventual records to now broken 1933 record values is 4.3 F deg but this drops to 2.4 F deg if the seven surviving records are counted also. The year set three record low maxima (count 2.33), two in the summer months and one in mid-November (32F Nov 15, 30F Nov 16 failed by one degree to beat 1883). From an original count of 6.08, there were four record low minima (count 3.50) including 17F on Nov 16th, an early season benchmark. A low of -6F on Dec 30 while good enough to set a record on almost any other day, was already beaten by -13F in 1917. There are no surviving record high minima from a count of 6.33, the last of those to be surpassed was 80F on Aug 2 which fell to 83F in 2006. June 9th (76F) is now the closest (1F) 1933 minimum to an existing record (1984, 77F) as most of the others were broken several times and by wider margins. Summer heat waves in 1933 may have been slightly less oppressive due to lower humidity than previous years and the larger urban heat island of some later years. Temp ___ date ___ replaces _ ties ________ broken ___ eventual end of data record max, recent max _59F ____Jan 11 ___ 1924 (57F) __________ 1975 (63F) __ 2020 (69F) ___ (1933,80 t-3rd (59F), 1983,2014 t-5th (58F), 1924 7th (57F)). _55F ___ Feb 2 ____ 1922 (51F) __________ 1967 (58F) __ 1988 (59F) ___ (1967,73 t2nd (58F), 1989 4th (57F), 1970,99 t-5th (56F), 1933,83 t-7th (55F).) _53F ___ Feb 7 __________ 1904,25 (53F) __ 1938 (54F) __ 2020 (56F) ___ (1904,1925,1933,1990 t-3rd (53F), 1965, 2005 7th (52F)). _60F ___ Feb 8 ____ 1932 (58F) __________ 1965 (61F) __ 2017 (62F) ___ (1965 2nd (61F), 1933 3rd (60F), 1932,1990,2001 t-4th (58F)). _95F ___ June 8 ___ eventual record .. (1984, 2011 t-2nd (94F), 1971, 1999, 2005,08 t-4th (93F), 1899, t-6th (92F)). _97F ___ June 9 ___ eventual record .. (1984, 2008 t-2nd (96F), 2011 4th (95F), 1939,1959 5th (94F)) repl 1889 (91F). _93F ___ June 12 __ eventual record tied later in 1973, 2017 .. (1967 4th (92F), 1914,1983 5th (91F) 1938,47,49,88 t-6th (90F). _94F ___ July 24 ____________ 1910 (94F) __ 1999 (97F) __ 1999,2010 (97F) __ (1910,33,87,2016 t-3rd (94F), 1929,44 t-7th (93F)). _98F ____ July 30 __eventual record tied by 1917,40,88 .. (fifth warmest 1954 (96F), t6th 1913,29,49,2002 (95F)). _102F __ July 31 ___ eventual record .. (1917, 1954 t2nd (100F), 2002 4th (95F), 1890, 1916, 1950 t-5 (94F)). _100F __ Aug 1 ____ eventual record .. (1917, 1955, 1999 t2nd (98F), 2002 5th (96F), 2006 6th (95F), 1995,2011 7th (94F)). _98F ___ Aug 2 ____________ 1917 (98F) __ 1955 (100F) _ 1955 (100F) __ (1917,33,75 t2nd (98F), 2002,06 t5th (97F) 1995 7th (96F)). _92F ___ Aug 27 ___________ 1900 (92F) __ 1948 (101F) _ 1948 (101F) __ (also 97F 1980, 96F 1993) _90F ___ Sep 27 ___ eventual record .. (1998 2nd (89F), 2017 3rd (87F), 1881, 1972 t4th (86F)). _76F ___ Oct 31 ___1919 (74F) __________ 1946 (81F) __1946,2024 (81F) _ (1933,45,50,61 t3rd (76F), 1919 7th (74F)). 1994 (73F) _69F ___ Nov 30 __ 1927 (67F) __________ 1991 (69F) __ 1991 (70F) ___ (1933, 2006 2nd (69F), 1927 4th (67F)). Record high minima (6.33), none have survived, extinction date Aug 2, 2006 _44F ___ Jan 4 ____ 1906 (42F) __________ 1950 (59F) __ 1950 (59F) __ also 2000 (46F), 1997,98 (44F) _41F ___ Jan 11 ___ 1909,13 (39F) ______ 1972 (44F) __ 2020 (51F) __ also 1975 (48F), 1933 later tied by 1956 (41F) _40F ___ Jan 19 _________ 1876,80 (40F) __ 1943 (42F) __ 1986 (45F) __ also 1973 (44F), 2010 (40F) _40F ___ Feb 2 _____________ 1922 (40F) __ 1952 (42F) __ 1952 (42F) __ also 1970 (41F), 1999 (40F) _50F ___ Apr 2 ____ 1918 (45F) ___________1945 (54F) __ 1967 (61F) __ also 1981,86 (52F), 2000 (51F) _76F ___ June 9 ___ 1922 (72F) ___________ 1984 (77F) __ 1984 (77F) __ also 2008 (76F), 1939,73 (73F) _80F ___ Aug 2 ____ 1879 (75F) ___________ 2006 (83F) __ 2006 (83F) __ also 1955 (79F), 1975,79,95,2020 (77F) _50F ___ Nov 30 _____________ 1927 (50F) __1934,2001 (56F) _ 2006 (58F) _ also 1998, 2016, 2020 (50F) __________________________________________________________________________ 1934 _ Although temperatures in January 1934 were close to average, the rest of the winter was very cold, and February recorded the coldest temperature of all data (-15F) on the 9th. The summer turned quite hot again, and the autumn and December were not far from long term averages. The year produced eight record high maxima (count 6.50 due to three ties), of which one has survived as a record, (101F June 29, tied for June all-time maximum with June 27, 1966). This is a survival rate of 15.3%. The 1934 records added an average of 1.6 F deg to existing values. Seven were later broken by an average year of 1970, if the surviving record is counted then that changes to 1976. The 1934 records were surpassed eventually by an average of 4.6 F deg by record highs by end of the data, which reduces to 4.0 F deg if we also count the surviving record. There were also four record low maxima (count 3.5) including three between Jan 30 and Feb 25. 8F on Feb 9, 1934 is the most impressive of these. Although the year had only a near-expected 5.75 record low minima, 1934 managed to retain four record low minima with a count of 3.50, as noted the low of -15F on Feb 9 is the lowest reading of the station in this study. There may have been a slightly lower value in Jan 1857 (based on records from Toronto and Providence RI) but not likely more than a degree or two lower. So given the partial existence of the urban heat island by 1934, that is quite an impressive reading. Further north, Lake Ontario froze from shore to shore which is quite unusual, only two other years have had even 70% ice cover. In addition, 1934 holds seven "coldest since record low" marks for a count of 5.17, a relatively high number in that category but slightly lower than 1933 or 1940. There were no surviving record high minima, despite the heat records in the daytime, the highest minimum of the summer was a relatively moderate 76F on July 6th (most records are close to 80F in July and August). The count during 1934 was only 2.33, all within November, and the last surviving record to fall was 56F which fell to 2006 (58F) after being tied in 2001, also 54F on Nov 29th fell to 2005, 58F. Temp ___ date ___ replaces _ ties ________ broken ___ eventual end of data record max, recent max _55F ___ Jan 25 _____________ 1916 (55F)__1938 (56F) __ 1967 (60F) __ (2010 2nd (57F), 1938,47,90 t3rd (56F), 1916,34 t6th (55F)). _71F ___ Mar 18 ___ 1927 (69F) __________1989 (77F) __ 1989,2011 (77F) __ 1934 3rd (71F), 1969,99 t4 (70F), 1927 6th (69F). _89F ___ May 5 _____________ 1930 (89F) __1949 (90F) __ 1949,55,80 (90F) ___ 1930, 1934 t4th (89F), 1919 6th (88F), 1944 7th (87F), 2000 8th (86F). _90F ___ May 21 ___ 1912 (89F) __________ 1996 (93F) __ 1996 (93F) ___ (1934 2nd (90F), 1912,1959,1992 t3rd (89F), 1975 6th (88F)). _101F __ June 29 __ eventual record .. (1874 2nd (98F), 1959, 1991 t3rd (97F), 1901,65 t5th (95F)). [June max tied later by 1966] _97F ___ July 7 ____ 1883 (95F) ___________ 1986 (98F) __ 2010 (100F) __ (1986,1993 t2nd (98F), 1934,1994,2012 4th (97F)). _67F ___ Nov 5 ______________ 1900 (67F) __ 1935 (73F) __ 1961 (78F) ___________ 1994 (73F). _74F ___ Nov 20 ___ 1913 (72F) ___________ 1985 (77F) __ 1985 (77F) ___ (1934,42,48,91 t2nd 74F), 1913,41 t-6th (72F), 1953 8th (71F)). Record high minima (2.33), none have survived, extinction date Nov 30, 2006 _54F ___ Nov 4 ___________ 1896, 1903 (54F) __ 1948 (59F) __ 1982 (62F) ___ also 1961,75 (61F), 1994 (58F) _54F ___ Nov 29 ___ 1905 (49F) ____________ 2005 (58F) __ 2005 (58F) ___ also 2011,16 (51F), 2006 (50F), 1998 (49F), 1991 (48F) _56F ___ Nov 30 ___ 1927,33 (50F) _________2006 (58F) __ 2006 (58F) ___ 1934 later tied by 2001 (56F), 1998,2016,20 (50F) ______________________________________________________________________________________ 1935 __ This was not a year of frequent extremes, March was the warmest month relative to normal, and the summer was moderately hot, with some other intervals during the year being rather cold. A brief warming took place around the start of November. This was the only year between 1926 and 1940 that did not exceed its randomly expected number of record highs (5.45) with a count of just 5.00 from seven records, four being ties. One of these has survived (Mar 6, tied in 2022 to reduce the count to 0.5) with the survival rate 10%. The amount by which 1935 records broke existing high marks was an average of 3.0 F deg, and the average year that broke six records from 1935 was 1949, which would change to 1959 if the existing record was included. The average surplus of eventual records to 1935 values was 6.8 F deg which is reduced to 5.9 F with the surviving record counted also. Meanwhile, 1935 set four surviving record low maxima with a count of 3.50 as one was tied (16F Jan 31 tied in 2019). 59F on June 19th is the most notable of them. The other two were in early September and early October. From the original thin pickings of 1.5 record lows, there are no record low minima in 1935 surviving to present time. A reading of 44F on May 23rd was a record until 1963 (43F) and 39F on Oct 8th tied the 1885 record and this tie was replaced by 37F in 1988, so that Oct 8th, 1988 is the extinction date for 1935 record low minima. 1935 is only the fourth year so far examined that failed to maintain some presence in the eventual record low minima (also 1870, 1921, 1931). Also -1F on Jan 28th was the coldest after the record of -2F set in 1925, but 1935 has only a count of 2.5 in that measure. There is now only one remaining record high minimum (count 1.0), 47F on Jan 10th. 56F on Nov 12th (tied with 1912), was broken in Nov 2022. The original count during 1935 was 6.33. Temp ___ date ___ replaces _ ties ________ broken ___ eventual end of data record max, recent max _68F ____ Mar 6 ___ eventual record .. 1921 2nd (64F), 2004 3rd (63F), 1894 (62F) 4th, 1949,76 t5th (61F). _77F ___ Mar 16 ___ 1927 (66F) __________ 1990 (82F) __ 1990 (82F) __ (1935 2nd (77F), 1945 3rd (76F), 1971 4th (69F), 2003 4th (68F)). _67F ___ Mar 17 _____________ 1927 (67F) _ 1945 (75F) __ 1945 (75F) __ (1990 2nd (72F), 1989 3rd (70F), 2003 4th (69F), 1927,35 t5th (67F)). _80F ___ Apr 28 ______________ 1870 (80F) _ 1938 (89F) __ 1990,2009 (90F) __ 83F previous day (1935) not a record (92F 1915). _71F ___ Oct 29 ______________ 1918 (71F) _ 1946 (77F) __ 1971 (78F) __ 1918,35 later tied by 1945 __ recent 1989 (76F). _73F ___ Nov 5 ___ 1900,1934 (67F) ______ 1938 (74F) __ 1961 (78F) __ (1938 2nd (74F), 1935,75,94 t3rd (73F), 1959,2005 t6 (72F)). _68F ___ Nov 6 _______________ 1888 (68F) __1938 (70F) _2024 (80F), 2022 (75F) 1948, 2015 (74F) __ (1959 3rd (73F), 1938,78,94,2020 t4th (70F), 2005 8th (69F)). Record high minima (6.33), 1.0 have survived _47F ___ Jan 11 ___ eventual record high minimum __ 1972 (45F), 2000 (44F) _62F ___ Apr 28 ___ 1908 (59F) __________ 1990,2009 (69F) _1990,2009 (69F) _ 1935 later tied by 1962,83 (62F) _62F ___ Oct 22 ___ 1929 (61F) __________ 1979 (67F) __ 1979 (67F) __ 2020 (64F), 1935 later tied by 1936,42 (62F) _53F ___ Nov 3 __________ 1886, 1909 (53F) _ 1936 (64F) __ 1936 (64F) __ also 1982 (62F), 2003 (60F) _61F ___ Nov 5 ____ 1896 (60F) ___________1938 (63F) __ 2022 (64F) __ also 1961 (62F), 1959 (61F), 1948 (60F), 1994 (57F) _56F ___ Nov 11 ___ 1931 (54F) __________ 1970 (57F) __ 2020 (64F) __ also 1949, 1984 (55F) _56F ___ Nov 12 _____________ 1912 (56F) _ 2022 (60F) __ 2022 (60F) __ also 1982 (55F), 1909 (54F), 1931 (53F) _50F ___ Nov 28 ______________ 1911 (50F) _ 1973 (51F) __ 2011 (56F) __ also 1990 (55F), 1911,35 later tied by 1937 (50F) ___________________________________________________________________________________ 1936 _ This year is remembered for a scorching heat wave in July that set the all-time heat record at NYC (and many other locations in eastern, central North America), 106F on July 9. There were other very warm intervals from May to September. December was quite mild and set a few more records. Otherwise, large parts of 1936 were rather cool, the winter was very cold in the Midwest and this kept values rather low on the east coast as well although not as extreme. There were also intervals of record cold in the autumn. From 15 records set, the count is 12.83. Four have survived, three with later ties, for a count of 2.50. That gives a survival rate of 19.5%. The average increase of 1936 records over previous marks is 2.9 F deg. The average of years breaking eleven of these records was 1967. If the four surviving records were broken in 2021 that changes to 1982. The average surplus of eventual record highs compared to the eleven broken records is 4.0 F deg, which reduces to 2.9 F if the four surviving marks are included. There were at least half a dozen other days where 1936 came within 1-2 deg of existing records mostly in the summer and on Dec 31 (60F). While no record low maximum values were set, 29F on Nov 27 was one degree higher than the already existing 28F (1898, 1932). From its count of 5.83 record low minima, 1936 retained five record low minima, -3F on Jan 23, +1F on Feb 19, 28F on Oct 27 (a monthly minimum value) and 18F on Nov 18 and 19. Only two tied values from 1936 were later replaced. The survival rate of 85.7% ranked fifth to that time. 64F on Nov 3 is the lone surviving record high minimum. Rather surprisingly, the minima on July 9 and 10 were not records, at 77F and 73F. The count during the year was 4.0 from five records, two being ties. Temp ___ date ___ replaces _ ties ________ broken ___ eventual end of data record max, recent max _91F ___ May 8 ___ eventual record tied later by 2000 .. (1943 3rd (89F), 1964 4th (87F), 1872,1930,1963 t5th (85F)). _92F ___ May 9 ___ 1896 (91F) ____________ 1979 (94F) __ 1979 (94F) __ (1936 2nd (92F), 1896, 2000 t3rd (91F), 1970 5th (90F)). _90F ___ May 18 ______________ 1906 (90F) _ 2017 (92F) __ 2017 (92F) __ (1906,36 t-2nd (90F), 1962 4th (89F), 1877,1977 t5th (88F)). _92F ___ May 24 ___ 1880,1904,12 (86F) __ 1975 (93F) __ 1975 (93F) __ (1936 2nd (92F), 1964 3rd (91F), 1955,1995 t-4th (87F)). _106F __ July 9 ___ eventual record .. 1993 2nd (101F), 1937 3rd (100F), 1876 4th (98F), 1912 5th (97F) [ July and all time max ] _102F __ July 10 __ eventual record later tied by 1993 .. 1937 3rd (100F), 1911,1988 t-4th (99F), 1926 6th (97F)). _93F ___ July 14 ___ 1927,32 (92F) _________ 1942 (95F) __ 1954 (100F) _ (see 1942 for top seven) __ 1996 (95F) _96F ___ Aug 3 ________________ 1926 (96F) __2005 (97F) __ 2005 (97F) ____ 1936 tied by 1926,75 (96F) t2; 2006 (96F) non-rec t2. _95F ___ Aug 4 ____ 1888,1928 (94F) _______ 1944 (100F) _ 1944 (100F) __ (1993,1995 t2 (96F), 1936,55,2005 t4 (95F)). _90F ___ Aug 15 __________1876, 1928 (90F) _ 1938 (96F) __ 1988 (97F) _77F ___ Oct 20 ______________ 1916 (77F) __ 1938 (78F) __ 1947,1969 (80F) __ (1965 3rd (79F), 1938,53 t-4th (78F), 1916,36 t-6th (77F)). _ 1984 (76F). _75F ___ Nov 3 ____ 1903 (68F) ____________ 1990 (78F) __ 2003 (79F) ___ (1936 3rd (75F), 1974,1982,2017 t4 (74F), 1953 6th (73F)). _63F ___ Dec 26 ___ eventual record later tied by 1982 .. (1889 3rd (62F), 1895, 1964 t-4th (60F), 2015 6th (59F)). _60F ___ Dec 27 ___ 1895 (56F) ____________ 1949 (63F) __ 1949 (63F) ___ (1973,2015 t-2 (61F), 1936,1964,2016 t-4th (60F)). _59F ___ Dec 28 ___ 1907 (54F) ____________ 1954 (61F) __ 1982,2008 (65F) __ (1954 3rd (61F), 2018 4th (60F), 1936,49,1988 t-5th (59F), 1984 8th (56F)). Record high minima (4.0), 1.0 has survived _50F ___ Mar 17 ___ 1898 (45F) ____________ 1990 (53F) __ 1990 (53F) ___ also 2003 (48F), 1945 (46F) _53F ___ Mar 30 ___ 1910 (51F) ____________ 1945 (58F) __ 1998 (59F) _77F ___ July 9 ___ not a record in 1936 (going with hottest day, 106F) _ record then was 78F and eventually 80F _64F ___ Oct 7 ___________________ 1903 (64F) _ 1944 (65F) __ 2005 (70F) __ also 2007,18 (67F), 1955, 2017 (66F) _62F ___ Oct 22 __________________ 1935 (62F) _ 1979 (67F) __ 1979 (67F) __ 2020 (64F), 1935,36 later tied by 1942 (62F) _64F ___ Nov 3 ____ eventual record high minimum __ 1982 (62F), 2003 (60F), broke 1886,1909,1935 (53F) _ late Dec, mild in general, lows were closer to 40F than records in mid to high 40s _ no records set _______________________________________________________________________________________ 1937 _ This year was rather similar to 1932; it featured a very mild January and mostly rather cold weather in other months, with a few bursts of heat in the summer but not as spectacular as some of the 1930s summers had been (the severe heat stayed more confined to the central plains and prairies which did see almost a repeat of the 1936 heat waves). Not only did the mild weather resemble 1932, it came on similar dates and the month lost out on some potential record breakers that went up against the near-70F mild spell of 1932, and would have set records on most other dates (64F on 14th, 66F on 15th, neither broke the 1932 records). Another two record opportunities were lost with 93F May 31, June 1 already beaten by 1895 (and 1939 for May 31 later tied 1895). 1937 then tried its luck against the 1936 heat wave records on July 9, 10, with 100F both days failing to dislodge 106F and 102F records set the previous year. It was able to secure a tie (98F) on July 8 with 1890 (1936 97F on that occasion). There were seven record highs for a count of 5.50 (three were ties), which is barely above expectation (5.29 from this 69th year of the series). Of these, two have survived, both later tied, for a count of 1.00 and that is a survival rate of 18.2%. The average increase of these 1937 records over previous values is only 1.3 F deg. The average year breaking five of the 1937 records was 1959, and this changes to 1977 if the two surviving records are also broken during this coming twelve months. The average surplus of eventual records to the five now broken has been 4.8 F deg but this reduces to 3.4 F deg if the two surviving records are included. The year 1937 has shares of two record low maxima, for a count of 0.83. The year has no surviving record low minima, and only had a count of 1.2 record lows at the time. After becoming the fifth member of a large tied group for Oct 14th (38F) these all fell to 37F in 1988. The only solo record set was 45F for Sept 18th, broken by 44F in 1990 which provides the extinction date (Sept 18th, 1990) for 1935's record low minima. There was one high minimum record, 50F on Jan 9th which both increased that record by three degrees, and has remained three clear since. Otherwise the year was rather unproductive with the original count only 3.67. Two very warm readings (76 and 77 F) on Aug 20 and 21 fell one short of 1906 records. Temp ___ date ___ replaces _ ties ________ broken ___ eventual end of data record max, recent max _64F ___ Jan 9 ___ eventual record later tied by 2008 .. (1998 3rd (63F), 1930 4th (62F), 2006 5th (60F), 1933,78 t6th (58F)). _51F ___ Feb 9 ________________ 1898 (51F) __ 1949 (60F) __ 1990 (63F) _98F ___ July 8 _________________1890 (98F) __ 1993 (100F) _1993 (100F) __ (1890,1937 t2nd (98F), 1936,88 t-4th (97F), 1962,71 t-6th (96F)). _95F ___ Aug 20 ___ 1869 (93F) _____________ 1955 (97F) __ 1955 (97F) __ (1983 2nd (96F), 1937 3rd (95F), 1869, 1959 t-4th (93F)). _95F ___ Aug 21 ________________ 1869 (95F) _ 1955 (96F) __ 1955 (96F) __ (1869,1937,1995 t2nd (95F), 1899, 1942, 1959, 2005 t5th (93F)). _64F ___ Nov 14 ___ 1902 (63F) _____________ 1941 (66F) __ 1993 (72F) __ record broken three times 1951 to 1973, tied 1980 _63F ___ Dec 18 ___ eventual record later tied by 1984 .. (1928, 2006 t3rd (59F), 1990,2001,2016 t-5th (58F)). Record high minima (3.67), 1.0 has survived _50F ___ Jan 9 ___ eventual record high minimum __ broke 1876 (47F), recent also 1998,2008 (47F) _39F ___ Feb 9 ____ 1898,1929 (38F) ________ 1956 (40F) __ 2006 (46F) __ also 1990 (45F) _79F ___ July 9 ____ 1905 (78F) _______________ 1981 (80F) __ 1981 (80F) __ also 1993 (78F), 1912,36,39 (77F) _79F ___ July 10 _________________1905,10 (79F) _ 1993 (80F) __ 1993 (80F) __ 1905,10,37 later tied by 1981 (79F) _76F ___ Aug 20 ___ not a record in 1937 (record was 77F in 1906, later tied 1983, 2015) _77F ___ Aug 21 ___ not a record in 1937 (record was 78F in 1906) _50F ___ Nov 28 _________________1911,35 (50F) _ 1973 (51F) __ 2011 (56F) __ also 1990 (55F), 2001 (53F) _____________________________________________________________________________________________ 1938 __ 1938 has the reputation of being a warm year globally and it produced very warm March and November readings in both the CET (Central England Temperature) series and in North America. Other portions of the year were perhaps more average although prone to some brief warm spells also. There were sixteen record highs with one tie for a count of 15.50. Of those, two remain (Oct 17 and Nov 7) for a survival rate of 12.9%. For years that ever had record highs after 1938 (all but four), this is a lower survival rate than all except 1968 and 1978 which had only a few and lost them (zero survival rates). Conversely, 15.50 record highs is a higher count than managed by any year after 1938 and at 297% of expected, is higher than all but 1945 (299%), 1949 and 1990 (318%), 1991 (337%), 1998 (303%) and 2001 (468%), with 2015 fairly close (from 6.50 vs 2.48 expected) at 262%. We are eventually going to run into years that broke only records set after 1900, but 1938 has nine among the sixteen it set breaking (by then) long-lasting starter records (some of which had been tied after 1900). The average by which 1938 broke previous records was 3.3 F deg. The average year breaking 14 of these records was 1970, which changes to 1977 if the two surviving records fell later this autumn. The average surplus of eventual records compared to 1938 values was 3.4 F deg which reduces to 2.9 F if the two surviving records are included. 1938 also produced 2.00 low maxima -- 60F on June 28 and 29F on Nov 25 (both have been approached by 2-3 deg since). The 60F max on June 28 is a benchmark value, the next time a reading that low is encountered is Aug 21 (59F 2007). 1938 has shares of four low minima, but the count is only 2.00 (one tie is six-way and one is three-way, another two-way). The exclusive record is also on Nov 25th (19F), the next day 16F is shared with 1880. The original count of 4.33 was somewhat below the expected at random value. On the other extreme, the year holds four record high minima. 42F on Feb 6 tied a value set in 1886. 79F on Aug 16 like the previous record remains one degree clear of any more recent challenges. Then the interval Nov 5-7 had minima of 63F, 64F, and 63F. The two at 63F remained records and remained one and five degrees clear of any more recent values, but the 64F fell to 66F in 2015 (tied 2022). However, Nov 5 fell to 64F in 2022 (count now 2.50). It seems that Nov 1938 and 2015 were having similar contests with each other in both the CET and NYC (and Toronto) records. The count during the year was 9.0 from ten records with two being ties. Temp ___ date ___ replaces _ ties ________ broken ___ eventual end of data record max, recent max _56F ___ Jan 25 ___ 1916,34 (55F) _______ 1967 (60F) __ 1967 (60F) __ (2010 2nd (57F), 1938,47,90 t3rd (56F), 1916,34 t6th (55F)). _55F ___ Feb 2 ____ 1922 (51F) __________ 1967 (58F) __ 1988 (59F) __ (1967,73 t2nd (58F), 1989 4th (57F), 1970,99 t-5th (56F), 1933,83 t-7th (55F).) _58F ___ Feb 6 ____ 1896 (57F) __________ 2008 (68F) __ 2008 (68F) __ (1938,1991 t2nd (58F), 1896 4th (57F), 1960 5th (56F)). _54F ___ Feb 7 ____ 1904,25,33 (53F) ____2020 (56F) __ 2020 (56F) __ (1938 2nd 54F, 1904,1925,1933,1990 t-3rd (53F), 1965, 2005 7th (52F)). _58F ___ Feb 14 ___ 1884 (56F) __________ 1946 (63F) __ 1946 (63F) __ (1949 2nd (59F), 1938, 1990, 2011 t3rd (58F), 1984 6th (57F)). _77F ___ Mar 22 _____________ 1929 (77F) _ 2012 (78F) __ 2012 (78F) __ (1929,38 t2nd (77F), 1948 4th (74F), 1979 (73F)). _84F ___ Apr 15 ___ 1896 (79F) __________ 1941 (87F) __ 1941 (87F) __ (1938 2nd (84F), 1960 3rd (83F), 2002 4th (82F), 2003 5th (81F)). _89F ___ Apr 28 ___ 1870, 1935 (80F) ____ 1990 (90F)__1990,2009 (90F) __ (1938,62 t3rd (89F), 1969 5th (86F), 1983,2017 t6 (85F)). _96F ___ Aug 15 ___ 1876, 1928,36 (90F) _ 1988 (97F) __ 1988 (97F) __ (1938 2nd (96F), 1944,47,85 t-3rd (95F), 1959,70 t6 (94F)). _95F ___ Aug 16 ___ 1888 (94F) ___________1944 (96F) __ 1944 (96F) __ (1938 2nd (95F), 1888 3rd (94F), 1970,1997,2002,2015 t4th (93F)). _90F ___ Oct 17 ___ eventual record .. (1928, 1963 t2nd (83F), 1958,68, 2016 t4th (81F)). [latest 90F reading of autumn] _78F ___ Oct 20 ___ 1916,36 (77F) ________ 1947 (80F) __ 1947,69 (80F) _ (1965 3rd (79F), 1938,53 t-4th (78F), 1916,36,39 t-6th (77F)). _ 1984 (76F). _74F ___ Nov 5 ___ 1935 (73F) ____________ 1961 (78F) __ 1961 (78F) __ (2022 2nd (76F), 1938 3rd (74F), 1935,75,94 t4th (73F), 1959,2005 t7th (72F)). _70F ___ Nov 6 ___ 1888,1935 (68F) _____1948,2015 (74F) _ 2024 (80F), 2022 (75F) __ (1959 5th (73F), 1938,78,94,2020 t6th (70F), 2005 10th (69F)). _78F ___ Nov 7 ___ eventual record .. (2022 2nd (77F), 2020 3rd (74F), 2015 4th (72F), 1975 5th (71F), 1965 6th (70F), 1885 7th (69F)). _71F ___ Nov 8 ___ 1890 (69F) _____________ 1945 (72F) __ 1975 (76F) __ (2020 2nd (75F), 1945 3rd (72F), 1938 4th (71F)). Record high minima (9.0), 4.0 have survived _42F ___ Feb 6 ___ eventual record high minimum tied with 1884 __ 1915, 1991, 2008 (41F), 2005 (40F) _54F ___ Mar 22 ___ 1929 (52F) __________ 1948 (57F) __ 1948 (57F) ___ 2012 (56F), 2003 (51F) _56F ___ Mar 23 ___ 1907 (52F) __________ 2012 (58F) __ 2012 (58F) ___ 1979, 2007 (51F) _79F ___ Aug 16 ___ eventual record high minimum __ 2016 (78F), 1895, 1978 (77F) _63F ___ Oct 14 ___ 1899,1915 (62F) _____ 1954 (66F) __ 1990 (68F) __ also 1970, 71 (64F), 1918, 2014 (63F) _62F ___ Oct 15 ______________ 1915 (62F) _ 1955 (63F) __ 2014 (69F) __ also 1975 (66F), 1960 (65F), 1915,38 later tied by 1943 (62F) _63F ___ Nov 5 ___ 1935 (61F) __________ 2022 (64F) __ 2022 (64F) __ also 1961 (62F), 1935 (61F), recent was 2014 (57F) until 2022 _64F ___ Nov 6 ___ 1885 (58F) __________ 2015, 2022 (66F) __ 2015, 2022 (66F) __ also 1948, 1994 (61F) _63F ___ Nov 7 ___ eventual record high minimum __ broke 1885 (60F), recent 2008 (58F) _47F ___ Dec 4 ____1873,1925 (46F) ____ 1948 (48F) __ 1998 (59F) __ also 1982 (58F) _____________________________________________________________________________________ 1939 __ This year was generally rather variable with warmest spells in May and October. There were eleven new record highs but with ties reducing the count to 7.33. Three of these have survived as eventual records (two tied existing ones for a count of 2.00). That is a surivival rate of 27.3%. The average by which these 1939 records broke existing marks was only 1.6 F and most were either ties or increases of 1 deg, only the Oct 10th (91F) mark produced any large increase. Of the eight records broken, the average year was 1960 which changes to 1977 if the three surviving records fall within the next year. The average surplus of eight eventual record highs to the 1939 marks since broken is 6.4 F deg which reduces to 4.6 F counting the three unbroken records. The year set no surviving record low maxima and came no closer than 4 deg to any eventual values on four occasions during the year. The year originally set 1.0 record lows (two ties) and now has only a surviving one-third share in the record low for Oct 18 (35F) (count 0.33) -- at the time only one other year was in that Oct 18th tie so it counted for 0.5, the other now extinct record tie was with 1936 for March 11th. The count of 1.0 was tied with several other years for third lowest (behind zero in 1908 and 0.5 in 1931). Also there was one record high minimum, 48F on Feb 20. (1.00). The count during 1939 was 5.0. Temp ___ date ___ replaces _ ties ________ broken ___ eventual end of data record max, recent max _62F ___ Feb 15 ___ 1915 (58F) ____________1949 (73F) __ 1949 (73F) ___ (1954 2nd (69F), 1939,2018 t-3rd (62F), 1967 5th (60F). _69F ___ Feb 20 ___ eventual record tied by 1930 .. (third warmest 2018 (67F), fourth warmest 1943 (63F)). _72F ___ Mar 24 ______________ 1913 (72F) _ 1988 (76F) __ 1988 (76F) ___ (1913,39 t2nd (72F), 1987 4th (71F). 2000 5th (69F)). _73F ___ Mar 27 ______________ 1914 (73F) _ 1945 (74F) __ 1998 (83F) ___ (2007 2nd (78F), 1949 3rd (75F), 1945, 1985 t-4th (74F)). _92F ___ May 7 ___ 1930 (91F) ____________ 2000 (93F) __ 2000 (93F) ___ (1939 2nd (92F), 1930 3rd (91F), 1943 4th (88F), 1876 5th (87F)). _90F ___ May 20 __ 1903 (89F) ____________ 1959 (91F) __ 1996 (96F) ___ (1959 2nd (91F), 1939,1962,1978 t3rd (90F), 1903 6th (89F)). _96F ___ May 31 ___ eventual record tied by 1895 .. (3rd warmest 1987 (94F), 4th warmest 1929,1937,1986 (93F)). _93F ___ June 17 ______________ 1892 (93F) _1952 (95F) __ 1957 (96F) _ (1892,1939,1945 t3rd (93F), 1891,1929 t6th (92F), 1944,2017 8th (91F)). _81F ___ Oct 7 __________ 1912,1927 (81F) __ 1943 (83F) __ 1944 (88F) ______________ 1990,2007 (82F). _91F ___ Oct 10 ___ eventual record .. (1949 2nd (88F), 1958,61 t-3rd (83F), 1997 5th (81F)). (repl 1919 (80F)). _61F ___ Dec 10 _____________ 1911 (61F) ___1946 (70F) __ 1946 (70F) __ (2008 2nd (65F), 1953 3rd (63F), 1966 4th (62F), 1911,39 t5 (61F)). Record high minima (5.0), 1.0 has survived _42F ___ Feb 19 _____________ 1909 (42F) __ 1981,97 (48F) _2017 (53F) __ also 1961 (41F) _48F ___ Feb 20 ___ eventual record high minimum __ broke 1930 (47F), also 1981, 2017 (47F) _71F ___ May 28 ___ 1918 (70F) __________ 1959 (73F) __ 1959 (73F) __ also 1991 (72F), 2012,16 (71F) _72F ___ May 29 ___ 1929 (69F) __________ 1969 (74F) __ 1969 (74F) __ also 1987 (71F), 2016 (70F) _71F ___ June 12 ______ 1880,1898,1914 (71F) _1942,73,97 (72F) _ 2017 (76F) __ also 2015 (73F) _74F ___ Aug 18 _______ 1878,1901,1913 (74F)_1955 (75F) __ 2002 (78F) __ also 1987 (76F) _47F ___ Dec 2 _____ 1899 (46F) ___________1970 (49F) __ 1982 (52F) __ 1939 later tied by 1968 (47F) __________________________________________ 1940 _ This was generally a very cold year with few record highs, almost all were in July. Some warmth in early June missed record status by 1-2 deg. (94F June 4, 93F June 13). With four records set or tied, the count was only 3.33 (the July 30 eventual record was at the time a three-way tie, is now a four-way eventual record tie, one of only two such groupings, the other being two days earlier). The count relative to expected (5.08) is a lower ratio than most years, with four failing to set any later in the record (1958, 1992, 2004, 2014), the only other years that did worse than 1940 at setting record highs were 1943, 1957, 1960, 1968, 1978, 1981, 1994, 2003 and 2019 with 1971 about equal. On the other hand, three of the four records set remain intact, with the count 1.75, for a survival rate of 52.6%. Only 1925 (53.3%) had a better survival rate before 1940, by 1960 there would be nine more at a better rate (1940 remained second until 1944). The four 1940 records increased by an average of 1.75 F deg over earlier records, and the average year breaking a 1940 record is the only one to do so, 1954, so that statistic would change to 2004 if the three July records all fell this year. The average by which four 1940 records have been increased is only 1.75 F (seven deg for the Oct 13th record). Meanwhile, 1940 had a total of six surviving record low maxima (count 5.00) mostly in the spring to early summer then two in late August, with 59F on June 24 a benchmark. There were also six record low minima at similar times to the record low maxima, but including some in October, for an eventual count of 5.50. The original count at the end of 1940 had been 10.5 and this is the highest value from 1940 to the end of the data set, and the highest after 1920 had 11.08. The ratio of actual to expected numbers of record low minima (2.08) was third highest to 1888 (3.26) and 1875 (2.35). 1940 also ranks third for the number of coldest minima after records had been set (count 7.75) behind only 1967 and 1976. The year produced one high minimum (July 21, 78F) which was tied in 1949 and again in 1977, then broken in 1980 (82F) so the extinction date is July 21, 1980. The closest 1940 now comes to an eventual record high minimum was three degrees short on two occasions, 39F on Feb 7, record 42F in 1904, and 74F June 6, record 77F in 1925; there are several within 4F including the record broken in 1980 and also July 27 and 30, and Dec 28 (43F, record 47F in 2008). Temp ___ date ___ replaces _ ties ________ broken ___ eventual end of data record max, recent max _98F ___ July 26 ___ eventual record .. (1966 2nd (97F), 1892,1963,1989,2005 t3rd (96F), 1893, 1951, 1982 t7 (95F)). _98F ___ July 27 ___ eventual record later tied by 1963 .. (1955,2005 t-3rd (97F), 1999 5th (96F), 1899 6th (95F), 1941,51 t-7th (94F)). _98F ____ July 30 __eventual record tied by 1917,33,88 .. (fifth warmest 1954 (96F), t6th 1913,29,49,2002 (95F)). _80F ____Oct 13 __ 1928,30 (78F) _________ 1954 (87F) _ 1954 (87F) __ (1995 2nd (86F), 1940, 61 t3rd (80F)). Record high minima (1.0), none have survived, extinction date July 21, 1980 _78F ____ July 21 __ 1930 (77F) ___ 1940 later tied in 1949, 77 (78F) __ 1980 _82F
-
The 1901-10 decade broke a total of 67 starter high maximum records and tied 14. This is a fairly random outcome, as 10 years vs 32 previous records should break (10/42) of the records, or about 87. The total record count was 91.58, of which only 2.5 have survived to 2023. The count of set records is higher than the number of starter records broken because some were broken again during the decade. The percentage of surviving records (only 1901 and 1907 have retained any) is lower than any part of the starter era or later decades. Overall the 1901-10 decade did not outpace the starter era, as the expected number of records was around 97. In the annual analyses to follow, we can introduce one new statistic, average amount by which each year broke records The other stats being tracked will continue here. As more years are introduced, the expectation of the number of records gradually falls. It was a constant 11.4 in the starter era. In this decade, it falls to 8.7 by 1910. This will also be tracked to give a better understanding of the record counts. The decade broke considerably more high minima than maxima, the total number of records set being over 130 although there were frequent cases of multiple records set successively on the same dates. 1903, 1906 and 1908 were all able to break over 24 starter record (plus 1901, 1902 and in some cases 1904, 1905 and 1907) record high minima. A lot of those were then broken again later in the series. Note added June 14, 2022. For all years including those before this section, logs of record low maxima and minima have been added in separate posts later in the thread. Also, work is now underway to add logs of record high minima to augment the logs of record high maxima already present from 1901 to end of data; that change has already been made for 1869-1900. The format will be the same with record high minima inserted after the existing tables of record high maxima with extinction dates where relevant for years that have lost all shares of record high minima set during the year. 1901 _ This year is mostly remembered for its hot spell in early summer. Otherwise it was rarely very warm apart from a spell in late October. The year managed to break or tie nine starter records (one three-way tie and a four-way tie created) for a count of 7.58. With a count of 1.5 surviving record highs, the survival rate is 19.8%. The average margin by which 1901 records replaced nine starter records (tie equals zero here) is 2.6 deg. The average year replacing 1901 records was 1916 (but would increase to 1939 if the two surviving records were broken this summer). The average margin of surplus of record highs at end of data to 1901 records is 7.9 F deg, which drops to 6.1 F deg counting the unbroken records. Oct 23 (75F) was one degree below the starter record high of 1871, 1900 (76F). 1901 also set four record low maxima, two tied, for a count of 3.00. (while the expected number of records to end of the year is around 11.2, the end of period random expectation for all years is 2.4). There were two record low minima set in 1901 but neither survived very long, one (July 27th) fell in 1903 and the other in 1914 (June 17, 1914 is therefore the extinction date for 1901 low minimum records, the earliest in the data set). 1901 was the first year to fail to produce surviving record low minima after 1870 whose extinction date was later: July 3, 1929. From a count of 9.0 during the year, the count of surviving record high minima was 1.33, the unbroken one coming on July 2 (82F). The tied record was 53F on Dec 14 later tied in 2001 and 2015. Temp ___ date ___ replaces _ ties _______ broken ___ eventual end of data record max, recent max _80F ___ Apr 30 ___ 1879,99 (76F) ______ 1903 (82F) __ 1942 (91F) ________ 1985 (84F). _89F ___ June 12 _______ 1872,98 (89F) __ 1914 (91F) __ 1933, 73, 2017 (93F) _91F ___ June 26 _____ 1876,80,91 (91F) _1909 (93F) ___ 1952 (100F) ________ 2003 (93F). _95F ___ June 30 __ 1872 (93F) _________ 1945 (97F) ___ 1964 (99F) __ 1901 later tied by 1933 __ 2018 (93F). _100 F _ July 1 ___ eventual record .. (1964 2nd (99F), 1963 3rd (98F), 1968 4th (97F), 1945, 2018 t-4th (96F), 1913,41,53 t-6th (95F)). _ _ _ _ _ _ _ _ _ _ _ _ _ _ _ _ _ _ _ _ _ starter record broken was 94F (1898). _100F _ July 2 ___ eventual record later tied by 1966 .. (1941 3rd (98F), 1872 4th (96F), 1961,2002,18 t-5th (95F), 1911,13,63 t-8th (94F)). _88F ___ Sep 15 __ 1894 (86F) __________1915 (91F) __ 1927 (92F) _______ 1993 (90F). _60F ___ Dec 15 __ 1897 (57F) __________1918 (61F) __ 2015 (68F) _55F ___ Dec 29 __ 1889,91 (53F) _______1905 (57F) __ 1984 (70F) ____ (2024 (60F). Record high minima (count 9.0), end of data 1.33 survive _43F ___ Mar 9 ___ 1878 (41F) __________ 1903 (44F) __ 2018 (55F) _74F ___ June 27 ________ 1894 (74F) _____1943 (76F) __ 1943 (76F) __ 1894, 1901 later tied by 1909 (74F) _78F ___ July 1 ____1872 (75F) ___________2018 (79F) __ 2018 (79F) _82F ___ July 2 ____ eventual record high minimum __ 79F (1903, 2018), 78F (1872, 1876) _78F ___ July 16 __________ 1869 (78F) ____ 1952 (80F) __ 1952 (80F) ____ 1983, 2021 (79F) _74F ___ Aug 18 __________ 1878 (74F) ____ 1955 (75F) __ 2002 (78F) ___ 1878, 1901 later tied by 1913,39 (74F) _76F ___ Aug 23 ____ 1898 (74F) _________ 1906 (77F) __ 1906 (77F) ____ 2020 (74F) _72F ___ Sep 15 ____ 1889,96 (70F) ______ 1903 (73F) __ 1931, 2005 (75F) _70F ___ Sep 29 __________ 1884 (70F) ____ 1959 (72F) __ 1959, 2015 (72F) _64F ___ Oct 13 ____ 1883 (61F) __________1954 (66F) __ 1990 (68F) _53F ___ Dec 14 ___ eventual record high minimum later tied in 2001, 2015 __ 1983 (47F), 2006 (46F), 1897 (45F) __________________________________________________________________ 1902 _ This year had warm March and November spells. There were ten new record highs, but with four ties of starter highs, the count was 8.00. In addition to these, 66F on Mar 12 was not a record (71F 1890) and 83F on Apr 23 also not a record (84F 1886, 1925). None of these records survived past 1972. The average excess over starter era records for the ten was just 1.7 F deg. The average surplus of eventual record highs over 1902 records was 13.1 F deg. That is larger than most starter era margins. The average year breaking a 1902 record high was 1927. The extinction date for 1902 record highs was March 1st, 1972. There were three record low maxima, one on May 28 and two in mid-December. 1902 has the lowest annual maximum of any year in the data set (only 90F). After setting only 5.5 records against the previous years, 1902 now holds just a half share of one record low (43F May 29 tied 1884). (count 0.50) It also has a third share in one record high minimum on May 24 (70F), count 0.33, the lone survivor of 9.0 originally set high minimum records. Temp ___ date ___ replaces _ ties ______ broken ___ eventual end of data record max, recent max _63F ___ Mar 1 ___ 1871 (59F) _________ 1972 (72F) __ 1972 (73F) ________ 2017 (70F) __ (1902 t 2004 3rd) _67F ___ Mar 13 __ 1890 (63F) _________ 1929 (70F) __ 1990 (85F) ________ 2012 (72F) _63F ___ Mar 23 __ 1878,89,97 (60F) ___ 1907 (72F) __ 1923,2012 (76F) _62F ___ Mar 29 ___________ 1872 (62F) __1905 (73F) __ 1945 (86F) ________ 1985 (82F), 1998 (81F) _61F ___ Mar 30 ___1875, 1897 (60F) ___ 1907 (67F) __ 1998 (82F) _84F ___ Apr 22 ___ 1885, 86 (81F) _____ 1962 (86F) __ 1962,73,2001 (86F) ___ 1902 is 5th warmest. 1977 (85F). _86F ___ May 23 __________ 1886 (86F) __ 1925 (91F) __ 1964 (94F) ________ 1992 (92F). _72F ___ Oct 19 ___________ 1899 (72F) __ 1905 (75F) __ 2016 (85F) _63F ___ Nov 14 ____ 1879 (61F) ________ 1937 (64F) __ 1993 (72F) ____ 69F next day not a record (73F 1879). _54F ___ Dec 21 ___________ 1895 (54F) __ 1923 (62F) __ 2013 (65F) Record high minima (count 9.0), end of data 0.33 survive _42F ___ Feb 27 ____ 1890 (37F) __________ 1971 (44F) __ 1976 (49F) ___ 1902 later tied by 1953 (42F) _49F ___ Mar 1 _____ 1895 (42F) __________ 2017 (54F) __ 2017 (54F) _41F ___ Mar 16 __________ 1898 (41F) ____ 1921 (43F) __ 1990 (55F) __ also 52F 1948, 49F 1945 _50F ___ Mar 29 ____ 1898 (47F) __________ 1907 (58F) __ 1998 (62F) __ also 60F 1945 _48F ___ Mar 30 ____ 1871,86,97,98 (41F) ____ 1907 (50F) __ 1998 (59F) __ also 58F 1945, 51F 1910 _70F ___ May 24 ___ eventual record high minimum tied 1884, 1964 __ 1880, 1908, 1980 (68F) _64F ___ Oct 19 ____ 1873 (63F) ___________ 1905 (68F) __ 1905 (68F) ___ 2016 (65F) _52F ___ Nov 12 ____ 1879, 82 (50F) _______ 1909 (54F) __ 2022 (60F) __ also 1912,35 (56F), 1982 (55F) _51F ___ Nov 21 ____ 1900 (49F) ___________ 1931 (54F) __ 1991 (62F) __ 1902 later tied by 1913 (51F), also 1952 (55F) _47F ___ Dec 3 _____ 1879,99 (44F) ________ 1932,41 (48F) _1998 (53F) __ also 1970 (49F), 1982 (51F) _ __________________________________________________________________ 1903 _ This year had a very warm spring and broke or tied 18 starter records, with two ties among them for a count of 17.00. Nov 5 (66F) also fell one degree short of breaking the 1900 record high. None of these managed to survive the rest of the record however. The random expectation by 1903 has fallen to 10.4 so this is a surplus of almost 70%. The average 1903 record added 3.8 F deg to the records broken (it should be noted that this stat can begin to include periods beyond the starter era although 1903 did not break any 1901 or 1902 set records.) The average year breaking the 1903 records was 1926, and the average margin of the eventual record high over 1903 record highs is 12.1 F deg. The extinction date for 1903 record highs was Feb 28, 1976. The year set six low maximum records, and had a count of 5.25. These were mainly in the summer which was generally cooler than the spring and autumn (in relative terms). The counts of record low and record high minima are similar, three (count 2.50) record lows from a pool of seven records set during the year, and four (count 2.83) record highs. A record high minimum on April 30 was followed by a tied record low on May 2nd. There were 24.33 record high minima set in 1903, so the eventual count of 2.83 is less than a 12% survival rate. That 24.33 count was higher than all starter years except 1898 (32.83) and 1896 (28.5) which had fallen slightly to 32.08 and 28.0 by start of 1903. Also 1908 (28.83) and 1906 (25.0) would surpass 1903 so it went from third to fifth in that interval, and slowly dropped down the table thereafter, although later peak years registered 12.83 in 1948 and 14.92 in 2015 (13.17 in 2017). Mar 8-25 once held 10.5 record high minima, a count gradually reduced to 1.0 (March 24, 52F survives). Temp ___ date ___ replaces _ ties ______ broken ___ eventual end of data record max, recent max _62F ___ Feb 28 ___ 1878,80 (56F) _____ 1976 (67F) __ 1976 (67F) ________ 1997 (62F) __ (1903 t2) _70F ___ Mar 14 ___ 1879 (56F) ________ 1946 (75F) __ 1946 (75F) ________ 2024 (74F) __ (1903 t2) _56F ___ Mar 15 ___ 1883 (52F) ________ 1912 (60F) __ 1990 (77F) _67F ___ Mar 20 ___ 1898 (64F) ________ 1921 (78F) __ 1945 (83F) ________ 2020 (77F) _65F ___ Mar 21 ___ 1897 (60F) ________ 1913 (66F) __ 1921 (84F) ________ 2012 (67F) _66F ___ Mar 24 ___ 1889 (61F) ________ 1913 (72F) __ 1988 (76F) _58F ___ Mar 26 __________ 1874 (58F) _ 1904 (65F) _ 2021 (82F) _67F ___ Mar 27 ___ 1869 (60F) ________ 1908 (72F) _ 1998 (83F) _62F ___ Mar 28 ___ 1884 (58F) ________ 1905 (73F) _ 1945 (84F) ________ 1998 (80F) _82F ___ Apr 30 ___ 1901 (80F) ________ 1941 (86F) __ 1942 (91F) ________ 1985 (84F). _88F ___ May 19 ___ 1885 (87F) ________1962 (99F) __ 1962 (99F) ________ 2017 (91F). _89F ___ May 20 ___ 1877, 87 (87F) ____1939 (90F) __ 1996 (96F) _84F ___ May 22 _________ 1886 (84F) __ 1914 (89F) __ 1941 (96F) ________ 1992 (93F) _93F ___ July 10 ___ 1897 (92F) ________1911 (99F) __ 1936, 1993 (102F) _87F ___ Sep 13 ___ 1890 (83F) ________1931 (97F) __ 1952 (94F) ___ 1903 later tied by 1925 __ 2005 (92F). _88F ___ Sep 14 ___ 1877 (85F) ________ 1915 (90F) __ 1931 (93F) ________ 2016 (91F). _68F ___ Nov 3 ____ 1876,86,92 (67F) __ 1936 (75F) __ 2003 (79F). _70F ___ Nov 4 ____ 1887 (64F) ________ 1914 (76F) __ 1975 (78F) ________ 1987 (77F). Record high minima (count 24.33), end of data 2.83 survive _39F ___ Jan 29 ____ 1891 (37F) _________ 1950 (40F) __ 2002 (50F) ___ also 1970 (42F) _39F ___ Feb 2 _____________ 1877 (39F)__ 1922,33 (40F)_1952 (42F) ___ 1999 (40F) _38F ___ Feb 3 ___________ 1877,90 (38F)__1983 (45F) __ 1999,2006 (46F) _47F ___ Feb 28 ___ eventual record high minimum later tied in 1910, 2017 __ 1971 (46F), 1880, 1955 (44F) _47F ___ Mar 8 ____________ 1878 (47F)__ 1987 (54F) __ 1987 (54F) __ also 2012 (53F) _44F ___ Mar 9 ____ 1901 (43F) __________1921 (47F) __ 2000 (48F) _43F ___ Mar 11 ___ 1879,98 (41F) ______ 1925,55 (49F) _ 1967,77 (50F) _43F ___ Mar 15 ___ 1878 (37F) __________1908 (44F) __ 2024 (51F) __ also 1913, 2019 (49F), 2002 (48F), 1946 (47F) _46F ___ Mar 18 ___ 1874 (42F) __________ 1927,90 (48F) _ 2011 (51F) __ also 2010 (50F) _56F ___ Mar 20 ___ 1898 (46F) __________ 1948 (57F) __ 1948 (57F) __ 1903 2nd, 2012 3rd (55F), 2010 4th (54F) _55F ___ Mar 21 ___ 1890,94 (42F) _______ 2012 (57F) __ 2012 (57F) __ 1903 2nd, 1938 3rd (54F), 2010 4th (51F) _46F ___ Mar 22 ___ 1894 (45F) __________ 1929 (52F) __ 1948 (57F) __ 1903 later tied by 1918 (46F), also 2012 (56F) _47F ___ Mar 23 ___ 1880 (46F) __________ 1907 (52F) __ 2012 (58F) __ also 1938 (56F) _52F ___ Mar 24 ___ eventual record high minimum __ 1979 (51F), 1913,47,2000 (48F), starter record was 45F (1884) _41F ___ Mar 25 ___ 1884 (40F) ___________ 1905 (45F) __ 1913 (61F) __ also 1910 (52F) _48F ___ Apr 7 _____ 1878 (46F) __________ 1908,42 (49F) _ 1991 (63F) __ also 2010 (56F), 1954 (53F) _49F ___ Apr 8 _____________ 1882 (49F) __ 1908 (51F) __ 1991 (66F) __ also 1929 (65F), 2010 (64F), 1922 (55F) _63F ___ Apr 30 ___ eventual record high minimum __ 1942,74 (60F), 1998 (58F), starter records 1879,99 (55F) _67F ___ May 19 ___ 1877,89 (65F) _______ 1986 (68F) __ 1986 (68F) __ 1903 2nd, 1911, 2017 t3rd (66F) _71F ___ May 20 ___ 1898 (68F) __________ 1996 (74F) __ 1996 (74F) __ 1903 2nd, 1898 3rd, 1959,82 t4 (67F) _67F ___ May 21 ___ 1887 (65F) __________ 1959 (71F) __ 1959 (71F) __ also 1978,96 (68F), 1975, 2013 (68F) _76F ___ July 10 ____________ 1878 (76F) ___ 1905,10,37,81 (79F) _ 1993 (80F) _ also 1911 (78F) _72F ___ Sep 14 ____1889 (69F) __________ 1915 (73F) __ 1947 (74F) __ also 1961 (72F) 1994,2005 (70F) _73F ___ Sep 15 ____1901 (72F) __________ 1915 (74F) __ 1931,2005 (75F) _73F ___ Sep 16 ___ eventual record high minimum later tied by 2005 __ also 1889, 1915,30 (72F), 1894 (71F) _65F ___ Oct 6 ____________ 1900 (65F) ___ 1910 (71F) __ 1910 (71F) __ 2017 (68F) also 1937,41,2007 (66F) _64F ___ Oct 7 _____ 1900 (63F) __________ 1944 (65F) __ 2005 (70F) __ 1903 later tied by 1936 (64F), also 1955 (66F) _54F ___ Nov 4 ____________ 1896 (54F) ___ 1948 (59F) __ 1982 (62F) __ 1896, 1903 later tied by 1934 (54F), also 1961,75 (61F) __________________________________________________________________ 1904 _ This was a much colder year. Even so, it managed to break six starter records and tie four others for a count of 7.83. The average margin of increase over former records was only 1.7 F deg. None of these records lasted very long, most were gone before the end of the next decade and the average year of extinction was 1916. Eventual record highs averaged a surplus of 12.4 F deg over 1904 record values. The extinction date for 1904 record highs was Feb 7, 1938, at which time the record was tied with 1884, 1925 and 1933. This is the second earliest extinction date after 1877 was out of records by Feb 12, 1932. 1909 would later be out by Feb 19, 1930 making 1904 eventually the third year to retire. By contrast the year produced five record low maxima that survived to end of data (count 4.00), the most significant one being 37F on April 20, a benchmark value. There were also just two record low minima (count 2.00) from a count of 4.08 after six records were set (one tied once, one tied twice and one tied three times previously), and 1904 maintains one unbroken record high minimum (42F on Feb 6), rather unusual given that most of the winter was quite cold. However, the year set only three record high minima, which is tied fourth lowest so far in the series, behind 1873 and 1874 at 2.0, and 1893 at 2.83, also tied with 1887. All but 1893 had lost one of those before 1904 began. It would be 1917 (and 1920) before years fared worse than 1904 in production of record high minima. Temp ___ date ___ replaces _ ties _____ broken ___ eventual end of data record max, recent max _53F ___ Jan 21 __________ 1891 (53F) _ 1906 (60F) _ 2006 (63F) _53F ___ Feb 7 ____ 1884 (51F) _______ 1938 (54F) _ 2020 (56F) ___ later tied in 1925, 1933 _58F ___ Mar 25 __________ 1884 (58F) _ 1910 (75F) _ 1963 (79F) ________ 2016 (72F) _65F ___ Mar 26 ___ 1874.1904 (58F) __ 1913 (72F) __ 2021 (82F) _62F ___ Apr 7 _____ 1871 (61F) _______ 1908 (75F) __ 2010 (92F) ____ also 1929 (89F) _86F ___ May 24 _____ 1880,1884 (86F) _1936 (92F) __ 1975 (93F) _______ 1995 (87F). 1904 later tied by 1912. _93F ___ June 26 ___ 1876,80,91,1901 (91F) _ 1923 (94F) _ 1952 (100F) ___ tied by 1909 _94F ___ July 19 __________ 1876 (94F) __1905 (95F) __ 1977 (102F) _******______ 1999 (97F). _79F ___ Oct 11 ____ 1883 (75F) _______ 1914 (83F) __ 1949 (85F) ________ 1995, 2017,18 (77F). _51F ___ Dec 28 ___ 1874, 87 (50F) ____ 1907 (54F) __ 1982,2008 (65F) _ 1904 tied by 1905. Record high minima (count 3.0), end of data 1.0 survive _42F ___ Feb 7 ___ eventual record high minimum __ 1990 (41F), 1991 (40F), 2019 (39F), 1896 (37F) _78F ___ June 26 ___ 1880 (77F) _______ 1952 (81F) __ 1952 (81F) __ 1904 later tied by 1943 (78F), also 2003 (79F) _77F ___ Aug 1 _____ 1890 (75F) _______ 1917 (82F) __ 1917 (81F) __ 1999, 2006 (68F), 1979 (78F), 1944 (77F) __________________________________________________________________ 1905 _ This year had some warm spells in spring and autumn and a brief heat wave in July. Otherwise it was another rather cool year. It managed to break eleven established records and tied four others for a count of 12.83. (vs 9.8 random expectation). The average margin of increase for these 15 new or tied values was 3.3 F deg. The average year breaking a record from 1905 is 1930. The average surplus of eventual records is 9.6 F deg. The extinction date for 1905 record highs was Sep 30th, 1986. The year has only one tied (with 1891) record low maximum (61F, June 7) for a count of 0.5 from the original count of 1.5; Feb 14th held a record (18F) until 1916. 1905 has only one record low minimum in November (20F Nov 14th) from a very meagre annual count of 1.5 (the tied addition being 56F for June 27th, tying 1893, later tied in 1915 and broken by the eventual record of 55F in 1940. From an original count of 16.83, 2.50 record high minima survive, including July 12 (79F) and October 19 (68F). Temp ___ date ___ replaces _ ties _____ broken ___ eventual end of data record max, recent max _67F ___ Mar 18 ___ 1894 (65F) _______ 1927 (69F) __ 1989, 2011 (77F) _73F ___ Mar 28 ___ 1903 (62F) _______ 1921 (82F) __ 1945 (84F) ________ 1998 (80F) _73F ___ Mar 29 ___ 1872,1902 (62F) __ 1907 (74F) __ 1945 (86F) ________ 1985 (82F), 81 1998 (81F) _70F ___ Mar 31 ___1886 (62F) ________ 1920 (71F) __ 1998 (86F) _91F ___ June 18 ___ 1888 (90F) _______ 1929 (95F) __ 1929 (95F) ___ later tied by 1925 __ 1994 (92F). _92F ___ July 12 __________ 1876 (92F) __1908 (96F) __ 1966 (99F) ________ 1993, 2010 (94F). _96F ___ July 18 ____ 1900 (95F) _______ 1953 (101F) __ 1953 (101F) _______ 2012 (100F). _95F ___ July 19 ____ 1876,1904 (94F) __1930 (98F) __ 1977 (102F) _______ 1999 (97F). _88F ___ Sep 30 ____ 1881 (82F) _______ 1986 (89F) __ 1986 (89F) ___ 1905 second warmest. _75F ___ Oct 19 ____ 1899, 1902 (72F) __ 1928 (79F) __ 2016 (85F) ___ 1905 later tied by 1910. _71F ___ Oct 20 ___________ 1884 (71F) __1916 (77F) ___ 1947,69 (80F) ___ later tied by 1906 __ 1995 (74F). _59F ___ Nov 25 _______ 1890,95 (59F) __ 1908 (60F) ___ 1979 (73F) _________ 2014 (68F). _59F ___ Dec 3 ____ 1879,91,99 (55F) ___ 1914 (66F) __ 1998 (69F) _51F ___ Dec 28 ___________ 1904 (51F) _ 1907 (54F) __ 1982,2008 (65F) _ 1905 tied 1904. _57F ___ Dec 29 ____ 1901 (55F) ________ 1982 (65F) __ 1984 (70F) __ 2024 (60F), 1905 tied by 1954 (and non-rec 2018) (57F) Record high minima (count 16.83), end of data 2.5 survive _45F ___ Mar 25 ____ 1903 (41F) _________ 1910 (52F) __ 1913 (61F) ___ 1987, 2000 (50F) also 1928 (50F) _51F ___ Mar 27 ____ 1869 (48F) _________ 1908 (58F) __ 1949 (61F) ___ 1998 (56F) also 1945,48 (54F) _53F ___ Mar 28 ____ 1898 (47F) _________ 1945,85 (59F) _ 1998 (63F) _47F ___ Mar 31 ____________ 1886 (47F) __ 1910 (48F) __ 1998 (66F) __ also 1986 (60F), 1962,81 (57F) _73F ___ June 17 ____________ 1892 (73F) __1945 (74F) __ 1957 (77F) __ 1892, 1905 later tied by 1944 (73F) _75F ___ June 18 ___ 1894 (73F) _________ 1957 (76F) __ 1957,2014 (76F) __ also 1962 (74F) _78F ___ July 9 _____ 1876,78,85 (76F) ___ 1937 (79F) __ 1981 (80F) __ also 1993 (78F), 1912,36,39 (77F) _79F ___ July 10 ____ 1876,1903 (76F) ____1993 (80F) __ 1993 (80F) __ 1905 later tied by 1910, 1937 (79F) _77F ___ July 11 ____________ 1882 (77F) __ 1988 (79F) __ 1988 (79F) __ also 1987, 2013 (76F) _79F ___ July 12 ___ eventual record high minimum __ 1911, 1993, 2011 (78F), 1908, 1981, 2017 (77F), 1876 (76F) _76F ___ July 14 ____________ 1876 (76F) __ 1952 (78F) __ 1952 (78F) __ also 1966, 1995 (77F) _77F ___ Aug 15 ____ 1885,96 (76F) _______1908 (82F) __ 1908 (82F) __ 2016 (81F), 2002,05 (80F), 1988 (79F) _71F ___ Sep 17 _________ 1894,98 (71F) __ 1915 (72F) __ 1991 (77F) __ 1894,98,1905 later tied by 1907 (71F) _72 F ___ Sep 18 ___ eventual record high minimum later tied by 1972 __ 1898, 1991 (71F), 1894 (70F) _73 F ___ Sep 19 ___ 1894 (70F) __________ 1906 (74F) __ 1906 (74F) __ 2017 (69F), 1983 (68F) _67F ____ Oct 2 ____ 1879 (66F) __________ 1927 (69F) __ 1954 (72F) __ 1971 (67F), 2002 (66F), 2018 (65F) _68F ____ Oct 19 ___ eventual record high minimum __ 2016 (65F), 1902 (64F), 1873 (63F) _49F ____ Nov 29 ___ 1870 (43F) __________1934 (54F) __ 2005 (58F) __ also 1963 (47F) _46F ____ Dec 22 ____1875 (45F) __________1949 (48F) __ 2013 (61F) __ also 1990 (58F), 2015 (53F) _45F ____ Dec 29 ____________ 1881 (45F) __1984 (55F) __ 1984 (55F) __ also 1996 (48F), 2005 (47F) _________________________________________________________________ 1906 _ This year began with a very mild January, and had a few other spells of notable warmth. The January records may have been more impressive in other parts of the northeast U.S., as some readings near 70F were noted in other locations around 21st-22nd. These NYC records were not able to survive later mild spells. There were 12 new record highs, including four ties for a count of 9.83. These increased previous marks by an average of just 2.5 F deg. The average year breaking 1906 records has been 1937. The average margin of eventual records to 1906 records was 6.5 F deg. The extinction date for 1906 records was May 18, 2017 (it was tied by 1936). The year set no surviving record low maxima. After a very weak output of 1.0 record low minima (two ties of starter year records), there were likewise no record low minima that survived, and this is the first year encountered with this complete absence of surviving low records. The extinction date for the two record low minima were Sept 5, 1924 and Dec 7, 1926. Some spells of very warm nights were found, a total of 13 record high minima with a count of 10.67 (two have become three-way ties, another two are ordinary ties, nine are unbroken). The period Jan 21-23 had record high minima, all near 50F, and five days in August (19th-23rd) produced readings in the high 70s for their record values. This was the highest count of surviving records until 2015 and third highest of all years behind 2015 and 2017. It is the residue of 25.0 records set originally, which at that time ranked third although 1896 and 1898 which had exceeded 1906 had lost enough records before 1906 began (2.5 to 26.0, 6.42 to 26.42) so that at the end of the year, by breaking 1.75 and 0.75 of their surviving records, 1906 held more than 1896 and slightly fewer than 1898. Temp ___ date ___ replaces _ ties _____ broken _____ eventual end of data record max, recent max _60F ___ Jan 4 ___ 1874 (58F) _________ 1950 (66F) __ 1950, 2023 (66F) __also 1993 (64F) __ 1906 tied by 1907 _59F ___ Jan 20 __ 1900 (50F) _________ 1913 (60F) ___ 2006 (63F) _60F ___ Jan 21 __ 1891,1904 (53F) ___ 1916 (61F) ___ 1916,59 (61F) ______ 1986 (59F) _58F ___ Feb 21 __1899 (53F) _________ 1913 (62F) ___ 2018 (78F) _84F ___ May 13 _________ 1900 (84F) __ 1930 (87F) ___ 1956 (89F) ________ 2004 (86F). _90F ___ May 18 __ 1877 (88F) ________ 2017 (92F) ___ 2017 (92F) ___ later tied by 1936 (t2 warmest) _91F ___ June 10 __ 1883 (90F) ________ 1959 (92F) ___ 2008 (96F) _92F ___ July 22 _________ 1885 (92F) ___ 1918 (98F) ___ 2011 (104F) _89F ___ Aug 23 ________ 1898 (89F) ___ 1911 (91F) ___ 1916 (92F) ________ 1976,89,96 (90F). _90F ___ Sep 19 ___ 1882 (87F) ________ 1983 (93F) ___ 1983 (93F) ___ 1906 later tied by 1946, t2nd warmest. _71F ___ Oct 20 _____ 1884, 1905 (71F) __1916 (77F) ___ 1947,69 (80F) _________1995 (74F). _65F ___ Nov 18 ___ 1886,90 (64F) ______1918 (66F) ___ 1921,28 (73F) _________1987 (70F). Record high minima (count 25.0), end of data 10.67 survive _42F ____ Jan 4 ____1897 (41F) _________ 1933 (44F) ___ 1950 (59F) ___ 2000 (46F) _36F ____ Jan 18 __________ 1870 (36F) __1913 (45F) ___ 1915 (47F) ___ 1995,99,2017 (38F) also 1973 (45F) _ _ _ _ _ _ _ _ _ _ _ _ _ _ _ _ _ 1870, 1906 also later tied by 1910 (36F) _49F ____ Jan 21 ___ eventual record high minimum __ 1923 (44F), 2018 (42F), 1878, 1964 (41F) _47F ____ Jan 22 ___ eventual record high minimum __ 1957, 2017 (43F), 1921,37 (42F), 1878, 1916,33,74 (41F) _50F ____ Jan 23 ___ eventual record high minimum __ 1933 (46F), 1967 (45F), 1870,1950 (44F), 1919 (43F), 1909, 2002 (42F) _39F ____ Jan 31 ___ 1884 (36F) ________ 1913 (43F) ___ 1913 (43F) ___ 1988 (41F), also 2002 (40F) _39F ____ Feb 20 _________ 1874 (39F) __1909 (41F) ___ 1939 (48F) ___ 1930, 1981, 2018 (47F), 2002 (45F), 1994 (44F) _44F ____ Feb 21 ___ 1899 (40F) ________1913 (44F) ___ 2018 (55F) ___ also 1930, 2002 (50F), 1981 (47F), 1996 (46F) _64F ____ May 13 _________ 1879 (64F) __1956 (69F) ___ 1956 (69F) ___ 1879, 1906 later tied by 1942 (64F). 1985,91 (66F) _70F ____ May 17 ___ eventual record high minimum __ 1877 (69F), 1974 (66F), 2017 (65F) _69F ____ May 18 _________ 1896 (69F) __ 2017 (75F) ___ 2017 (75F) ___ also 1877 (68F), 1943,77 (67F) _71F ____ June 10 ___ 1889 (70F) _______ 1959 (75F) ___ 1984 (79F) ___ also 1974 (74F), 2000 (73F) _75F ____ June 30 _________ 1872 (75F) __ 1908 (76F) ___ 1945,59 (79F) __ 2012 (77F), 1966 (73F) _76F ____ July 21 ___ 1885,95,96,98 (75F) __1930 (77F) ___1980 (82F) ___ also 2019 (80F), 1940,49,77 (78F) _ _ _ _77F ____ July 22 ___ not a record, 1885,1926 (78F), 1957 then 80F and 2011 84F _80F ____ July 23 ___ 1887 (76F) ________ 1978 (81F) ___ 2011 (83F) __ also 2016 (80F), 1908 (79F) _77F ____ Aug 4 ____ 1890 (75F) ________ 1908,2005 (78F) _ 1908,2005 (78F) _ also 1979,83,95,2002 (77F) _80F ____ Aug 6 ___ eventual record high minimum later tied 1908, 1918 __ 1881 (78F), 1896, 2018 (77F) _78F ____ Aug 7 ____ 1876 (77F) ________ 1918 (82F) ___ 1982 (82F) __ also 2001 (78F), 1988 (77F) _77F ____ Aug 19 ___ eventual record high minimum later tied 2015 __ 1872 (75F) _77F ____ Aug 20 ___ eventual record high minimum later tied 1983, 2015 __ 1899, 1937, 2004 (76F) _78F ____ Aug 21 ___ eventual record high minimum __ 1937 (77F), 1884, 2005 (76F) _78F ____ Aug 22 ___ eventual record high minimum __ 1916,42 (77F), 2003 (76F), 1885,91,99 (75F) _77F ____ Aug 23 ___ eventual record high minimum __ 1901 (76F), 1898, 1905, 2020 (74F) _74F ____ Sep 19 ___ eventual record high minimum __ 1905 (73F), 1894 (70F), 2017 (69F) _77F ____ Sep 20 ___ eventual record high minimum __ 1983 (73F), 1882, 2005 (71F) _61F ____ Oct 20 ___ 1910 (64F) ________ 1916,84 (65F) _ 1916,84 (65F) __ also 2016 (62F), 1953,79 (61F) _59F ____ Oct 21 __________ 1884 (59F)__ 1947,79 (64F) _ 1947,79 (64F) __ 1884, 1906 later tied by 1915, also 1984 (62F) _57F ____ Nov 19 ___ eventual record high minimum later tied by 2015 __ 1900, 2003 (55F), 1985 (54F) __________________________________________________________________ 1907 _ This year had a mild January also, but became rather cold after March. A total of nine records were set (two ties, count 8.00) and one has survived (Jan. 7 64F), for a survival rate of 12.5%. The average margin of increase over previous records was 4.1 F deg. The average year breaking 1907 set or tied records was 1927, which increases to 1936 if the Jan 7 record falls next winter. These records fall an average of 8.5 F short of eventual records, which reduces to 7.6 F deg counting the existing record. The year has three surviving low maximum records, two tied, for a count of 2.00 The annual count of record low minima was 6.5, from seven occasions, and there were six surviving record low minima, for a count of 3.70 (all in May 1907) and also a one-quarter share in a tied record high minimum (0.25) on September 5th. That is all that remains of a count of 8.95 record high minima set during the year. Temp ___ date ___ replaces _ ties ______ broken ___ eventual end of data record max, recent max _60F ___ Jan 4 ____________ 1906 (60F) __ 1950 (66F) _ 1950,2023 (66F) __ also 1993 (64F) _64F ___ Jan 7 _____ eventual record ____ (second 62F 1946, 2008, fourth 60F 1930,32) _60F ___ Jan 8 ___ 1869 (54F) ___________ 1930 (69F) __ 1998 (65F) ___ also 64F 2008. _58F __ Jan 20 ___ 1900 (57F) ___________ 1947 (60F) __ 1951, 2006 (61F). _63F ___ Mar 22 __________ 1894 (63F) __ 1911 (64F) __ 2012 (78F) _72F ___ Mar 23 ___ 1902 (63F) _________ 1923 (76F) __ 1923,2012 (76F) ___ (75F 1938 3rd, 1907 4th) _74F ___ Mar 29 ___1905 (73F) _________ 1910 (76F) __ 1945 (86F) ________ 1985 (82F), 81 1998 (81F) _67F ___ Mar 30 ___1902 (61F) _________ 1910 (78F) __ 1998 (82F) ________ also 79F 1977, 1910 t 1986 4th _57F ___ Dec 28 ___ 1904,05 (51F) ______ 1936 (59F) __ 1982, 2008 (65F) Record high minima (count 8.95), end of data 0.25 survive _49F ____ Jan 7 ____1895 (44F) _________ 1946 (54F) ___ 1946 (54F) ___ 2012 (46F), 2008 (45F), 1930 (44F) _43F ____ Jan 8 ____ 1869 (40F) _________ 1928 (44F) ___ 2008 (53F) ___ also 1930 (52F) _52F ____ Mar 23 __ 1903 (47F) _________ 1938 (56F) ___ 2012 (58F) ___ st rec 1880 (46F) _58F ____ Mar 29 __ 1902 (50F) _________ 1945 (60F) ___ 1998 (62F) ___ st rec 1898 (47F) also 1946 (57F) _50F ____ Mar 30 __ 1902 (48F) _________ 1910 (51F) ___ 1998 (59F) ___ also 1945 (58F), 1936 (53F) _61F ____ Apr 26 __ 1899 (60F) __________1908 (63F) ___ 2009 (67F) ___ also 1953,79 (59F) _73F ____ June 22 ___________1896 (73F)__ 1908 (74F) ___ 1941 (76F) ___ also 1909, 1988 (75F) _75F ____ Sep 5 ___ eventual record high minimum tied with 1898, 1985 and 2018 _ 1880 (76F), 1979 (75F) _71F ____ Sep 17 ____ 1894,98,1905 (71F) __1915 (72F) __ 1991 (77F) _44F ___ Nov 28 _____ 1870,77,79,96 (44F)__1911,35,37 (50F)_ 2011 (56F) __also 1990 (55F), 2001 (53F), 1973 (51F) _50F ___ Dec 10 ____ 1878 (46F) __________ 1946,66 (54F) _ 1946,66 (54F) __ 2015 (51F) _43F ___ Dec 30 _____________ 1898 (43F) __1948 (52F) __ 1948 (52F) ___ also 1992 (46F) __________________________________________________________________ 1908 _ This year had somewhat warmer than average weather much of the time. Eleven record highs were set or tied and the count was 10.00. The average increase over previous records from these was 3.6 F deg. The average year breaking 1908 records was 1927. The average surplus of eventual record highs over 1908 records is 8.4 F deg. The extinction date for 1908 record highs was July 12, 1966. There were no record low maximum readings in 1908. There were also no record low minimum values set, with two readings one degree above a previous record. This made 1908 the first such year with 1948 the next one. They became more frequent later in the record. After the entire period of record the closest 1908 comes to any record low is five degrees (55F on Aug 29, compared to later records of 50; this was one of the two occasions that 1908 was within one of the then existing 1888 record, 54F). Some very warm summer nights were recorded. Records were set on May 27 (74F), July 7 (84F), Aug 4-6 (78F, 81F, 80F and count 1.83 from ties), Aug 13-14 (82F, 84F) and Oct 25-27 (69F, 66F, 66F) for a total of ten records, count 8.83. The 84F values tie some later readings for highest on record overall. This was the second highest count of surviving high minima (after 1906) until 2002. The year set 28.83, second highest after 1898, and at the time the highest value as 1898 had fallen to 25.83 records between end of that year and end of 1907. It lost a further 0.5 to 1908 (count fell to 25.33). Temp ___ date ___ replaces _ ties _______ broken ___ eventual end of data record max, recent max _72F ___ Mar 27 ___ 1903 (66F) _________ 1914 (73F) __ 1998 (83F) _75F ___ Apr 7 _____ 1904 (62F) _________ 1929 (89F) __ 2010 (92F) _95F ___ July 6 _____ 1900 (94F) _________ 1911 (98F) __ 2010 (103F) _96F ___ July 12 ____ 1876, 1905 (92F) __ 1966 (99F) __ 1966 (99F) __ 1908 2nd warmest _ 1935 (95F), 1981,86, 1993, 2010 (94F). _93F ___ Aug 14 ___________ 1872 (93F) __ 1918 (96F) __ 1998 (99F). _78F ___ Oct 17 ____ 1878 (77F) _________1928 (83F) __ 1938 (90F) ________ 2016 (81F). _79F ___ Oct 18 ____________1899 (79F) __1928 (82F) __ 1928 (82F) ________ 2016 (81F). _72F ___ Oct 26 ___ 1874, 99 (71F) ______ 1924 (73F) __ 1963,64 (78F) _____ 1989 (76F). _60F ___ Nov 25 ___ 1890,95,1905 (59F)__1931 (62F) __ 1979 (73F) _______ 2014 (68F). _62F ___ Nov 30 ___ 1869 (57F) _________ 1919 (64F) __ 1991 (70F). _64F ___ Dec 1 _____1869 (62F) _________ 1927 (67F) __ 2006 (70F). Record high minima (count 28.83), end of data 8.83 survive _40F ___ Feb 15 ___ 1882,98 (38F) ______ 1949 (45F) __ 1984 (49F) ___ also 2005,18 (46F), 1954 (44F) _44F ___ Mar 15 ___ 1903 (43F) _________ 1913,2019 (49F) _ 2024 (51F)__ also 2002 (48F), 1946 (47F), 1945 (46F) _58F ___ Mar 27 ___ 1905 (51F) _________ 1949 (61F) __ 1949 (61F) ___ also 1998 (56F), 1945,48 (54F) _49F ___ Apr 7 _____ 1903 (48F) _________ 1954 (53F) __ 1991 (63F) ___ 1908 later tied by 1942 (48F), also 2010 (56F) _51F ___ Apr 8 _____ 1882,1903 (49F) ___ 1922 (55F) __ 1991 (66F) ___ also 1929 (65F), 2010 (64F) _63F ___ Apr 26 ____ 1907 (61F) _________ 2009 (67F) __ 2009 (67F) ___ also 1899 (60F), 1953,79 (59F) _59F ___ Apr 28 ____ 1869,94 (58F) ______ 1935,62,83 (62F) _1990,2009 (69F) _ also 1938 (59F) _65F ___ May 12 ____1869,81,97 (63F) ___1959 (67F) __ 1959 (67F) ___ also 1970,1985,93 (66F) _74F ___ May 27 ___ eventual record high minimum __ 2016 (73F), 1880,1933 (72F), 2015 (70F) _69F ___ May 30 _________1871,95 (69F)__1919,31 (70F) _1987 (74F) __ also 1986 (73F), 1871,95,1908 t1911 (69F) _74F ___ June 22 ____1896,1907 (73F) ___ 1909 (75F) __ 1941 (76F) __ also 1988 (75F), 1997 (74F) _76F ___ June 30 ____1872,1906 (75F) ___ 1945,59 (79F) _1945,59 (79F) _ also 2012 (77F), 2001 (75F) _78F ___ July 4 ____________ 1876 (78F) ___ 1999 (79F) __ 2002 (81F) __ 1876,1908 tied by 1974,83 (78F) _80F ___ July 5 _____ 1883,96 (78F) _______1999 (82F) __ 1999 (82F) __ also 1919 (78F), 1911,55,2012 (77F) _81F ___ July 6 _____ 1883 (78F) __________ 1999 (83F) __ 1999 (83F) __ also 2010 (81F), 2013 (78F) _84F ___ July 7 ___ eventual record high minimum __ 1883, 2010 (80F), 2013 (78F), 1999,2016 (77F) _78F ___ Aug 4 ___ eventual record high minimum later tied by 2005 _ 1906,79,83,95,2002 (77F) _81F ___ Aug 5 ___ eventual record high minimum __ 1930, 2005 (79F), 1899, 1980, 2002 (78F) _80F ___ Aug 6 ___ eventual record high minimum tied by 1906 and 1918 __ 1881 (78F), 1896, 2018 (77F) _82F ___ Aug 13 __ eventual record high minimum __ 2016 (81F), 2002,05 (80F), 1988 (79F), broke 1905 (77F) _84F ___ Aug 14 __ eventual record high minimum __ 1988 (80F), 2002,16 (78F), broke 1872 (75F) _78F ___ Aug 15 ___ 1897 (76F) _________ 1985 (80F) __ 1988 (81F) __ also 2016 (77F), 1947 (76F) _64F ___ Oct 8 _____1900 (62F) __________1922,49,82,90,2007 (67F) _2017 (72F) _ also 1959 (66F) _66F ___ Oct 25 ___ 1900 (62F) __________ 2017 (67F) __ 2017 (67F) __ also 2001 (64F) _69F ___ Oct 26 ___ eventual record high minimum __ 1913 (62F), 1975 (61F), 1991 (58F). broke 1899,1900 (58F) _66F ___ Oct 27 ___ eventual record high minimum __ 2010 (63F), 1946,71 (61F), 1918,20,63 (60F), 1899 (59F) _66F ___ Oct 28 ___ eventual record high minimum __ 2010 (65F), 1900, 1920 (62F), 1899,1946,63 (61F) _49F ___ Nov 24 ___________ 1896 (49F) __ 1931 (54F) __ 1979 (61F) ___ also 1999 (56F), 2014 (53F) _54F ___ Nov 25 ___ 1877 (46F) __________1979 (62F) __ 1979 (62F) ___ also 2001 (56F) _53F ___ Nov 26 ___ 1897 (50F) __________1946,2020 (55F) _1946,2020 (55F) _ also 1979 (53F) _49F ___ Nov 30 ___ 1869 (45F) __________ 1927,33 (50F) _2006 (58F) __ also 1934,2001 (56F) __________________________________________________________________ 1909 _ After a rather mild January, the rest of the year alternated between near average and cool weather much of the time and only managed five records, four of which were only ties, for a count of 3.00. The average increase produced was a mere 0.6 F deg, and the average replacement year for these records was only ten years away in 1919. The extinction date for 1909 records was Feb 19, 1930 which replaced 1877 (Feb 12, 1932) for earliest extinction of records. The average surplus of the new record values was 10.4 F deg. 56F on Feb 10 was not a new record (58F 1898). Nov 12 73F not a record (76F 1879). There were four surviving record low maxima, three in the summer and one in late October, and a count of 2.45 as there were four- and five-way ties for two of them. The year also had one record low minimum, 24F on Apr 11th, surviving from an original group of four with a count of 2.83, and four record high minima, 65F on May 14th, 79F on June 24th, 78F on June 25th, and 59F on Nov 13th. The year had set 15.33 record high minima, a fairly substantial count although lower than four of the previous six years, and higher than any future year would produce (2015 ended up with 14.92). Almost one-third of the existing records at the end of 1909 had been set since 1903; only 2.0 of them have survived. Temp ___ date ___ replaces _ ties _____ broken ___ eventual end of data record max, recent max _52F ___ Jan 25 ___ 1879 (49F) ________ 1916 (55F) __ 1967 (60F) ________ 2010 (57F) _52F ___ Feb 19 __________ 1887 (52F) _ 1930 (57F) __ 1997 (66F) _93F ___ June 26 _________ 1904 (93F) __ 1923 (94F) _ 1952 (100F) _______ 2003 (93F). _76F ___ Oct 10 __________ 1887 (76F) __1912 (78F) __ 1939 (91F) ________ 1997 (82F). _64F ___ Nov 23 _________ 1883 (64F) __ 1913 (70F) __ 1931 (72F) ________ 1992 (71F). Record high minima (count 15.33), end of data 2.0 survive _49F ___ Jan 5 _____ 1894 (41F) _________ 2007 (53F) __ 2007 (53F) __ also 1950 (48F) _39F ___ Jan 11 ____ 1895,98 (38F) _____ 1933,56 (41F) _ 2020 (51F) _ also 1975 (48F), 1972 (44F), 1909 later tied by 1913 (41F) _40F ___ Jan 24 ____ 1894 (38F) _________ 1953 (49F) __ 1967 (54F) __ 2002 (45F), 1950 (41F) _ _ _ _ _ _ _ _ _ _ _ _ _ _ _ _ _ _ _ _ _ _ _ _ _ _ _ _ _ _ _ _ _ _ _1909 later tied by 1913,14,42 (40F) _37F ___ Feb 5 _____ 1888,96 (38F) ______ 1943 (41F) __ 1991 (51F) __ also 2019 (44F) _42F ___ Feb 19 ____ 1884 (38F) _________ 1981,97 (49F) _2017 (53F) __ 1909 later tied by 1939 (42F) _41F ___ Feb 20 ____ 1874,1906 (39F) ___ 1922 (42F) __ 1939 (48F) __ 1930, 1981, 2018 (47F), 2002 (45F) _43F ___ Feb 24 ____________ 1875 (43F) __ 1915 (46F) __ 2017 (58F) __ also 1985 (54F), 1930 (50F) _61F ___ May 6 _____ 1889 (59F) __________1930 (71F) __ 1930 (71F) __ also 1934, 2000 (68F), 1949 (63F) _65F ___ May 14 ___ eventual record high minimum __ 1942,44 (64F), 1879,1900,1991,2012 (63F) _67F ___ May 15 ___ not a record (1900 _ 68F) but second warmest (1976 65F third) _75F ___ June 22 ____1908 (74F) _________ 1941 (76F) __ 1941 (76F) __ also 1988 (75F), 1997 (74F) _76F ___ June 23 ___ not a record (1888 _77F) but tied with 1910, 2017 (76F) for second warmest _79F ___ June 24 ___ 1870,1888 (74F) ____ 2025 (81F) __ 2025 (81F) __ 2010 (76F), 1966,2002 (75F), 1870,88 (74F) _78F ___ June 25 ___ 1880,1882 (77F) ____ 2025 (81F) __ 2025 (81F) __ 1880,82 (77F), 1952 (75F), 1923,1976,1980, 2002 (74F) _77F ___ June 26 ___ not a record (1904_78F, eventual 1952_81F) listed for continuity of hot spell _74F ___ June 27 _____ 1894, 1901 (74F) __1943 (76F) __ 1999 (75F), 1953 (74F) _53F ___ Nov 3 ____________ 1886 (53F) __ 1936 (64F) __ 1936 (64F) __ also 1982 (62F), 2003 (60F), 1886,1909 tied by 1935 (53F) _54F ___ Nov 12 ___ 1902 (52F) _________ 1912,35 (56F) _ 2022 (60F) __ also 1982 (55F), 1931 (53F) _59F ___ Nov 13 ___ eventual record high minimum __ also 1945 (57F), 1961 (55F), 2006 (52F), broke 1879 (51F) _53F ___ Nov 14 ___ 1879 (50F) _________ 1929 (55F) __ 1951 (58F) __ also 1961, 2008 (57F), 1993,2006,2011 (54F) __________________________________________________________________ 1910 _ This year had a very warm March into early April, and some other brief warm spells, notably mid-October. The summer was fairly average. The count for the year was 7.50 with eight records, one tied. This is close to random expectation now that 42 years have elapsed by end of 1910 (exp = 8.7). None of these survived past 1999. The average increase registered by 1910 records was 6.4 F deg and two of the records broken were as recently set as 1907. The average year breaking 1910 records was 1940, and the average of the eventual margin of record highs was 5.8 F deg. The extinction date for 1910 record highs was July 24th, 1999. The year set no surviving record low maxima, 21F on Dec 16 missed by two degrees (1886, 19F). There was one record low minimum (1F on Feb 7th) and as no other records were set and later broken, 1910 became the second year after 1891 to maintain all of its record low minima to the end of the data in 2021. From an original count of 8.67, there was a surviving count of 1.33 record high minima, another share of Feb 28 and 71F on Oct 6 (the next four days have records set in 2017 and 2018 that are similar). Temp ___ date ___ replaces _ ties _______ broken ___ eventual end of data record max, recent max _75F ____ Mar 25 ___1884,1904 (58F) ___ 1913 (77F) ___ 1963 (79F) __ 1910 third warmest ____ 2016 (72F) _75F ____ Mar 29 ___1907 (74F) _________ 1945 (86F) __ 1945 (86F) ________ 1985 (82F), 81 1998 (81F) _78F ____ Mar 30 ___1907 (67F) _________ 1962 (79F) __ 1998 (82F) ________ also 79F 1977, 1910 t 1986 4th _75F ____ Apr 5 ____ 1892 (70F) _________ 1928 (80F) __ 1928 (80F) ________ 1989 (77F), 2010 (75F) _76F ____ Apr 6 ____ 1892 (70F) _________ 1912 (79F) __ 1912,21,47 (79F) __ 2010 (78F). _94F ____ July 24 ____1870 (91F) ________ 1999 (97F) __ 1999, 2010 (97F) ___ 1910 later tied by 1933, 1987. _84F ____ Oct 6 ____ 1884 (80F) _________ 1931 (86F) __ 1941 (90F) ________ 1995 (86F). _75F ____ Oct 19 __________ 1905 (75F) ___ 1928 (79F) __ 2016 (85F). Record high minima (count 8.67), end of data 1.33 survive _36F ___ Jan 18 _______ 1870,1906 (36F) __ 1913 (45F) __ 1915 (47F) __ also 1973 (45F), 1995,99,2017 (38F) _47F ___ Feb 28 ___ eventual record high minimum tied 1903, 2017 __ also 1971 (46F), 1880 (44F) _52F ___ Mar 25 ___ 1905 (45F) _________ 1913 (61F) __ 1913 (61F) __ 1928,1987,2000 (50F) _51F ___ Mar 30 ___ 1907 (50F) _________ 1936 (53F) __ 1998 (59F) __ also 1945 (58F), 1977,81 (56F) _48F ___ Mar 31 ___ 1886,1905 (47F) ___ 1945,60 (51F) _ 1998 (66F) __ also 1986 (60F), 1962,81 (57F) _48F ___ Apr 2 _____________ 1875 (48F) __ 1918 (48F) __ 1967 (61F) __ also 1945 (54F), 1981,86 (52F) _51F ___ Apr 6 _____________ 1883 (51F) __ 1911 (52F) __ 2010 (58F) __ also 1912,21,48 (55F) _56F ___ May 3 _________ 1880,94 (56F) __ 1913 (67F) __ 2018 (70F) __ also 2001 (68F), 2010 (67F) _79F ___ July 10 ___________ 1905 (79F) __ 1993 (80F) __ 1993 (80F) __ 1905,10 later tied by 1937,81 (79F) _77F ___ Sep 6 ____1880,90 (75F) _______ 1985 (78F) __ 1985 (78F) __ 1910 later tied by 1983 (77F) _71F ___ Oct 6 ___ eventual record high minimum __ 2017 (68F), 1937,41,2007 (66F), broke 1900,03 (65F) _64F ___ Oct 20 ___ 1906 (61F) __________ 1916,84 (65F) _ 1916,84 (65F) __ also 2016 (62F) __________________________________________________________________ ====================================================================== The decade of 1911-20 broke 109 existing records and tied two others. That was more than would be expected (10 of 52 years should produce about 70 records) and shows the warming nature of the climate in that decade. 1913, 1916, 1918 and 1919 were particularly prolific record setters. Because some dates had two or three record breaking cases, the total count of the period was 127.75, so about twenty of these new records did not survive the decade. There are 18.74 surviving records from this decade, compared to 38.91 which were set in the first 42 years. While not quite at the expected rate yet, the decade 1911-20 did manage to come within six records of the expected tally of surviving records. Also the decade set about 60 low minimum records, of which only 12 have survived. It was somewhat opposite the situation of the previous decade which did relatively better at setting and retaining high minima than high maxima. 1911 _ The year 1911 is recalled for a lengthy heat wave in July and a number of dramatic temperature changes in the autumn months from strong cold frontal passages. The 1911 heat wave seems to have been slightly modified by sea breezes at NYC since it produced hotter readings inland as far as southern Ontario (Toronto had 103F from this heat wave, NYC maxed out at 100F). Also the 1911 heat wave went up against 1901 and 1966 heat waves that may have reduced its presence in the record column (at least eventually). The year produced 14 record highs, two were ordinary ties and one a three-way tie, for a count of 12.33. None of these have survived, the last to fall was July 6, 1999. The average increase over earlier records was 2.1 F deg, and the average year breaking the 1911 records was 1939. The average surplus of the eventual records was 7.6 F deg. The extinction date for 1911 records was July 6th, 1999. The year produced five low maxima, including 33F on Nov 13, which was 36 degrees below the reading on the 11th. Another record in September was broken later in 1965. The year also set seven record minima with a count of 6.0, but eventually by end of the data this was reduced to shares of three records and with ties the count was 1.83. There was a half share of a high minimum on Jan 2 (0.50) later reduced to a count of 0.33 when 2023 also tied. During the July heat wave, the highest minima were in the high 70s and often close to eventual records, but within one (78F) on the 10th to a record already set in 1905. A minimum on Dec 12 of 54 fell to 55F in 2015. The 0.33 surviving high minima are all that remains of the year's original count of 5.25 records. Temp ___ date ___ replaces _ ties _______ broken ___ eventual end of data record max, recent max _64F ____ Mar 22 ___ 1894, 1907 (63F) __ 1918 (69F) __ 1921 (84F) ________ 2012 (67F). _86F ____ May 22 ___ 1886, 1903 (84F) __ 1914 (89F) __ 1941 (96F) ________ 1992 (93F). _100F __ July 3 ____________ 1898 (100F) __1966 (103F) _ 1966 (103F) ___ 1898, 1911 t2nd, 1949 (99F) 4th. _97F ____ July 4 ____ 1898 (96F) ________ 1919 (99F) ____ 1949 (102F) ________ 1999,2002,2010 (96F). _97F ____ July 5 ____ 1872 (93F) ________ 1919 (98F) ____ 1999 (101F) ___ 1911 fifth warmest (2010 99F). _98F ____ July 6 ____ 1900 (94F) ________1999 (101F) __ 2010 (103F) ___ 1911 later tied by 1986 (98F). _99F ____ July 10 ___ 1903 (93F) _______ 1936 (102F) __ 1936,93 (102F) __ 1911 4th t1988, 1937 (100F) 3rd. _97F ____ July 11 ___ 1876 (93F) _______ 1988 (98F) ___ 1988 (98F) ___ 1911 third warmest, tied 1993 (97F). _92F ____ Aug 1 ___ 1873,79,85,87 (89F) _ 1917 (98F) ___ 1933 (100F) _________ 1999 (98F). _90F ____ Aug 23 ___ 1898, 1906 (89F) _ 1916 (92F) ___ 1916 (92F) _58F ____ Dec 7 ________ 1879,84 (58F) _ 1932 (63F) ___ 1998 (75F) _58F ____ Dec 8 _________ 1892 (58F) ___ 1924 (61F) ___ 1927 (65F) _________ 1951,80 (64F) _61F ____ Dec 10 ___ 1878,85 (60F) ____ 1946 (70F) ___ 1946 (70F) ___ later tied by 1939 ___ 2008 (65F). _63F ____ Dec 12 ___ 1873 (61F) _______ 1931 (68F) ___ 1931 (68F) _________ 2015 (66F). Record high minima (count 5.25), end of data 0.33 survive _49F ____ Jan 2 ___ eventual record high minimum tied by 1890,2023 __ also 1876 (46F), 2000 (43F) _37F ____ Jan 26 __________ 1878 (37F) __ 1913 (40F) __ 1916 (49F) __ also 1967 (44F), 2017 (43F) _42F ____ Jan 27 ___ 1880 (38F) _________ 1916 (53F) __ 1916 (53F) __ also 1952,74 (45F), 2002 (41F) _52F ____ Apr 6 ____ 1883,1910 (51F) ___ 1912,21,48 (55F) _ 2010 (58F) _ also 1928 (54F), 1985,91 (53F) _69F ___ May 30 _______ 1871,95,1908 (69F)__1919,31 (70F) _ 1987 (74F) _ also 1986 (73F) 2013 (72F) _50F ___ Nov 28 ___ 1870,77,79,96,1907 (44F) _ 1973 (51F)__2011 (56F)__1911 later tied by 1935,37 (50F) also 1990 (55F) _54F ___ Dec 12 ___ 1899 (53F) _________ 2015 (55F) __ 2015 (55F) __ also 1979 (50F) ____________________________________________________ 1912 _ Although generally a rather cold year except for a mild December, 1912 managed to make up its quota with 10 record highs, one a four-way tie for a count of 9.25 (exp 8.3). Also, 97F on July 9 was within one degree of the existing record. One record survived to 2023, Apr 6 (79F) after being tied in 1921 and 1947, for a count of 0.33 and a survival rate of just 3.5%, but this is now 0% and an extinction date of Apr 6, 2023. The average increase of 1912 records over previous ones was 2.6 F deg, and the average year breaking 1912 records was 1943. The average deficit of 1912 records relative to eventual records is 9.6 F deg. There was only one surviving low maximum (8F Jan 13th). Despite a lot of near-record cold nights during the year, the count even at the time only reached 5.75 and there were eventually (like the previous year) three record low minima, and with ties, the count was 1.83. Numerous minima were within 2-3 of a record, and the low of -1 on Feb 11th was the coldest after the record of -2 (set 1885 and tied 1899). Until 2022, there was a half share of the high minimum on Nov 12th, all that remained of the original count of 5.0, three of which (since broken) were in a mild December. That record fell and the extinction date became Nov 12, 2022 for high minima. Temp ___ date ___ replaces _ ties _______ broken ___ eventual end of data record max, recent max _59F ____ Feb 25 ___ 1891 (56F) _________ 1930 (75F) __ 1930 (75F) ___ 1976 (70F), 1985 (67F), 2017 (63F). _60F ____ Mar 15 ___ 1903 (56F) _________1913 (63F) __ 1990 (77F). _79F ____ Apr 6 ____ 1910 (76F) __________ 2023 (80F) __ 2023 (80F) __ (also 79F 1921, 1947), (fifth warmest 2010 (78F), fifth 1928, 1991 (77F). _89F ____ May 21 ___ 1887 (87F) _________1934 (90F) __ 1996 (93F) ___ 1912 t3 warmest (1959, 1992). _86F ____ May 24 ___ 1880,84,1904 (86F) _1936 (92F) __ 1975 (93F) ________ 1995 (87F). _81F ____ Oct 7 ____ 1887 (77F) __________ 1943 (83F) __ 1944 (88F) __ later tied by 1927, 39 (84F 1946,61, recent 1990, 2007 (82F).) _78F ____ Oct 10 ___ 1887, 1909 (76F) ___ 1919 (80F) __ 1939 (91F) _________ 1997 (82F). _72F ____ Oct 29 ___ 1881 ((70F) _________ 1918 (75F) __ 1946, 61 (81F) _________ 2016 (76F). _61F ____ Dec 2 ____ 1878 (60F) _________ 1970 (66F) __ 1970 (66F) ___ 1912 third warmest, 1998 (64F) second. _64F ____ Dec 6 ____ 1879 (59F) __________ 1982 (68F) __ 2001 (71F) ___ 1912 later tied by 1960 (t4 warmest). 1998 (66F) 3rd. Record high minima (count 5.0), extinction date Nov 12, 2022. _55F ____ Apr 6 ____ 1911 (52F) ________ 2010 (58F) __ 2010 (58F) __ 1912 tied with 1921,1948 (55F) _ _ _ _ _ _ _ _ _ _ _ _ _ _ _ _ _ _ _ _ _ _ _ _ _ _ _ _ _ _ _ _ _ _ _ _ _ _ _ _ _ _ _ _ _ _ _ also 1928 (54F), 1985,91 (53F) _56F ___ Nov 12 ___ 1909 (54F) _________ 2022 (60F) __2022 (60F) __ 1912 tied by 1935 (56F), also 1982 (55F), 1931 (53F) _45F ___ Dec 5 ____ 1870 (43F) _________ 1916,51 (53F) _ 1973,82 (56F) _ also 2001 (55F), 1998 (52F) _48F ___ Dec 6 ____ 1879 (43F) _________ 1951 (51F) __ 2001 (58F) __ also 1982 (57F), 1993 (54F) _43F ___ Dec 18 ___ 1889 (40F) _________ 1996 (47F) __ 1996 (47F) __ 1912 later tied by 1984 (43F) __________________________________________________________________ 1913 _ The year holds the record for most record highs established, 26 for a count of 25.33 (one three-way tie), but gradually all but one was broken, and that one has become a three-way tie, so the count is now a mere 0.33 (survival rate of 1.3%). Despite setting eight new records in January, the month's mildest reading (63F 12th) was not a new record, and the 95F reading on Aug 10 was not a record (98F 1891). January, March, May and November had the most significant warm spells. The average margin by which 1913 entered these numerous new records was impressive, 3.3 F deg. The average extinction date for them was 1943, which would change to 1945 if the one surviving record fell this August. The count for 1913 had fallen to 5.33 by the time another one was broken in 1988, and only reached its current level after losing two more (May 2, 3) in 2001. The average by which 1913 records were surpassed by eventual records was 7.4 F deg, which falls to 7.3 with inclusion of the surviving record. Despite all the warmth, March 7 (20F) was a low maximum (count 1.00). The year had just one record low minimum (May 11, 36F) after reaching a count of 4.5 back in its time. Most of the other records set were fairly weak and soon erased. The year has done a bit better holding on to some of its record high minima with a count of 3.00 from an original count of 13.67. A later tied 49F on Mar 15 (2019) was broken in 2024. May 2 (67F) held on, May 3 (also 67F) eventually fell in 2015. Other records include 47F (Jan 31) and 61F (Mar 25). Although some previous years set more than 20 record high minima, only 2015 would set more than 1913 after the end of this year. Temp ___ date ___ replaces _ ties _______ broken ___ eventual end of data record max, recent max _59F ____ Jan 3 ____ 1876 (58F) _________ 1950 (60F) __ 2000 (64F) ___ also 1997 (62F), 1998 (60F) _58F ____ Jan 6 ____ 1890 (57F) _________ 1929 (61F) __ 2007 (72F) _56F ____ Jan 11 ___ 1891 (51F) _________ 1924 (57F) __ 2020 (69F) ___ 63F next day not rec (64F 1890) _60F ____ Jan 17 ___ 1889 (57F) _________ 1990 (63F) __ 1990 (63F) ___ 1913 later tied second warmest by 1973. _58F ____ Jan 18 ___ 1876 (56F) _________ 1973 (66F) __ 1973,90 (66F) ___ t-4th with 2006, 1986 3rd (63F). _60F ____ Jan 21 ___ 1906 (59F) _________ 2006 (63F) __ 2006 (63F) ___ second warmest _56F ____ Jan 26 ___ 1870 (54F) _________ 1916 (60F) __ 1950 (72F) ________ 1990 (59F). _61F ____ Jan 31 ___ 1880 (51F) _________ 1916 (63F) __ 1916,47 (63F) __ 1913 tied with 2013 third warmest. _59F ____ Feb 20 ___ 1872 (53F) _________ 1930 (69F) __ 1930, 1939 (69F) __ 1913 later tied by 1918,22__ 2018 (67F). _62F ____ Feb 21 ___ 1906 (58F) _________ 1930 (68F) __ 2018 (78F) _65F ____ Mar 9 ____ 1871,78 (60F) ______ 1921 (66F) __ 2016 (77F). _63F ____ Mar 15 ___ 1912 (60F) _________ 1983 (68F) __ 1990 (77F) __ 1913 later tied by 1945,71 _63F ____ Mar 16 ___ 1886 (60F) _________ 1921 (64F) __ 1990 (82F) _66F ____ Mar 21 ___ 1903 (65F) _________ 1919 (67F) __ 1921 (84F) ________ 2012 (67F). _72F ____ Mar 24 ___ 1903 (66F) __________1988 (76F) __ 1988 (76F) __ 1913 later tied 2nd warmest (1939 72F). _77F ____ Mar 25 ___ 1910 (75F) __________1963 (79F) __ 1963 (79F) __ 1913 second warmest __ 2016 (72F). _72F ____ Mar 26 ___ 1904 (65F) __________1922 (76F) __ 2021 (84F) __ 1913 t4th warmest (1943 72F, 1986 third 75F). _89F ____ May 2 ____ 1899 (86F) __________ 2001 (90F) __ 2001,18 (90F) __ 1913 third warmest, 2010 (88F) fourth. _89F ____ May 3 ____ 1878 (84F) __________ 2001 (90F) __ 2018 (92F) _____ 1913 third warmest, 1878, 1969 (84F) t4th. _95F ____ July 30 ____ 1886 (94F) _________ 1917 (98F) __ 1917,33,40,88 (98F) _90F ____ Aug 3 ___________ 1873,79 (90F) _ 1926 (96F) __ 2005 (97F) ___ 1873,79,1913 later tied by 1923. _93F ____ Aug 17 ____ 1890 (90F) __________ 1922 (94F) __ 1944, 2015 (95F) _94F ____ Aug 18 ___ eventual record tied by 1987, 2002 .. (fourth warmest 1956, 1995 (92F), replaced 1872 (91F)). _72F ____ Oct 28 ____ 1899 (70F) __________ 1919 (83F) __ 1919 (83F) _________ 1984 (79F). _72F ____ Nov 20 ____ 1900 (69F) __________ 1934 (74F) __ 1985 (77F) _70F ____ Nov 23 ____ 1909 (64F) __________ 1931 (72F) __ 1931 (72F) ___ later tied by 1927 (t3 warmest, 1992 (71F) 2nd). Record high minima (count 13.67), end of data 3.0 survive _39F ___ Jan 11 _________ 1909,13 (39F) ___ 1933,56 (41F) _ 2020 (51F) __ also 1975 (48F), 1972 (44F) _40F ___ Jan 16 ____________1899 (40F) ___ 1995 (53F) __ 1995 (53F) __ 1899,1913 later tied by 1932,74 (40F) also 2016 (42F) _45F ___ Jan 17 ____________1899 (45F) ___ 1990 (46F) __ 1990 (46F) __ also 1876,1933,49,95 (42F) _45F ___ Jan 18 ___ 1870,1906,10 (43F) ___ 1915 (47F) __ 1915 (47F) __ 1973 (45F), 1995,99,2017 (38F) _40F ___ Jan 24 ____________1909 (40F) ___ 1953 (49F) __ 1967 (54F) __ 1909,13 tied by 1914,42 (40F), 2002 (45F) _40F ___ Jan 26 ___ 1878, 1911 (37F) _____ 1916 (49F) ___ 1916 (49F) __ also 1967 (44F), 2017 (43F) _43F ___ Jan 31 ___ eventual record high minimum __ 1988 (41F), 2002 (40F), broke 1906 (39F) _44F ___ Feb 21 ___ 1906 (43F) ___________ 1930,2002 (50F) _ 2018 (55F) __ 1981 (47F), 1996 (46F) _45F ___ Mar 14 ___________ 1878 (45F) ___ 1927 (46F) __ 1953 (51F) __ 1946, 2012 (50F), 1977 (47F) _49F ___ Mar 15 ___ 1908 (44F) ___________ 2024 (51F) __ 2024 (51F) __ later tied 2019 (49F), 1981 (47F), 1996 (46F) _49F ___ Mar 15 ___ eventual record high minimum later tied by 2019 __ also 2002 (48F), 1946 (47F), 1945,89 (46F), broke 1908 (44F) _61F ___ Mar 25 ___ eventual record high minimum ___ 1910 (52F), 1928, 1987, 2000 (50F) _47F ___ Mar 26 ___ 1886 (46F) __________1921 (49F) __ 1986,2021 (52F) __ also 1946 (51F), 1963,2000 (50F) _57F ___ Apr 24 _________ 1869,95 (57F) __1979 (59F) __ 2008 (63F) __ also 2007 (58F) _67F ___ May 2 ___ eventual record high minimum __ 2001,10 (66F), 1899, 2018 (65F) _67F ___ May 3 ___ 1880,1894,1910 (56F) __ 2018 (70F) __ 2018 (70F) __ also 2001 (68F), 2010 (67F) _74F ___ Aug 18 _______ 1878,1901 (74F)__1955 (75F) __ 2002 (78F) __ 1878, 1901,13 later tied by 1939 (74F) _63F ___ Oct 11 ____________ 1898 (63F) __ 1914 (64F) __ 2018 (69F) __ also 1949 (68F), 1990 (67F) _56F ___ Nov 20 ____________ 1900 (50F) __ 1985 (62F) __ 1985 (62F) __ also 1941,54,91 (55F) _51F ___ Nov 21 ____________ 1902 (51F) __ 1931 (54F) __ 1991 (62F) __ also 1952 (55F), 1983 (53F) _________________________________________________________________________________ 1914 _ This year also carried its own weight with 12 new records, three ties making the count 10.50 -- five other dates came close to adding to that, May 26-28 all fell one degree short (94F, 95F to 1880 and 87F to 1899), then Oct 22 (74F) within two, Nov 6 within one (67F). Two have survived, one as a tie and another as part of a three-way tie, for a count of 0.83 and a survival rate of 7.9%. The average margin of 1914 records to the previous ones broken is 2.4 F. On the average, 1914 records were broken (in ten cases) by the year 1944, this would change to 1957 if the two surviving records fell later this year. The average surplus of eventual records to these 1914 records is 6.5 F deg which falls to 5.4 F if the two surviving records are included. The year has shares in six record low maxima but all are ties and the count is 2.67. 1914 started with a count of 14.75 record low minima (17 with four being ties), and managed to preserve eleven of those record low minima as eventual records, with a count of 8.83, the most notable was -5 on Jan 14th. The count for the year was better than 24 of the 32 starter era years despite those having a higher expectation at random by about 25%, and higher than all the rest since then. The eventual count of record low minima (8.83) ranks fourth behind only 1875 (14.5), 1888 (12.75) and 1874 (10.0), and slightly ahead of fifth place 1879 with 8.50. In addition there were seven readings which, while not records in 1914, were the coldest readings since earlier records by the end of data in 2021 (a count of 5.17 for that, one of the higher such counts and the highest in the period 1870 to 1932 -- this is a statistic that increased around the 1930s to 1980s as the urban heat island robbed cold nights of their chance to break older records, and the peak value is 9.7 for 1967 with 1976 in second at 8.58). There were no surviving high minimum records in 1914, the closest reading to an eventual record was 42F (Jan 30) which survived as a record high minimum until 1989 (44F) and was also edged by 1991 (43F). 74F on Aug 19th was already beaten by 77F (1906) an eventual tied record holder. The count of records set in 1914 was only 3.67, one of the lowest to that date. Temp ___ date ___ replaces _ ties _______ broken ___ eventual end of data record max, recent max _58F ____ Jan 30 ___ 1869 (54F) _________ 1932 (60F) __ 2006 (64F) _73F ____ Mar 27 ___ 1908 (72F) ________ 1945 (74F) __ 1998 (83F) ___ 1914 later tied by 1939 _82F ____ Apr 19 ___ 1886 (81F) _________ 1972 (86F) __ 1976 (92F) ________ 2002 (89F). _89F ____ May 22 ___ 1911 (86F) ________ 1941 (96F) __ 1941 (96F) __ later tied by 1921 ______ 1992 (93F). _91F ____ June 12 ___ 1872,1901 (89F) __ 1933 (93F) __ 1933,73,2017 (93F) _94F ____ Aug 19 ___ eventual record tied by 1966, 2002 .. (fourth warmest 1872, 1978 (92F)). _93F ____ Sep 2 ____________ 1898 (93F) __ 1921 (94F) __ 1953 (102F) ___ also 1944 (97F) 1980 (96F). _95F ____ Sep 22 ____ eventual record tied 1895 .. (tied third warmest (94F) 1970, 1980, fifth (92F) 1931). _83F ____ Oct 11 ___ 1904 (79F) _________ 1949 (85F) __ 1949 (85F) ___ (1954 second 84F, 1914 and 1955 t3 (83F)). _76F ____ Oct 22 ____________ 1884 (76F) __1920 (83F) __1979 (88F) ________ 1984 (77F). _76F ____ Nov 4 ____ 1903 (70F) _________ 1961 (77F) __ 1975 (78F) ___ 1987 (77F) t2nd, 1914 t4 warmest (1974,1994). _64F ____ Dec 3 ____ 1913 (58F) _________ 1998 (69F) __ 1998 (69F) ___ later tied by 1970 (t3), 2009 (66F) second. Record high minima (3.67), none have survived, extinction date was Jan 30, 1989 _40F ____ Jan 24 ________ 1909,13 (40F) ___ 1950 (41F) __ 1967 (54F) ___ 1909,13,14 later tied by 1942 _ _ _ _ _ _ _ _ _ _ _ _ _ _ _ _ _ _ _ _ _ _ _ _ _ _ _ _ _ _ _ _ _ _ _ _ _ _ _ _ _ _ _ _ _ _ _ _ also 1953 (49F), 2002 (45F) _42F ____ Jan 30 ____ 1869 (41F) __________ 1989 (44F) __ 1989 (44F) __ also 1991 (43F) _68F ____ May 28 ___ 1881 (67F) __________ 1918 (70F) __ 1959 (73F) __ also 1991 (72F), 1939,2012,16 (71F) _71F ____ June 12 _________ 1880,98 (71F) __ 1942,73,97 (72F) _ 2017 (76F) _ 1880,98,1914 later tied by 1939 _ _ _ _ _ _ _ _ _ _ _ _ _ _ _ _ _ _ _ _ _ _ _ _ _ _ _ _ _ _ _ _ _ _ _ _ _ _ _ _ _ _ _ _ _ _ _ _ _ _ _ also 2015 (75F) _64F ____ Oct 11 ___ 1898, 1913 (63F) _____ 1949 (68F) __ 2018 (69F) __ also 1990 (67F) _____________________________________________________ 1915 _ This year was rather average most of the time but April and September were both quite warm and set numerous records. The annual total is 12 compared to the expected 7.7. Of these, four have survived, two each from April (25th, 27th, 91 and 92 F) and September (9th, 94F and 16th, 93F). That is a survival rate of 33.3%, one of the highest for years before 1920. In addition, 58F on Jan 19th fell one degree short of the 1876 record and 81F on April 19th was also not a record (82F 1914). The average margin of increase of these 1915 records was 4.3 F deg. The average year breaking eight records from 1915 was 1927, but this would be 1959 if the four established records fell this year or next. The average surplus of the eventual record highs over 1915 records is 6.6 F deg, which falls to 4.4 F if the four actual records are included. There were two record low maxima, count 1.50, one in May and one in August (64F on Aug 6 is colder than any daytime high in the interval of July 12 to Aug 5). There were two record low minima (count 1.25) with 55F on Aug 18th. These are the residue of an original count of 4.667, with numerous ties, quite a few set around June which was quite chilly. The only surviving high minimum from an original count of 7.83 is 47F from Jan 18th (count 1.0). Three values in the low 70s from Sept 14-16 have all been broken by 1 F deg since being set. The April warm spell had less prolific overnight lows that have been eclipsed by larger margins (60F on 20th not a record). Temp ___ date ___ replaces _ ties _______ broken ___ eventual end of data record max, recent max _58F ____ Feb 15 ___ 1896 (54F) _________ 1939 (62F) __ 1949 (73F) _________ 2018 (62F). _82F ____ Apr 20 ___ 1896 (79F) _________ 1927 (90F) __ 1927 (90F) __ t6 1952, 2nd 1976 (89F), 3rd 2005 (87F), 4th 1938 (85F), 5th 2006 (83F). _91F ____ Apr 25 ___eventual record .. (second warmest 2009 (88F), third 1960 (87F), fourth 1895, 1939 (86F). _92F ____ Apr 27 ___eventual record .. (second warmest 1962, 1990 (91F) fourth 1969, 2009 (84F)). repl 1891 (78F) _94F ____ Sep 9 ___ eventual record .. (second warmest 1959 (93F) third 1964 (92F), fourth 1884, 1931, 2002, 16 (91F)). _90F ____ Sep 14 ___ 1903 (88F) ________ 1931 (93F) __ 1931 (93F) ___ 1915 t3rd with 1995, second 2016 (91F). _91F ____ Sep 15 ___ 1901 (88F) ________ 1927 (92F) __ 1927 (92F) ___ 1915 second warmest tied 1942 (91F), third 1993 (90F). _93F ____ Sep 16 ___eventual record .. (t 2nd 1941,70,91 (92F) 5th 1942 (89F), t6th 1894,1930,39,58,2015 (88F)). (repl 1894) _91F ____ Sep 17 ___ 1901 (88F) ________ 1927 (92F) __ 1927 (92F) ___ t3 warmest, later tied by 1941 (91F), 2nd 1972 (92F) _78F ____ Oct 21 ___ 1884 (76F) _________1920 (84F) __ 1920 (84F) _________ 2017 (78F). _71F ____ Nov 1 ____ 1882,88 (69F) _____ 1919 (72F) __ 1950 (84F) _________ 2003 (77F). _57F ____ Dec 18 ___ 1888 (52F) ________ 1927 (59F) __ 1937,84 (63F) ______ 2006 (59F). Record high minima (7.83), end of data 1.0 survive _47F ___ eventual record high minimum __ 1913, 1973 (45F), 1995,99,2017 (38F) _46F ___ Feb 24 ___ 1875,1909 (43F) ____1930 (50F) __ 2017 (58F) __ also 1985 (54F) 1981,2000 (48F) _52F ___ Apr 11 ___ 1878,98 (49F) ______ 2017 (61F) __ 2017 (61F) __1915 later tied by 1919 (52F), also 1922,55 (58F) _73F ___ Sep 14 ___ 1903 (72F) _________ 1947 (74F) __ 1947 (74F) __ also 1961 (72F) 1994,2005 (70F) _74F ___ Sep 15 ____1903 (73F) _________ 1931,2005 (75F) __ 1931,2005 (75F) __ also 1901 (72F) _72F ___ Sep 17 ___ 1894,98,1905,07 (71F)__1991 (77F) __1991 (77F) __ also 1930 (71F), 1971,2005 (70F) _62F ___ Oct 14 _____________ 1899 (62F)__1938 (63F) __ 1990 (68F) __ also 1954 (66F), 2014 (63F) _62F ___ Oct 15 ____ 1899 (61F) __________1955 (63F) __ 2014 (69F) __ also 1975 (66F), 1960,85 (65F) _59F ___ Oct 21 ________ 1884,1906 (59F)__ 1947,79 (64F) _ 1947,79 (64F) __ 1984 (62F), 2020 (59F) 1916 _ The year 1916 had a very mild January and a hot summer, followed by a warm October. Some other portions of the year were almost equally cold. The year set 17 record highs, with three ties reducing the count to 15.50. In addition, Nov 9 came within one degree (71F). Of these, seven have survived (count 6.00 after two tied) for a survival percentage of 38.7%. This is the highest so far in the series, 1925 did better. January retained four (3.00), August two and October one. The average increase of 1916 records over the ones broken by them (incl two ties) is 3.7 F deg. The average year breaking nine of these records was 1957 and this would increase to 1985 if the seven existing records fell within the next year. While the count of 1916 is already quite high at 6.00 for end of the period, it was 8.50 until Feb 1, 1988 and still at 6.50 until September 2015. The average margin of eventual records to 1916 records since broken is only 7.0 F deg and this falls to 4.1 F deg when the seven surviving records are included. Five record low maxima have survived, with ties the count is 3.83. Three of these were in a cool spell mid-June. Two record low minima have survived (9F and 7F, March 17-18) from the original count of 5.5 record low minima. The late January mild spell has retained two record high minima from 26th and 27th (49F, 53F) and 65F on Oct 20th has since been tied in 1984 (count 2.50 from the original 5.0 set). Hot weather in August had near record high minima but not quite in record range. (77F Aug 22 already broken by 1906 78F). Temp ___ date ___ replaces _ ties _______ broken ___ eventual end of data record max, recent max _58F ____ Jan 6 ____________ 1913 (58F) __ 1929 (61F) __ 2007 (72F) _61F ____ Jan 22 ___eventual record later tied by 1959 .. (1906 3rd (60F), 1986 4th (59F), 1973 5th (58F), 1957 6th (57F), 1967 7th (56F), 1932 8th (54F) _55F ____ Jan 25 ___ 1909 (52F) _________ 1938 (56F) __ 1967 (60F) ________ 2010 (57F). _60F ____ Jan 26 ___ 1913 (56F) _________ 1950 (72F) __ 1950 (72F) ___ 1916 second warmest __ 1990 (59F). _69F ____ Jan 27 ___eventual record .. (second warmest 1974 (66F), third warmest 2002 (62F)). (repl 53F 1880). _66F ____ Jan 28 ___eventual record .. (second warmest 1880 (65F) third warmest 1947, 2002 (60F). _63F ____ Jan 31 ___eventual record tied by 1947 .. (third warmest 1913, 2013 (61F), fifth 1974 (60F)). _60F ____ Feb 1 ___ 1877 (53F) _________ 1988 (62F) __ 1989 (67F) __ 1916 fourth warmest ___ 2012 (62F). _94F ____ July 13 ___ 1876,94 (93F) _____ 1952 (96F) __ 1966 (101F) _________ 1994 (96F). _94F ____ July 31 __________ 1890 (94F) __ 1917 (100F) _ 1933 (102F) ________ 2002 (95F). _95F ____ Aug 22 ___ eventual record .. (second warmest 94F 1976, third warmest 1872 (92F)). _92F ____ Aug 23 ___ eventual record .. (second warmest 91F 1918, third warmest 1911, 76, 89, 1996 (90F)). _93F ____ Sep 8 ____________ 1872 (93F) _ 2015 (97F) __ 2015 (97F) ___ tied later by 1919 (1872,1916,19 t3 warmest). _84F ____ Oct 8 ___ 1881,1900 (80F) ____ 1931 (86F) __ 2007 (87F) ___ third warmest (fourth is 1990, 81F). _86F ____ Oct 9 ___ eventual record .. (tied second warmest (84F) 1939,42,49,59,61,90,2011). (repl 1879 82F) _77F ____ Oct 20 ___ 1905,06 (71F) ______ 1938 (78F) ___ 1947,69 (80F) ___ 1916 tied later by 1936, 1984 (76F). _63F ____ Dec 5 ____ 1877 (57F) _________ 2001 (70F) ___ 2001 (70F) ___ 1916 tied later by 1982, 1998, 1999 (t2). Record high minima (5.0), end of data 2.5 survive _49F ____ Jan 26 ___ eventual record high minimum __ broke 1913 (40F) __ also 1967 (44F), 2017 (43F) _53F ____ Jan 27 ___ eventual record high minimum __ broke 1911 (42F) __ also 1952,74 (45F), 1932 (43F), 2002 (41F) _42F ____ Feb 1 ____ 1877 (41F) _________ 1988 (50F) __ 1988 (50F) __ also 2012 (48F), 1991,2016 (44F) _65F ____ Oct 20 ___ eventual record high minimum later tied by 1984 __ 1910 (64F), 2016 (62F) _53F ____ Dec 5 ____ 1912 (45F) _________ 1973,82 (56F)_ 1973,82 (56F) __ 1916 later tied by 1951 (53F), also 2001 (55F) _____________________________________________ 1917 _ The year was generally quite cold except for a brief heat wave in late July and early August. A record set on April 1st came against the general run of temperatures in the spring, and during a blocking episode when Ireland was seeing heavy snowfalls and Britain record low temperatures. The year only managed a total of five records, but two of them persist as eventual record highs, for a count of 1.25, a survival rate of 25%. These five averaged an increase of 6.8 F deg over the marks previously set. The average year breaking 1917 records is 1940, but this changes to 1973 if the two existing records fall soon. The three broken records from 1917 were only improved by 2 deg each (July 31-Aug 2) and that average falls to 1.2 F counting the two surviving values. There were seven surviving record low maxima (from 8.83 set in 1917), including the last three days of the year; 2F on Dec 30, 1917 is both a monthly and all-time record low value. There were also seven record low minima (count 6.33) including September 11th-12th and the last four days of the year, with the monthly extreme of -13F on Dec 30. This is second lowest to -15F on Feb 9, 1934 in the data set, although I suspect Jan 1857 may have been that cold also. This count preserves most of the original crop of low minima, a count of 8.17. The survival rate of 77.5% ranks third highest before 1930, around when survival rates started to improve (since a warming climate thereafter meant few opportunities for breaking any records set). The year retains two record high minima, 82F on both July 31 and August 1. (count 2.00). This was almost all of the sparse 2.5 count for the year, which ranks third lowest behind 1873 and 1874 (2.0 each). Temp ___ date ___ replaces _ ties ________ broken ___ eventual end of data record max, recent max _83F ____ Apr 1 ___ eventual record .. (second warmest 1974 (66F), third warmest 2002 (62F)). (repl 70F 1893). _98F ____ July 30 __eventual record tied by 1933,40,88 .. (fifth warmest 1954 (96F), t6th 1913,29,49,2002 (95F)). _100F __ July 31 ___ 1890, 1916 (94F) _____ 1933 (102F) _ 1933 (102F) ___ 1917 t2nd with 1954 (100F). _98F ____ Aug 1 ___ 1911 (92F) ____________ 1933 (100F) _ 1933 (100F) ___ 1917 t2nd with 1955,99 (98F). _98F ____ Aug 2 ___ 1879 (92F) ____________ 1955 (100F) _ 1955 (100F) ___ 1917 t2nd with 1933 and 1975 Record high minima (2.5), end of data 2.0 survive _78F ____ July 30 ______________ 1898 (78F)__1988 (79F) __ 2002 (80F) ___ also 2019 (78F) _82F ____ July 31 ___ eventual record high minimum __ broke 1890 (77F), also 1898,1908 (76F), _ _ _ _ _ _ _ _ _ _ _ _ _ _ _ _ _ _ _ _ _ _ _ _ _ _ _ _ _ _ _ _ _ _ _ _ and 75F (1979,83,88,1995,99,2008) _82F ____ Aug 1 ____ eventual record high minimum __ broke 1904 (77F), also 1999,2006 (79F), 1979 (78F) _____________________________________________________________ 1918 _ Despite a very cold January and early February, this year had enough warm intervals to manage 16 new record highs, one tied for a count of 15.50, and two of these have survived, including August's highest temperature, 104F on 7th. That is a survival rate of 12.9%. Also June 1 (94F) came close to adding another record. These records increased previous values by an average of 3.3 F deg and by 1918 we can see that the replacement cycle is now shifting out of the starter era, as the median value of years replaced or tied was around 1896. The average year replacing 14 records from 1918 was 1946, which shifts to 1955 if the two existing records fell soon. The average surplus of the eventual records to 1918 values is 5.8 F deg which falls to 5.1 counting the surviving records. Seven low maxima survived as records (count 6.00) including 4F on Feb 5, the lowest for that month, and two more in the first two days of January extending that streak from Dec 29-31 1917 to five consecutive days. From an original count of 8.33, there were seven low minimum records set (count 6.00), several of them in early January prolonging the spell begun in late December of the previous year. This was a nearly equal survival rate of 72.0% to the previous year as noted and a sixth place result in the interval 1869 to 1929. Also, there were five record high minima, count 2.83, from an original count of 10.33. The record maximum for August on the 7th was accompanied by a record high minimum of 82F. Temp ___ date ___ replaces _ ties _________ broken ___ eventual end of data record max, recent max _59F ____ Feb 20 __________ 1913 (59F) ____ 1930 (69F) __ 1939 (69F) __ 1913,18 later tied by 22 __ 2018 (67F). _75F ____ Mar 19 ___eventual record .. (second warmest 2012 (74F) third warmest 2010 (72F), fourth 1925 (71F)). (repl 1898 69F) _69F ____ Mar 22 ___ 1911 (64F) __________ 1929 (77F) __ 2012 (82F) _78F ____ Apr 2 ____ 1882 (73F) ___________ 1963 (80F) __ 1967 (81F) __ 1918 3rd warmest ___ 2006 (68F). _90F ____ May 6 ___ 1880 (84F) ___________ 1930 (91F) __ 1949,86 (92F). _91F ____ May 28 ___ 1899 (88F) __________ 1959 (94F) __ 1959 (94F) ___ 1918 fourth warmest, 1977, 2016 (92F) t2nd. _98F ____ July 22 ___ 1885,1906 (92F) _____ 1926 (100F) _ 2011 (104F) __ 1918 5th, 1957 (101F) 2nd, 1955 (100F) t3. _95F ____ July 23 ___ 1870 (92F) ___________ 1955 (99F) __ 2011 (100F) __ 1918 t5th with 1952, 1978 (95F), 1991 (99F) t2, 2016 (96F) 4th. _95F ____ Aug 5 ____ 1899 (94F) ___________ 1930 (96F) __ 1944 (101F) ________ 2005 (98F). _96F ____ Aug 6 ____ 1900 (95F) ___________ 1931 (97F) __ 1931,55 (97F) ___ 1918 third warmest, 1900 fourth (95F). _104F ___ Aug 7 ___eventual record .. (second warmest 1924, 2001 (99F), fourth 1896 (97F)). [ Aug max ] _96F ____ Aug 14 ___ 1872, 1908 (93F) _____1988 (99F) __ 1988 (99F) ___ 1918 t2 warmest with 2005 (96F). _71F ____ Oct 29 ___ 1874 (70F) ___________ 1946 (77F) __ 1971 (78F) ___ 1918 later tied by 1935,45 _ 1989 (76F). _75F ____ Oct 30 ___ 1912 (72F) ___________ 1946 (82F) __ 1946,61 (82F) _________ 2016 (76F). _66F ____ Nov 18 ___ 1906 (65F) ___________1921 (73F) __ 1921,28 (73F) _________ 1987 (70F). _61F ____ Dec 15 ____1901 (60F) ___________ 2001 (63F) __ 2015 (67F) ___ 2008 (66F) 2nd, 1918 fourth. Record high minima (10.33), end of data 2.83 survive _46F ____ Mar 22 ____________ 1903 (46F) __ 1929 (52F) __ 1948 (57F) __ also 2012 (56F) 1938 (54F) _51F ____ Apr 1 _____ 1886 (49F) ___________1948,52 (52F) _ 2016 (61F) __ also 1986, 2008 (54F), 2006 (53F), 1999 (52F) _49F ____ Apr 2 _____ 1875,1910 (49F) _____ 1933 (50F) __ 1967 (61F) __ also 1945 (54F), 1955 (53F), 1981,86 (52F) _70F ____ May 7 ___ eventual record high minimum later tied by 1930 __ broke 1894 (64F), 2000 (61F) _70F ____ May 28 ____ 1914 (68F) __________1939 (71F) __ 1959 (73F) ___ 1991 (72F), 2012,16 (71F) _76F ____ June 2 ___ eventual record high minimum tied by 1895 __ 1999 (74F), 1961 (72F) _80F ____ Aug 6 ___ eventual record high minimum tied by 1906, 1908 __ 1881 (78F), 1896, 2018 (77F) _82F ____ Aug 7 ___ eventual record high minimum __ 1906, 2001 (78F), 1876, 1988 (77F) _60F ____ Oct 28 ____ 1899 (59F) __________1947 (61F) __ 1971 (64F) __ also 1984 (62F) _62F ____ Oct 29 ____ 1900 (58F) __________1946 (63F) __ 1946 (63F) __ also 1947,1950,1984 (61F), 1971,2017 (60F) _64F ____ Oct 30 ___ eventual record high minimum later tied by 1946 __ also 1881 (62F), 1896 (60F), 1949,50,55,61,2019 (58F) _53F ____ Nov 17 ___ 1896 (51F) __________ 1927 (60F) __ 1927 (60F) __ also 1928 (57F), 1963, 2010, 2013 (51F) ___________________________________________________________________ 1919 _ Often quite warm and with a hot summer, 1919 had a total of 16 (count 15.33) record highs. Two have survived to the end of the data (Oct 3, 28), a survival rate of 13.1%. The average improvement of 1919 values from previous records on the sixteen dates was 2.9 F deg. The average year breaking fourteen records set in 1919 was 1937 which changes to 1949 if the October records are broken this year. The average surplus of the eventual records to these 1919 records is 6.5 F deg which reduces to 5.7 if the existing records are included. There were four record low maxima (count 3.50), in spring and autumn. Also there were eight record low minima, for a count of 7.00, with April contributing three. Dec 18th (-1F) went a full 14 deg below the previous record, a rather abrupt change for years after the starter era which averaged only 3 deg higher than eventual records. This record continued to be separated from other readings afterwards by 9 deg. These record lows were most of the originally set count of 9.5. Thus 1919 was the third consecutive year to show a high survival rate (73.7%, fifth highest 1870 to 1929). The three years 1917 to 1919 had an average survival rate of 74.4%. No high minimum records have survived, one (Sept 8th) was broken by one degree in 2015. Temp ___ date ___ replaces _ ties ______ broken ___ eventual end of data record max, recent max _61F ____ Jan 1 ____ 1885 (59F) _________1966 (62F) __ 1966 (62F) ________ 2005 (60F). _67F ____ Mar 21 ___ 1913 (66F) ________1921 (84F) __ 1921 (84F) ________ 2012 (67F). _82F ____ May 4 ____ 1895 (81F) ________1942 (83F) __ 2001 (92F) _88F ____ May 5 ____ 1886 (81F) ________1930 (89F) __ 1949,55,80 (90F) ___ 2000 (86F). _92F ____ May 29 ___ 1895 (86F) ________1931 (93F) __ 1969 (97F) ___ 1919 fourth warmest, 1987 (96F) 2nd. _95F ____ June 4 ____ 1871 (90F) ________1925 (99F) __ 1925 (99F) ___ 1919 t2nd with 1943 (95F) _99F ____ July 4 _____ 1911 (97F) ________1949 (102F) __ 1949 (102F) ________ 1999,2002,2010 (96F). _98F ____ July 5 _____ 1911 (97F) ________1999 (101F) __ 1999 (101F) ___ 1919 later tied by 1955 (t3) (2010 99F). _93F ____ Sep 8 ______ 1872, 1916 (93F) _ 2015 (97F) __ 2015 (97F) ___ (1872, 1916, 1919 t3 warmest (93F)). _87F ____ Oct 3 ___ eventual record .. (second warmest 1922 (86F), third 1879 (85F), fourth 1968 (84F)). 1983 (82F). _80F ____ Oct 10 ___ 1912 (78F) ________ 1939 (80F) __ 1939 (91F) __ also 88F 1949 _______ 1997 (82F). _83F ____ Oct 28 ___ eventual record .. (second warmest 1984 (79F), third 1946 (78F), fourth 1947,71,89 (77F)). repl 1913 (72F) _74F ____ Oct 31 ___ 1896 (72F) _________ 1933 (76F) __ 1946,2024 (81F) __ 1933,45,50,61 (76F) _72F ____ Nov 1 ____ 1915 (71F) _________ 1927 (73F) __ 1950 (84F) ___ also 81F 1974 ______ 2003 (77F). _64F ____ Nov 30 ___ 1908 (62F) _________ 1927 (67F) __ 1991 (70F) _61F ____ Dec 13 ___ 1881 (59F) _________ 1923 (64F) __ 2015 (67F) Record high minima (5.0), none have survived, extinction date Sep 8, 2015 _48F ____ Mar 5 _____________ 1880 (48F) __ 1974 (49F) __ 1979 (50F) __ also 1977 (48F), 1964 (46F), 2004 (44F) _52F ____ Apr 11 _____________1915 (52F) __1922,55 (58F)_ 2017 (61F) __also 2014 (56F) _70F ____ May 30 ___ 1871,95,1908,11 (68F)__1986 (73F) __ 1987 (74F) __ also 2013 (72F), 1919 later tied by 1931 (70F) _71F ____ June 5 _____________ 1883 (71F) __1925 (78F) __ 1925 (78F) __ also 2010 (76F), 1919 later tied by 1923 (71F) _75F ____ Sep 8 ____ 1884 (74F) ____________2015 (76F) __ 2015 (76F) __ also 1985 (74F), 1971 (73F) _65F ____ Oct 10 _____________ 1879 (65F) __1922 (67F) __ 2018 (71F) __ also 1949 (69F), 1990 (68F) _60F ____ Nov 1 ____ 1882 (57F) ___________ 1956 (65F) __ 1956 (65F) __ also 1971 (63F), 1982 (62F) _______________________________________________________________________ 1920 _ The year began with a very cold January but had some warmer intervals in spring, and was otherwise rather unremarkable. The total number of record highs was only six but two have survived (33.3% rate). These were both in October. The six 1920 records increased by an average of 4.2 F deg over previous marks. The average year breaking four 1920 records was 1973, which becomes 1989 if the two October values are beaten this year. The four non-surviving records were broken by an average of 6.0 F deg which reduces to 4.0 if the two records are included. Two record low maxima survive, from January and June. The year has 5.5 record low minima including -1F on Jan 31st and -2F on Feb 1, as well as two consecutive 55F record lows July 26-27. The original count of 11.08 was higher than all later years although of course over time the expected number falls away, a few later years had better outcomes relative to expected. 1920 has no surviving high minimum records. The value of 60F on Oct 22 was broken several times with the eventual record being 67F in 1979. The count of 1.0 would survive as the lowest annual count until 1924 failed to set any record high minima. It would later be tied by 1940 and the next year failing to set any was 1958. Temp ___ date ___ replaces _ ties ________ broken ___ eventual end of data record max, recent max _71F ____ Mar 31 ___ 1905 (70F) _________ 1979 (75F) __ 1998 (86F) _94F ____ June 11 ___ 1893,94 (90F) _____ 1973 (95F) __ 1973 (95F) ___ 1920 t2 with 1984 (94F). _88F ____ Sep 24 ___ 1870,81 (85F) ______ 1959 (89F) __ 2017 (91F) ___ third warmest (1961,70 t4th (87F)). _84F ____ Oct 14 ___ eventual record .. (second warmest 1975 (83F), third 1954 (81F), fourth 1883, 1952, 1990 (80F)) _84F ____ Oct 21 ___ eventual record .. (second warmest 1947 (83F), third 1949,63,79 (80F)) 1915, 2017 (78F). _83F ____ Oct 22 ___ 1884, 1914 (76F) ___ 1979 (88F) __ 1979 (88F) ___ 1920 second warmest, third 1975 (78F). Record high minima (1.0), none have survived, extinction date Oct 22, 1929 _60F ___ Oct 22 ___ 1893 (59F) _________ 1929 (61F) __ 1979 (67F) __ 2020 (64F) 1935,36,42 (62F)
-
The decade of 1881 to 1890 set a total of 104.66 starter maximum daily records (random for 10 of 32 years would be 114.5). Of those, only 8.5 have survived as eventual records or tied records. (random 24.1). 1881 -- Although the winter remained cold, most of this year turned quite warm again, and set 16 "starter" highs (two tied for a count of 15.00). Of those, six still remain, two later tied, one untied in May, three untied in September, one tied also, and one later tied in December (count 5.00, survival percentage 33.3%, or 37.5% of shared dates). This is a relatively good production and also retention rate from this era. The reading of 101F on Sept 7 was only surpassed by Sept 2, 1953 (102F) and remains the latest 100F reading of any summer season. The record 93F on May 12 was the earliest occurrence of that temperature before May 10, 1970 and was not surpassed until April 1976. May 11 (90F) was not a starter record as 1896 reached 91F. September 1881 was warmest on record after adjustment for urban heat island (which was weak compared to more recent contenders). The average maximum in September 1881 was 80.8 F (1871-1900 mean 73.6). December 1881 was also a very mild month. The average for years that broke 1881 records was 1936 for the ten that have fallen, if the other six fell this year, that average would change to 1968. The ten records broken were eventually surpassed by an average of 5.9 deg which drops to 3.7 if the records are averaged in also. The year had nine record low maxima by end of the data set, of which three were tied, so the count is 7.50. One of those was 50F on Oct 5th, between record highs on 1st and 8th. 1881 with a count of 15.0 for record low minima in the starter era established six surviving record low minima with three two-way ties for a count of 4.50. Two were in the same brief cold interval between the October record highs. 35F on Oct 5th remains the earliest on record for that reading. For record high minima, the May heat records had minima in the mid 60s which were recently broken, but September 7th (79F) is tied with 2nd (1898), as high September minimum. Three other records survived from the late Sept to Oct 1st warm spell (two of these since tied) -- 75F on 27th the most impressive of them. Oct 31 shares a record high min with 1961. The December warmth was not as able to sustain its modest record high minima. The total count from 11.667 original high minima is five dates, three since tied, count of 3.50 and a survival rate of 30.0%. Record high maxima (count 15.0, eventual end of data count 5.0) Temp ___ date _____ broken _____ eventual end of data record max _93F ___ May 12 ___ eventual record .. (second warmest 89F 1991, third warmest 88F 1959, 1987) (prev day 90F non rec) _96F ___ Aug 13 ___ 2002 (98F) __ 2005 (99F) ____ tied later by 1944, 1988 (and by later non-rec, 2016) _93F ___ Aug 31 ___ 1953 (100F) _ 1953 (100F) ___ also later exceeded by 94F (1973) and 96F (2010). _97F ___ Sep 6 ____ eventual record .. (second warmest 94F 1983, third warmest tied 93F 1922, 1987, 2018.) 101F ___ Sep 7 ____ eventual record .. (second warmest 93F 1919, third warmest 92F 2015, fourth 91F tied 1983, 1995) _85F ___ Sep 24 ____ 1920 (88F) __ 2017 (91F) ____ tied 1870 _89F ___ Sep 25 ____ 1970 (90F) __ 1970 (90F) ____ tied later by 1926 and non-rec 2010, so tied for second warmest of date. _91F ___ Sep 26 ____ eventual record tied in 1970 .. (third warmest 90F 1895, fourth warmest 89F 1958.). (recent, 87F 2007). _86F ___ Sep 27 ____ 1933 (90F) __ 1933 (90F) ____ now tied fourth with 1972, after 89F (1998.) and 87F in 2017. _88F ___ Sep 28 ____ eventual record .. (second warmest 85F 1943, third warmest 84F 2014, fourth 83F 1901,48,54,59) _82F ___ Sep 30 ___ 1905 (88F) __ 1986 (89F) _84F ___ Oct 1 ____ 1927 (88F) __ 1927 (88F) ____ second warmest of date, third is 86F (1950). _80F ___ Oct 8 ____ 1916 (84F) __ 2007 (87F) ____ tied by 1900 _70F ___ Oct 30 ___ 1912 (72F) __ 1946,61 (82F) _59F ___ Dec 13 ___ 1919 (63F) __ 2015 (67F) _67F ___ Dec 14 ____ eventual record tied in 2015 .. (third warmest tied 63F 1918, 2001, fifth 61F in 1991). Record High Minima (count 11.667 in the starter era, count as of Sept 7, 2023 is 3.5) _39F ___ Feb 10 ___ 1960 (41F) ___ 2024 (47F) __ also 2023 (45F), 1999 (43F) __________ 1881 tied by 1876, 1893, count for starter era 0.33, later tied also by 1925,56. _63F ___ May 12 ___ 1908 (65F) ___ 1959 (67F) __ tied by 1869, 1897 (count 0.333) _ also 66F 1970, 85, 93 (not recs) _67F ___ May 28 ___ 1914 (68F) ___ 1959 (73F) __ 1918 70F and 1939 71F also records; 72F 1991 2nd warmest (not rec) _78F ___ Aug 6 _____ 1906 (80F) ___ 1906,08,18 (80F) _ 1881 now 4th warmest, 1896, 2018 t5th (77F). _79F ___ Sep 7 _____ eventual record high minimum .. 2nd 2023 (76F), t-3rd warmest 1884, 1983 (75F), t-5th 1969, 85 (74F). ... ... ... above and 2nd 1898 are max for September also _71F ___ Sep 25 ____ eventual record high minimum later tied by 1970 .. t-3rd warmest 1945, 2011, 17, 25 (70F). _75F ___ Sep 27 ____ eventual record high minimum .. t-2nd warmest 1891, 1910 and 2007 (71F). _72F ___ Oct 1 _____ eventual record high minimum later tied by 1954 .. 3rd warmest 70F in 1959. _62F ___ Oct 30 ___ 1918 (64F) ___ 1918,46 (64F) ___ remains 3rd warmest, 4th is 60F (1896), t5th 58F (1949,50,55,1961,2019) _62F ___ Oct 31 ____ eventual record high minimum later tied by 1961 .. t-3rd warmest 1946,89,2019 (60F). _44F ___Dec 27 ____ 1949 (57F) ___ 1949 (57F) ___ 1881 now 6th, 1973, 2015, 2019 t-2nd (46F), 1971 5th (45F). _45F ___ Dec 28 ___ 2008 (47F) ___ 2023 (49F) ___ 1881 remains 3rd, 1954,82 t-4th (44F). _45F ___ Dec 29____ 1984 (55F) ___ 1984 (55F) ___ 1881 tied by 1905, (t-4th) 1996 2nd (48F) and 2005 3rd (47F). Summary: 13 records, 8 have been broken (average year 1943, would change to 1974 if all five remaining were broken in 2023.) The average eventual surplus for the eight broken is 5.9 F deg, would reduce to 3.6 for average of all 13. __________________________________________________________________ 1882 _ This year turned considerably colder than the previous four to six year relative warm spell. The idea that Krakatoa caused the cold 1880s must be partly wrong because 1882 and 1883 were generally cold, Krakatoa erupted in late August 1883. It is more likely that cold around 1884-1885 can be attributed to that volcanic dust veil. As a result of this trend, only four record highs were set in 1882, one tied later in 1888, for a count of 3.50 (similar to 1875 and slightly higher than 1893). The average year for breaking records set in 1882 was 1928. The average eventual surplus of the record high was 9.5 degrees. The extinction date for 1882 record maxima was Mar 2, 1972. The year eventually had six surviving low maximum records, one tied for a count of 5.50; a high reading of 6 on Jan 24 1882 is a monthly record which has been surpassed by 4 F in Feb and 2 F in Dec. The year had a low count of record low minima (6.0 in the starter era) but held on to three to the end of data (count 3.00), with -6 also on Jan 24th the most impressive; the others were in early December. There were no high minima that survived from the 9.833 count in the starter era, but 48F (Mar 2) was only edged out by 50F in 1972 and 1991. The July 11 record lasted until 1988. Record high maxima (count 3.50, extinction date Mar 2, 1972) Temp ___ date _____ broken _____ eventual end of data record max _64F ____ Mar 2 ____ 1972 (72F) ___ 1972 (72F) ____ now tied with 1973 fourth warmest (71F 1991 second, 67F 2004 third). _73F ____ Apr 2 ____ 1918 (78F) ___ 1967 (81F) _87F ____ Sep 19 ___ 1906 (90F) ___ 1983 (94F) ___ now fifth warmest, 1946 tied 1906 and 1947 had 88F. _69F ____ Nov 1 ____ 1915 (71F) ___ 1950 (84F) ____ tied later by 1888 Record High Minima (count 9.833 in the starter era, count as of end of data is 0.0, extinction date July 11, 1988) _43F ____ Feb 14 ___ 1949 (50F) ___ 1949 (50F) ___ 1882 remains 2nd, 1966,90 t-3rd (42F). _38F ____ Feb 15 ___ 1908 (40F) ___ 1984 (49F) ____ tied later by 1898 (count 0.5), 45F 1949 record to 1984. _42F ____ Feb 16 ____ 1954 (43F) ___2923 (56F) ___ 2002 (44F), 1954 tied later by 1976, 82, 84. _48F ____ Mar 2 ____ 1972 (50F) ___ 1972,91 (50F) __ 1882 remains 3rd, 1998 4th (45F). _49F ____ Apr 8 ____ 1908 (51F) ___ 1991 (66F) ____ tied later by 1903, 1922 (55F), 1929 (65F), also 2010 (64F) not a rec. _70F ____ June 9 ___ 1922 (72F) ___ 1984 (77F) ____ tied by 1876, 1898 (count 0.33), .. 1933 2nd (76F). _77F ____ June 25 __ 1909 (78F) ___ 2025 (81F) ____ tied by 1880 (count 0.5). remains t-3rd, 5th 1952 (75F). _77F ____ July 11 ___ 1988 (79F) ___ 1950 (84F) ____ tied later by 1905, remains t-2nd, t-4th 1987, 2013 (76F). _77F ____ July 28 ___ 1931 (78F) ___ 2020 (80F) ____ now t-3rd with 1949 (77F). _72F ____ Sep 20 ___ 1906 (77F) ___ 1906 (77F) ____ 1983 2nd (73F), 1882 t-3rd with 2005 (72F). _57F ____ Nov 1 ____ 1919 (60F) ___ 1956 (65F) ___ 1971 2nd (63F), 1982 3rd (62F). _50F ____ Nov 12 ___ 1902 (52F) ___ 2022 (60F) __ tied 1879 (count 0.5); 1912,35 (56F), 1982 (55F), 1909 (54F). Summary: 12 records set, average of years breaking these is 1931. The average eventual surplus is 7.9 F deg. __________________________________________________________________________________________ 1883 _ This was another quite cold year, March and September in particular were close to being coldest on record. However, it was noted in the comparative stats for NYC and Toronto that NYC ran a bit closer to normal at times, suggesting a strong gradient within a generally cold pattern. This may be why 1883 managed to produce even eight "starter" record highs; with no ties before 1900 the count was 8.00. By 1914 this year's count was already down to 4.5. The average year for breaking records set in 1883 was 1925. The average eventual surplus of the record high was 8.5 degrees. The extinction date for 1883 record highs was Feb 4, 1991. The year eventually had ten surviving low maximum records, two tied for a count of 9.00; September 9-12 was exceptional with four maxima in the low 60s, three setting records. Parts of March were also anomalously cold. The year had a count of 14 record lows in the starter era, and established only five record low minima with one tied (count 4.50), but this is deceptive, 1883 turned very cold at the same time as 1885 on several occasions and that was a really dominant cold year (only one record from a very cold March 1883 for example). The most significant cold minimum was probably 43F on Sept 10 which was the earliest autumn reading that cold. 1883 also has four minima that while not records at the time have become "coldest since records set" to the end of the data. The year managed to take down one high minimum, a rather weak one that has not been surpassed or tied, 73F on June 7th but this is several degrees lower than most date records in early June. It will very likely fall soon, having been nudged by 72F in 1984 in advance of several higher readings in a heat wave just developing on that date. (edit, this record was broken on June 7th, 2021 by 76F (1883 count now 0.00 from a starter era total of 10.5). Record high maxima (count 8.0, extinction date Feb 4, 1991) Temp ___ date _____ broken _____ eventual end of data record max _54F ____ Feb 4 ____ 1991 (63F) ___ 1991 (63F) ___ 1883 remained second warmest to 2016, is now 5th. _55F ____ Mar 15 ___ 1903 (56F) ___ 1990 (77F) _90F ____ June 10 ___ 1906 (91F) ___ 2008 (96F) _95F ____ July 7 _____ 1934 (97F) ___ 2010 (100F) _75F ____ Oct 11 ____ 1904 (79F) ___ 1949 (85F) _80F ____ Oct 14 ____ 1920 (84F) ___ 1920 (84F) ___ now tied fourth warmest with 83F 1975 second, 81F 1954 third. _68F ____ Nov 22 ____1931 (72F) ___ 1931 (72F) ___ now third warmest after 70F 1940 second. _64F ____ Nov 23 ____ 1913 (70F) ___1931 (72F) ___ later tied by 1909 Record High Minima (count 10.50 in the starter era, count as of end of data is 0.0, extinction date June 7, 2021) _51F ____ Apr 6 ___ 1911 (52F) ___ 2010 (58F) ___ tied by 1910 ... 1912,21,48 t2nd (55F). Also 53F in 1985, 1991 (not recs). _71F ____ June 5 __ 1925 (78F) ___ 1925 (78F) ___ tied by 1919,23 (and 1930,66) all t-4th. 2nd is now 76F (2010), 3rd 73F (1940). _73F ____ June 7 __ 2021 (76F) ___ 2021 (76F) ___ 1984 3rd (72F), 1968, 73 t-4th (71F). _70F ____ June 8 __ 1971 (73F) ___ 1984 (77F) ___ tied 1871 (count 0.5), later tied by 1922, 1946, 1965 and 1966. _70F ___ June 11__ 1967 (71F) ___ 1984 (78F) ___ tied 1879 and later by 1927; 74F 1973 record to 1984. _78F ___ July 5 ____ 1908 (80F) ___ 1999 (82F) ___ tied 1896 and later by 1919 (these are t-3rd, 1908 is 2nd). _78F ___ July 6 ____ 1908 (81F) ___ 1999 (83F) ___ also 81F (2010) and 78F (2013). 1883 now t-4th with 2013. _80F ___ July 7 ____ 1908 (84F) ___ 1908 (84F) ___ 1883 now t-2nd with 2010 (80F), 4th 2013 (78F). _61F ___ Oct 13 ___ 1901 (64F) ___ 1990 (69F) ___ 1983 2nd (67F), 1954 3rd (66F), 1901 4th (64F). 1969,70 t5th (62F). _56F ___ Nov 22 ___1931 (58F) ___ 1931,92 (58F) __ 1883 remains 3rd, 1909,53,91 t4th (55F). _50F ___ Nov 23 ___1927 (51F) ___ 1931 (58F) ___ 1934 2nd (55F), 1999 3rd (54F), 1963,91 t4th (53F). _49F ___ Dec 8 ____ 1951 (52F) ___ 1951 (52F) ___ 1966 2nd (50F), 1883 now t-3rd with 1974 (49F). Summary: 12 records set, the average for years breaking them is 1936. The average eventual surplus is 5.5 F deg. _________________________________________________________________________________ 1884 _ This year was not quite as cold as the two on either side of it, and had some limited warm spells. The production of starter record highs was about average (which is 11.4), at 12.00 from 14 records, including four tied with other years in the starter era (1869-1900). About half of these were in October. The average for years breaking records set in 1884 was 1921. The average surplus of the eventual record high was 10.6 deg. The extinction date for 1884 record highs is Sep 5th, 1961. The year produced eleven (now ten) record low maxima, one of which has become a four-way tie. That makes the count 10.25. One date held is leap year day Feb 29th. 7 for Dec 20 is a notable record low max. Note, this count has just been reduced to 8.75 as the cold spell at the end of May 2021 took away one record and tied another (low maxima). The year also established four record low minima, one of which was tied (count 3.50), after a fairly average production of 9.5 in the starter era. The low of -3 on Dec 20 was later broken by 1942 (-4F). From a starter era total count of 18.00, there are four surviving record high minima, one is now a three-way tie and another a two-way tie, so the count is 2.83. This is a survival rate of 15.8%. September 9-10 have minima of 77F, the highest values since these were set are 76 and 74 (both in the past decade). Record high maxima (count 12.0, extinction date Sep 5, 1961) Temp ___ date _____ broken _____ eventual end of data record max _51F ____ Feb 7 ____ 1904 (53F) ____ 2020 (56F) _56F ____ Feb 14 ___ 1938 (58F) ____ 1946 (63F) _58F ____ Mar 25 ___ 1910 (75F) ____ 1963 (79F) _____ later tied by 1904 _58F ____ Mar 28 ___ 1903 (62F) ____ 1945 (84F) _86F ____ May 24 ___ 1936 (92F) ____ 1975 (93F) ___ tied by 1880, 1904, 1912 _90F ____ Sep 5 ____ 1961 (93F) ____ 1985 (95F) ____ tied by 1898 and later by 1944, 1959 _91F ____ Sep 9 ____ 1915 (94F) ____ 1915 (94F) ____ now tied fourth, 1959 (93F) second and 1964 (92F) third _82F ____ Sep 29 ___ 1921 (86F) ____ 1945 (88F) ____ tied by 1891 _80F ____ Oct 6 ____ 1910 (84F) ____ 1941 (90F) _77F ____ Oct 13 ___ 1928 (78F) ____ 1954 (87F) _71F ____ Oct 20 ___ 1916 (77F) ____ 1947, 69 (80F) ____ later tied by 1905, 1906 _74F ____ Oct 21 ___ 1914 (77F) ____ 1920 (84F) _76F ____ Oct 22 ___ 1914 (76F) ____ 1979 (88F) _58F ____ Dec 7 ____ 1932 (63F) ____ 1998 (75F) ____ tied 1879, later tied by 1911 Record high minima (count 18.0 for starter era, count at end of data 2.83). _36F ____ Jan 31 ____ 1906 (39F) ____ 1913 (43F) ___ also 41F in 1988 and 40F in 2001. _42F ____ Feb 6 ____ eventual record high minimum later tied by 1938 .. 1915, 1991, 2008 t-3rd (41F). _38F ____ Feb 19 ___ 1909 (42F) ____ 2017 (53F) ___ 1981, 97 t-2nd (49F). _45F ____ Mar 24 ___ 1903 (52F) ____ 1903 (52F) ___ 1953, 79 t-2nd (51F), 1913,47,2000 t-4th (48F). _40F ____ Mar 25 ___ 1903 (41F) ____ 1913 (61F) ___ 1905 45F and 1910 52F brief record holders, 1928,87,2000 50F. _68F ____ May 23 ___ 1941 (69F) ____ 1941,80 (69F) __ 1884 now tied 3rd warmest with 2021 (68F). _70F ____ May 24 ___ eventual record high minimum later tied by 1902, 1964.. 1880, 1908, 1980 t-4th (68F). _76F ____ Aug 21 ___ 1906 (78F) ____ 1906 (78F) ___ 1937 2nd (77F), 1884 now tied 3rd with 2005 (76F). _74F ____ Sep 8 ____ 1919 (75F) ____ 2015 (76F) ___ 1884 now t-3rd with 1985 (74F). _77F ____ Sep 9 ___ eventual record high minimum .. 2015 2nd (76F), 2016 3rd (75F), 1959 4th (74F), 1971 5th (73F). _77F ____ Sep 10 __ eventual record high minimum .. 1895, 1996, 2016 t-2nd (74F), 1897,1945,59,89,2007,20 t-5 (73F). _77F ____ Sep 11 ___ 1983 (78F) ___ 1983 (78F) ___ 1884 now t-2nd with 2013 (77F), 1931 4th (75F), 1900 5th (74F). _70F ____ Sep 29 ___ 1959 (72F) ___ 1959, 2015 (72F) __ later tied by 1901, 1979 3rd (71F), 1884, 1901 t-4th (70F). _68F ____ Sep 30 ___ 1959 (70F) ___ 1959 (70F) ___ 1986, 2010 t-2nd (69F), 1884 4th (68F). _65F ____ Oct 12 ___ 1954 (67F) ___ 1954 (67F) ___ 1884 tied by 1949,83 t-3rd, 1990 2nd (66F). _59F ____ Oct 21 ___ 1947 (64F) ___ 1947,79 (64F) __ 1884 t-4th with 1906,15 and 2020. 21 .. 1984 3rd (62F). _52F ____ Dec 7 ____ 1951,56 (53F) __2022 (54F) _ 1884 t-4th with 1932 ... 1879, 1998 t-6th (50F). _49F ____ Dec 31 ___ 1965 (51F) ___ 1965 (51F) ___ 1884 2nd (49F), 2011 3rd (46F), 1992 4th (45F). Summary: 18 records set, the average year breaking 14 of these is 1936, would change to 1971 if four remaining records broken in 2022. The average eventual surplus for the 14 broken is 5.0 F deg which reduces to 3.9 F for all eighteen. _____________________________________________________________________ 1885 _ Another very cold year, in particular Feb-Mar. There were ten record highs set, with a count of 7.25 as of 1900, from four ordinary ties and one four-way tie among those. None survived to the present time. One record (Apr 22) may be somewhat invalid as 1842 was likely warmer (it hit 90F at Toronto and 80F at Providence RI). The average of years that broke these records was 1926. The average surplus of eventual record highs was 7.3 F deg. The extinction date for 1885 record highs was July 25th, 1987. The year established 8 record low maxima surviving to present time, with the count 6.33. The interval Mar 17 to 23 had four of these with maximum readings as low as 21F during a week of below-freezing temperatures (normal highs near 50F by this time). The count of record lows in the starter era was 18.33 (fourth highest and also fourth all-time) and there were eight surviving record low minima, with three ties for a count of 6.50. Mar 21 had 10F. One high minimum record (80F on July 25) survives from a rather small starter count of 8.917. Record high maxima (count 7.25, extinction date July 25, 1987). Temp ___ date _____ broken _____ eventual end of data record max _59F ____ Jan 1 ____ 1919 (61F) ___ 1966 (62F) _81F ____ Apr 22 __ 1902 (84F) ___1962,73,2001 (86F) ___ tied by 1886 _87F ____ May 19 __ 1903 (88F) ___ 1962 (99F) _97F ____ July 17 ___ 1953 (100F) __ 1953 (100F) ___ tied by 1900 __ 1955, 1968, 1999 hit 98F _99F ____ July 21 ___ 1926 (100F) __ 1977 (104F) ___ 1957, 1980, 1991 hit 102F, 1957 100F _92F ____ July 22 ___ 1918 (98F) ___ 2011 (104F) _94F ____ July 25 ___ 1987 (95F) ___ 1999 (97F) ____ tied 1873, later tied by 1944 _89F ____ Aug 1 ____ 1911 (92F) ___ 1933 (100F) ___ tied 1873, 1879, and later by 1887 _69F ____ Nov 7 ____ 1938 (78F) ___ 1938 (78F) ____ now 7th warmest (2022 77F, 2020 74F, 2015 72F, 1975 71F, 1965 70F) _60F ____ Dec 10 ___ 1911 (61F) ___ 1946 (70F) _____ tied 1878 Record High Minima (count 8.917 for starter era, count 1.0 at end of data) _59F ___Apr 22 ___ 1926 (60F) ___ 2016 (62F) ___ 1926 tied 1977 t-2nd (60F), 1885 t4th with 1974 (59F). _58F ___Apr 24 ___ 1979 (59F) ___ 2008 (63F) ___ tied by 1869 (count 0.5), and later by 1913 (also 58F 2007). _76F ___ July 9 ____ 1905 (78F) ___ 1981 (80F) __ tied by 1876 and 1878, starter era count 0.333 _75F ___July 21 ___ 1906 (76F) ___ 1980 (82F) __ tied by 1895,96,98 _ 77F 1930, 78F 1940,49,77 also records before 1980. _78F ___July 22 ___ 1957 (80F) ___ 2011 (84F) __ tied by 1926, and non record 1978, 1998. (all t-3rd). _80F ___July 25 ___ eventual record high minimum .. 1910 2nd (79F), 1870 3rd (78F), 1896,1965,87,95,99 t-4th (77F). _76F ___Aug 13 ___ 1905 (77F) ___ 1908 (82F) ___ tied by 1896 (count 0.5), 2016 2nd (81F), 2002,05 t-3rd (80F), 1988 5th (79F). _75F ___Aug 22 ___ 1906 (78F) ___ 1906 (78F) ___ 1916,42 t-2nd (77F), 2003 4th (76F), 1885t1891,99 (count 0.33) (t-5th). _60F ___Oct 20 ___ 1906 (61F) ___1916,84 (65F)__1910 3rd (64F). 1915, 2016 4th (62F), 1906,53,79 t6th (61F). 1885,1947,94 t9th (60F). _58F ___Nov 6 ____ 1938 (64F) ___ 2015, 2022 (66F) ___ 1948,94 t-3rd (61F). 1885 5th (58F). _60F ___Nov 7 ____ 1938 (63F) ___ 1938 (63F) ___ 1885 2nd (60F), 1912 3rd (59F), 2008 4th (58F). Summary: 11 records set, for the ten broken the average year is 1926, changes to 1935 if remaining record broken in 2022. The average eventual surplus for the ten records replaced is 5.0 F deg which reduces to 4.5 F counting the surviving record. _________________________________________________ 1886 _ This year managed to produce 16 record highs in the starter era (1869-1900) and a count of 13.83 from three ordinary ties and one three-way tie among those. All have been broken eventually. The average for years breaking these records was 1928, and the eventual margin of final record highs over them was 10.4 deg. The extinction date for 1886 record highs was Apr 24th, 2001. The year produced eight record low maxima of which one was later tied three times, for a count of 7.25. From a healthy count of 16.33 in the starter era, there were nine record low minima which survived to end of the data, with three ties and two more three-way ties, for a count of 6.17, and also the year's lowest temperature of -4 on Feb 5 fell to -6 on that date in 1918. There were no record high minima, in the prolonged April warm spell the closest reading to eventual record high minima was 58 (Apr 22) which had already been surpassed by 59 in 1885 and eventually also by 60F in 1926, 1977 and the record 62F in 2016. There had been only 5.25 record high minima in the starter era. Record high maxima (count 13.83, extinction date Apr 24, 2001) Temp ___ date _____ broken _____ eventual end of data record max _60F ____ Mar 16 ___ 1913 (63F) ___ 1990 (82F) _62F ____ Mar 31 ___ 1905 (70F) ___ 1998 (86F) _81F ____ Apr 19 ___ 1914 (82F) ___ 1976 (92F) _81F ____ Apr 22 ___ 1902 (84F) ___ 1962, 73, 2001 (86F) ____ tied 1885 __ 1842 before data likely warmer _84F ____ Apr 23 ___ 1996 (85F) ___ 2007 (86F) ____ later tied by 1925, now tied third warmest for date _83F ____ Apr 24 ___ 2001 (87F) ___ 2001 (87F) ____ second warmest on Apr 24 (1957,1992 81F tied third). _81F ____ May 5 ____1919 (88F) ____ 1949, 55, 80 (90F) _84F ____ May 22 ___1911 (86F) ___ 1941 (96F) ____ later tied by 1903 _86F ____ May 23 ___1925 (91F) ___ 1964 (94F) ____ later tied by 1902 _94F ____ July 30 ___ 1913 (95F) ___ 1917, 33, 40, 88 (98F) _90F ____ Aug 28 ___ 1948 (100F) __ 1948 (100F) ___ then frequent warmer days than 1886 incl 98F 1953, 73. _87F ____ Sep 17 ___ 1915 (91F) ___ 1991 (93F) _78F ____ Oct 12 ___ 1928 (86F) ___ 1928, 54 (86F) ____ tied 1880 _67F ____ Nov 3 ____ 1903 (68F) ___ 2003 (79F) ____ tied 1876 and then tied by 1892 _64F ____ Nov 18 ___ 1906 (65F) ___ 1921, 28 (73F) ____ tied by 1890 _64F ____ Nov 24 ___ 1931 (68F) ___ 1979 (73F) ____ recent max also 69F in 2014 Record high minima (starter era count 5.25, none survived to end of data, extinction date Apr 13, 1945). _46F ____ Mar 26 ___ 1913 (47F) ___ 1986, 2021 (52F) __ 1946 3rd (51F). 2000 4th (50F), 1921,87 t-5th (49F). _41F ____ Mar 30 ___ 1902 (48F) ___ 1998 (59F) __ tied by 1871, 1897, 1898, count 0.25 for starter era. _47F ____ Mar 31 ___ 1910 (48F) ___ 1998 (66F) __ 1886 t1905, 1986 2nd (60F), 1962,81 t-3rd (57F), 1945,60 t-5th (51F). _49F ____ Apr 1 _____ 1918 (51F) ___ 2016 (61F) __ 1986, 2008 t-2nd (54F), 2006 4th (53F), 1948,52,99 t-5th (52F). _53F ____ Apr 13 ____ 1945 (61F) ___ 2023 (67F) __ 1977, 2018 t-3rd (60F), 2019 5th (59F). 2002,06 t-6th (55F). _53F ____ Nov 3 _____ 1936 (64F) ___ 1936 (64F) __ 1886 tied 1909, 35. ... 1982 2nd (62F), 2003 3rd (60F). Summary: 6 records were set, the average year breaking these was 1920. The average eventual surplus was 12.3 F deg. ____________________________________________________________________ 1887 _ This year was near average for the starter era producing 11 record highs, 8 exclusively held, two tied and one four-way tie (count 9.25). A reading of 96F on July 16th was not a starter record (98F 1879) but was warmer than many others in July during that period. 79F on April 10 had been edged out previously by 80F in 1871. These records have all been broken with the average date of that being 1923. The average surplus of the eventual record high was 10.6 deg. The extinction date for 1887 record highs was Jan 29th, 1975. Only four eventual record low maxima come from 1887 and one was a three-way tie eventually, so the count is now 3.33. That is higher than a long-term average but lower than the period average. The 29F max on March 29th is a late season benchmark although 30F on April 7, 1982 was close and forms the next benchmark (latest so cold in spring or perhaps end of winter). Once again this year produced a healthy crop of starter record low minima (16.17). There were five surviving record lows, one tied, making the count 4.50. These were mostly in the autumn, after one on March 30th (16F). One record high minimum occurred on Dec 14 (53F) -- the high on same date only 58F and not close to the starter and eventual period of data record of 64F (1879). I would picture this being a foggy of hazy sort of very late autumnal day with the next day a bit cooler and wet (0.70" rain). This surviving record is one of only three that existed for the starter era; this was a lower count than all starter years except 1872 and 1873 (2.0 each). Record high maxima (count 9.25, extinction date Jan 29, 1975) Temp ___ date _____ broken _____ eventual end of data record max _53F ____ Jan 29 ___ 1975 (55F) ___ 2002 (69F) ___ second warmest after 1975, tied by 1950 at that point, now tied third also with 2006. _63F ____ Feb 11 ___ 1960 (65F) ___ 1960, 2009 (65F) ___ remains third warmest of date, 2018 (62F) fourth. _52F ____ Feb 19 ___ 1930 (57F) ___ 1997 (66F) ____ tied later by 1909 _78F ____ Apr 11 ___ 1922 (80F) ___ 1955 (84F) ____ recent 2011 (81F) and 2017 (80F) pushed 1887 to fifth. _87F ____ May 20 ___ 1903 (89F) ___ 1996 (96F) ____ tied 1877 _89F ____ May 21 ___ 1912 (89F) ___ 1996 (93F) _89F ____ Aug 1 ____ 1911 (92F) ___ 1933 (100F) ___ tied 1873, 1879, and 1885. _77F ____ Oct 7 _____ 1912 (81F) ___ 1944 (88F) _76F ____ Oct 10 ____ 1912 (78F) ___ 1939 (91F) ___ tied later by 1909 _64F ____ Nov 4 _____ 1903 (70F) ___ 1975 (78F) _50F ____ Dec 28 ____ 1904 (51F) ___ 1982, 2008 (65F) ____ tied 1874 Record high minima (starter era count 3.00, one survived to end of data). _65F ____ May 21 ___ 1903 (67F) ___ 1959 (71F) ___ 1978, 1996 t-2nd (69F), 1975, 2013 t-4th (68F). _76F ____ July 23 ____ 1906 (80F) ___ 2011 (83F) ___ 1978 2nd (81F), 1906, 2016 t-3rd (80F). _53F ____ Dec 11 ____eventual record high minimum .. __ 1897 2nd (51F), 2015 3rd (50F). Summary: There were three records set, the average of years breaking two of them is around New Years 1905. This changes to 1943 if the surviving record is broken in 2022. The two records were broken by an average of 6.5 F deg, the average is reduced to 4.3 F deg counting the surviving record. __________________________________________________ 1888 _ The year started out rather cold and returned to that pattern in the early autumn, but other parts of the year were somewhat warmer. A total of 11 record highs were set in the starter era (1869-1900) and two were ties for a count of 10.0. Two of these records (in June) survived to 2025 as eventual ultimate records, one was tied and one broken. The now ten that have been broken were first passed by 1938 on average, but if the one tied June record fall in 2026, that would change to 1945. The average surplus of eventual record highs to these ten broken would be 7.2 F deg, which falls to 6.5 F if the one unbroken (now tied) mark is included. This year was most famous for the "Blizzard of 1888" (March 12-13) which dropped 19.5" at NYC and 30-50 inches in the regions north of the city. That had an impact on temperatures for the rest of March. The year set a total of 14 low maxima, one tied with another later year, and another tied with two, for a count of 12.83 which falls just short of the coldest year 1875 (16 records, count 13.33). One of these was 12F at the end of the Blizzard (March 13th). Another cold spell later included a max of 20F on March 23rd which is a late season benchmark. There were early cold benchmarks set in October (47F max 3rd, 43F max 9th). It was also record cold in the CET records at around this time, and rebounded to record warmth in late October which was also similar (Nov 1 for NYC). The year had by far more record low minima than any other year, starter era or all time, with the count 37.17 even by 1900, and of those, 17 record low minima have survived, with the count 12.75 (three ordinary ties, three three-way ties, one four-way tie) which falls to second behind the 14.5 of 1875. At the end of the Blizzard, three record lows were set, 6F on March 13th was second coldest for the month. It had already been very cold at times in the preceding winter, with zero F on Jan 22 and 1F on Feb 16 setting records. Later in March it was 12 on March 24. In the autumn, 46F on Sept 7 was an early season benchmark, and a total of five more record lows were set in early October (35F on 10th). The year also had two surviving record high minima, 77F on June 23rd (second highest for the date is 76F in 1909, 1910 and 2017), and 50F on Dec 17 was tied in 2015, for a count of 1.50 high minima from a starter era count of only 5.0 (valid to June 24, 2025) ... the count is now 0.5 surviving. Record high maxima (count 10.0, count at end of 2025 was 0.5) Temp ___ date _____ broken _____ eventual end of data record max _83F ____ Apr 29 ____1951 (84F) ___ 1974 (89F) _90F ____ June 18 ___ 1905 (91F) ___ 1929 (95F) ___ recent max is 1994 (92F) _93F ____ June 22 ___ 1921 (95F) ___ 1988 (98F) ___ the 1888 reading now fifth, 1941 (96F) second and 1943 (94F) fourth. _96F ____ June 23 ____ eventual record tied 2025 .. (third warmest 1966 (94F), fourth warmest 1965 (93F)). _96F ____ June 24 ___ 2025 (99F) ___ 2025 (99F) .. (third warmest tied 1908, 1966 (94F), fifth tied 1975, 2003 (93F)). _94F ____ Aug 4 _____ 1936 (95F) ___ 1944 (100F) ____ later tied by 1928 ___ more recently 96F (1993,95). _94F ____ Aug 16 ____ 1938 (95F) ___ 1944 (96F) ____ remains third warmest for date (93 F 1970,97,2002,15 highest since 1944). _69F ____ Nov 1 _____ 1915 (71F) ___ 1950 (84F) ____ tied 1882 ___ 72F on Nov 2, 1888 was not a record, 73F in 1876. _68F ____ Nov 6 _____ 1938 (70F) ___ 2024 (80F) _ also 2022 (75F), 1948, 2015 (74F) _55F ____ Dec 17 ___ 1924 (57F) ___ 2000 (62F) ____ tied by 1894 _52F ____ Dec 18 ___ 1915 (57F) ___ 1937, 84 (63F) Record high minima (starter era count 5.00, count at end of data 0.50). _36F ____ Feb 5 ___ 1909 (37F) ___ 1991 (51F) ___ 2019 2nd (44F), 1943 3rd (43F). 1888 t1896 (count 0.50). _59F ____ Apr 29 __ 1956 (63F) ___ 2017 (64F) ___ 1956t1983, 2024 t2nd (63F), 1957 4th (62F), 1888 tied by 1941. _77F ____ June 23 __ 2025 (80F) ___ 2025 (80F) ___ 1909, 1910, 2017 t-3rd (76F); 2015 6th (75F). _74F ___ Jun 24 ___ 1909 (79F) ___ 2025 (81F) __ tied 1870, count 0.5; 2010 3rd (76F), 1966, 2002 t-4th (75F). _77F ___ Aug 17 ___ 1978 (78F) __ 1978, 2015 (78F) __ 1888, 1995, 2016 t-3rd (77F), 1895, 1901, 38, 44 t-6th (76F). _50F ___ Dec 17 ___ eventual record high minimum later tied by 2015 .. 1928, 1984 t-3rd (48F). Summary: There were six records set, the average year to break five of these was 1955. That would change to 1967 if the remaining tied record were broken in 2025. The four records broken had an eventual average surplus of 6.2 F deg which reduces to 5.2 F deg counting the one unbroken. ______________________________________________________________________ 1889 _ Another famous weather event occurred at the end of May 1889, the Johnstown PA flood from excessive rainfalls but this had no direct impact on the NYC records. The temperatures reflected a rather active storm track at several times during the year (there was also a tornadic wind event in the northeastern states that did damage in Brooklyn NY on January 9th, 1889 -- the maximum temperature at NYC was 54, two degrees below the starter record high from 1876). There was a very mild December to start the generally very mild winter of 1889-90. The year 1889 set 10 record highs, one being an ordinary tie and another a three-way tie eventually, so the count was 8.83 by 1900 (it was 9.5 at end of the year as ties were mainly later in the starter era). None of these records managed to survive (one made it as far as Dec 2015). The average year breaking these records was 1932. The average eventual margin of the record highs was 10.1 F deg. The extinction date for 1889 record highs was Dec 25th, 2015 (that one was tied by 1982). The maximum for the year was only 91F (tied with 1884 and 2004 as second lowest annual maximum, 1902 topped out at 90F) but it first appeared on May 10th which fell one degree short of the 1896 mark so it was a daily record for seven years (not counted in this analysis). The year also set four record low maxima (untied, count 4.00). Three of these were in the late autumn. From a relatively weak count of 5.33 starter low minima, there were only two (untied) surviving record lows (count 2.00) and no record high minima for 1889. 45F on Jan 17th was tied in 1913 and beaten by 46F in 1990, similar to how the day's maximum was treated. The very warm May and then mild December spells came within a few degrees also. The year had a count of 9.0 record high minima in the starter era. Record high maxima (count 8.83, extinction date Dec 25, 2015) Temp ___ date _____ broken _____ eventual end of data record max _57F ____ Jan 17 ___ 1913 (60F) ___ 1990 (63F) ____ fourth warmest, 1913 was later tied by 1973. _60F ____ Mar 23 ___1902 (64F) __ 1923, 2012 (76F) ___ tied 1878, and later by 1897. _61F ____ Mar 24 ___ 1903 (66F) __ 1988 (76F) _68F ____ Apr 12 ___ 1945 (73F) __ 1977 (90F) _78F ____ Apr 21 ___ 1923 (87F) __ 1923 (87F) ___ tied later by 1921, four years after 1923 have broken 80F. _90F ____ June 9 ___ 1933 (97F) __ 1933 (97F) ___ five later years have been above 94F, incl two at 96F (1984,2008). _60F ____ Dec 9 ____ 1946 (61F) __ 1966 (66F) ___ later tied by 1924 _64F ____ Dec 25 ___ 2015 (66F) __ 2015 (66F) ___ was tied by 1982, remains tied second warmest (62F 1940, 2014 t4th). _62F ____ Dec 26 ___ 1936 (63F) __ 1936,82 (63F) ___ remains third warmest for date, fourth is tied 1895, 1964 (60F). _53F ____ Dec 29 ___ 1901 (55F) __ 1984 (70F) ____ tied by 1891 Record high minima (starter era count 9.0, count at end of data 0.00, extinction date Jan 17, 1990). _45F ___ Jan 17 ___ 1990 (46F) ___ 1990 (46F) ___ 1889 t2nd with 1913; .. 1876, 1933, 1949, 1995 t4th (42F). _55F ___ Apr 12 ___ 1947 (58F) ___ 2023 (64F) ___ 1947, 2017 t-2nd (58F), 1945 4th (57F), 1948 5th (56F), 1889, 1996 t6th (55F). _59F ___ May 6 ____ 1909 (61F) ___ 1930 (71F) ___ 1934, 2000 t-2nd (68F), 1949 4th (63 F), 1993 5th (62F). _65F ___ May 19 ___1903 (67F) __ 1986 (68F) __ tied by 1877, count 0.5 for starter era. 1911, 2017 t3rd (66F) _70F ___ June 10 ___ 1906 (71F) __ 1984 (79F) __1959 2nd (75F), 1974 3rd (74F). _69F ___ Sep 14 ____ 1903 (72F) ___ 1947 (74F) __ 1915 2nd (73F), 1903,31,61 t-3rd (72F). _70F ___ Sep 15 ____ 1901 (72F) ___ 1931, 2005 (75F) __ 1915 3rd (74F), 1903 4th (73F). 1889 t 1896 (count 0.5) _72F ___ Sep 16 ____ 1903 (73F) ___ 1903, 2005 (73F) __ 1889 t-3rd with 1915, 1930 (72F). _48F ___ Dec 9 _____ 1966 (54F) ___ 1966 (54F) ___ 1889 t-2nd with 1923 (48F) .. 1938 4th (46F) _40F ___ Dec 18 ____ 1912 (43F) ___ 1996 (47F) ___ 2006 2nd (44F); .. 1912 t-3rd with 1984. Summary: Ten records were set, the average year breaking these was 1924. The average eventual surplus was 5.2 F deg . _______________________________________________________ 1890 _ After a very mild winter the rest of the year settled into a more moderate warmth with occasional cold spells. While Britain had a very cold December, the weather in NYC was near normal. The year had 18 record highs in the starter era (1869-90), with two ties the count was 17.00. More than half of these were before mid-March. November brought three more. Two remain as eventual records, one has been tied so the count for that is 1.50, a survival rate of 8.8%. The average of years breaking the 16 broken records is 1938. Counting the one now tied, 17 records have not maintained a lead past an average date of 1942. If the two records were to fall in 2022, that average would change to 1947. As noted below, Jan 2 (63F) was of starter record calibre but had already lost to 1876 (the eventual record) for that date. 1890 is the first year in our study not to retain any record low maxima. 70 on July 20th was one degree warmer than the 1869 record. 69 on Aug 10th was a record until 68 in 1931 (later tied and the eventual record). Seven dates managed to retain record low minimum status, two tied later (count 6.00). As the year only produced a count of 7.83 in its day, this was a high survival rate (76.6%, second highest to 100% in 1891 among starter era years). There were five consecutive record lows from July 19-23 and of those the last four have survived (the last two both tied by 1871). The year also set two high minima, one later tied in 1911 and 2023, for a count of 1.33, from a starter era total of 9.50, giving a survival rate of 14.0%. Record high maxima (count 17.0, count at end of 2021 was 1.50) Temp ___ date _____ broken _____ eventual end of data record max _57F ____ Jan 6 ___ 1913 (58F) ___ 2007 (72F) ____ also 63F on Jan 2, but 1876 had 68F that date. _64F ____ Jan12 ___ 2017 (66F) ___ 2020 (68F) ____ remains third warmest Jan 12th (63F 1913 fourth). _64F ____ Jan 13 ___ 1932 (68F) ___ 1932 (68F) ____ remains second warmest Jan 13th (62F 1972, 2017 tied third) _55F ____ Jan 16 ___ 1924 (57F) ___ 1995 (58F) ____ now tied fifth warmest Jan 16th (1953 also 57F, 1943 56F) _68F ____ Feb 5 ____ 1991 (70F) ___ 1991 (70F) ____ second warmest Feb 5th (third warmest now 65F 2019). _55F ____ Feb 8 ____ 1933 (60F) ___ 2017 (62F) ____ now sixth warmest, second is 1965 (61F), t4th 58F 1990, 2009. _64F ____ Feb 18 ___ 1981 (68F) ___ 1981 (68F) ____ now tied third warmest with 2008, 67F 2011 (1891-1980 max 60F 1938). _65F ____ Feb 26 ____ eventual record .. (second warmest tied 1951, 1976 (62F), recent warmest 58F 1998, 2002). _72F ____ Mar 12 ____ eventual record tied later by 2012 .. (3rd 2021 68F, 4th 1929 67F, 5th warmest 1902 66F). _63F ___ Mar 13 ____ 1902 (67F) ___ 1990 (85F) _79F ___ Apr 13 ____ 1945 (81F) ___ 2023 (90F) ___ 1977 2nd 88F, 1968, 2018 t-3rd 82F, 1945 4th 81F _98F ___ July 8 _____ 1993 (100F) __ 1993 (100F) ___ later tied in 1937, remains t2nd warmest (97F 1936,88 are t4th). _94F ___ July 31 ____ 1916 (95F) ___ 1933 (102F) _90F ___ Aug 17 ____ 1913 (90F) ___ 1944, 2015 (95F) _83F ___ Sep 13 ____ 1903 (86F) ___ 1952 (94F) _69F ___ Nov 8 _____ 1938 (71F) ___ 1975 (76F) ____ 2020 had 75F on this date. 1945 (72F) is third warmest. _64F ____Nov 18 ___ 1906 (65F) ___ 1921, 28 (73F) ____ tied 1886 _59F ____Nov 25 ___ 1908 (60F) ___ 1979 (73F) ____ tied by 1895 and later also by 1905. Record high minima (starter era count 9.50, count at end of data 1.33) _49F ___ Jan 2 ___ eventual record high minimum later tied by 1911, 2023 .. 1930 3rd (48F), 1876 4th (46F), 2000 5th (43F). _50F ___ Jan 6 ___ 1946 (53F) ___ 2007 (54F) ___ 1890 3rd (50F), 1950 4th (45F). _38F ___ Feb 3 ___ 1983 (45F) ___ 1996, 2006 (46F) __ 1890 t1877, 1983 3rd (45F), 2012 4th (42F), 1991 5th (40F). _41F ___ Feb 4 ___ 1991 (46F) ___ 1991 (46F) __ 2016 2nd (44F), 2006,20 t-3rd (43F), 1890 t-5th with 2019 (41F). _43F ___ Feb 26 __ 1951 (46F) ___ 1976 (49F) ___ tied by 1880, count for starter era 0.5. 1957 2nd (48F). _37F ___ Feb 27 __ 1902 (42F) ___ 1976 (49F) ___ 1997 2nd (47F), 1971 3rd (44F), 2009 4th (43F), 1902t1953 t-4th (42F). _42F ___ Mar 21 __ 1903 (55F) ___ 2012 (57F) ___ 1890 tied by 1894 (count 0.5); 1938 3rd (54F), 2010 4th (51F). _77F ___ July 31 __ 1917 (82F) ___ 1917 (82F) ___ 1933 2nd (78F), 1890 3rd (77F), 1898,1908 t-4th (76F) none since 1933 >75F. _75F ___ Aug 1 ___ 1904 (77F) ___ 1917 (82F) ___ 1999, 2006 t-2nd (79F), 1979 4th (78F), 1904,44 t-5th (77F). _75F ___ Aug 4 ___ 1906 (77F) ___ 1908, 2005 (78F) __ 1906,28,79,83,95,2002 t-3rd(77F). 1926,88,2006 t-9th (76F). _75F ___ Sep 6 ___ 1910 (77F) ___ 1985 (78F) ___ 1890 tied 1880 (count 0.5), 1910 t-2nd 1983 (77F). 1979 4th (76F). _75F ___ Sep 13 ___ eventual record high minimum .. 1906,47,61 t-2nd (74F), 1925,57 t-5th (72F), 1952, 2005 t-7th (71F). Summary: 12 records set, the average for the year breaking ten of these is 1931. If the two surviving records were broken in 2022 this would change to 1945. The ten records broken have an average eventual surplus of 6.8 F deg which reduces to 5.7 F if the two surviving records are counted. _____________________________ DUE TO SPACE LIMITATIONS FOR EDITING, ANY LOGS of LOW MAX, MIN will appear in separate posts during 2022. ======================= The decade of 1891 to 1900 set almost 40% of the starter high maximum records with a count of 141.25, and it retained 16.91 as eventual records counting ties as .50, .33 or .25 .. while a random expectation for that is 24.1, the decade did a lot better than the two previous which only retained 11 and 8.5 respectively (10 in total were 1880-81). The non-decade of 1869-70 retained no records to the end. So either there was some natural warming of climate in the 1890s to 1900, or the urban heat island began to assist some formerly marginal cases to break records -- it was probably a combination. The years 1895 and 1900 did particularly well at retaining record highs, while 1896 and 1898 set quite a few but failed to retain most of them to the end of the data period (which is today because I am always editing these posts when NYC breaks records). 1891 _ This year was often quite warm, especially the summer and autumn into December, and produced 19 record highs of which two were tied once, and two more tied twice in the starter era (1869-1900) for a count of 16.67. Of these, five still survive, two have been tied twice since then and another tied once for a count of 3.33. The survival rate is therefore 20% (3.33/16.67), although 26.3% of the original records are still at least tied records now. The average year for breaking 14 of the 1891 records would be 1926, while if all five fell later this year the average would become 1951. The average surplus of eventual record highs compared to the 1891 values is 11.1 F deg but this would fall to 8.2 if the five sustained records were included. The year also produced five record low maxima. One was tied twice, and another tied once, for a count of 3.83. 43F on May 5 is a benchmark low maximum (latest so cold in spring) with 45F also, on May 6. There were four (all untied) record low minima during the year, 32F on May 6 is another benchmark and the latest air frost in the spring season at NYC. this was a survival rate of 100% (the first before 1910 matched it) for record low minima, so the count for a starter era year of 4.0 was rather low. Meanwhile there were four record high minima. 78F on June 16 (warmest since 76F in 1957), 81F on Aug 11 (tied in 1896), 76F on Aug 24 and 72F on Sep 28, for a count of 3.50, which came from the original count of 11.833 in the starter era; this was a survival rate of 29.6%. Dec 23rd had 51 (eventual record high minimum 56F 1990). Record high maxima (count 16.67, count at end of 2021 was 3.33) Temp ___ date _____ broken _____ eventual end of data record max _51F ____ Jan 11 ___ 1913 (56F) ___ 2020 (69F) _53F ____ Jan 22 ___ 1906 (60F) ___ 1916,59 (61F) ____ later tied by 1904 _54F ____ Feb 16 ___ 1921 (62F) ___ 1954 (71F) _59F ____ Feb 17 ___ 1976 (67F) ___ 2022 (68F) ____ 1891 now fifth behind third 2011 (63F) and fourth 1981 (62F). _56F ____ Feb 25 ___ 1912 (59F) ___ 1930 (75F) ____ also 70F (1976) and 67F (1985), 63F 2017 warmest recently. _78F ____ Apr 27 ___ 1915 (92F) ___ 1915 (92F) ____ also 91F (1962) and more recently 84F (1969, 2009) _96F ____ June 15 ____ eventual record tied later by 1988, 1994 .. (tied fourth warmest 94F 1956, 87). _97F ____ June 16 ____ eventual record .. (second warmest 1967 (96F), third warmest 1957 (95F), fourth 1991 (94F)). _91F ___ Jun 26 ___ 1909 (93F) __ 1952 (100F) ___ tied by 1876, 1880 and later 1901. _98F ____ Aug 10 ____ eventual record tied later by 1949 .. (tied third warmest 97F 1944, 2001). _91F ____ Sep 18 ____ eventual record .. (second warmest 1898 (90F), tied third warmest 1914, 65 (88F), fifth 2015 (87F)). _82F ____ Sep 29 ___ 1921 (86F) ___ 1945 (88F) ____ tied 1884 _84F ____ Oct 4 ____ 1941 (88F) ___ 1941 (88F) ____ now t4 warmest (1967, 1983, 2007) with 1959, 2013 (86F) t 2nd _86F ____ Oct 5 ____ 1922 (89F) ___ 1941 (94F) ____ remains 3rd warmest t1967, 5th is 1951 (84F), recent 83F in 2007,17. _55F ___ Dec 3 _____ 1912 (56F) __ 1998 (69F) ___ tied 1879 and later by 1899. _60F ___ Dec 16 ____ 1971 (61F) __ 1971 (61F) ___ remains second warmest Dec 16th, third is 59F (2011). _66F ____ Dec 23 ____ eventual record tied later by 1990 .. (1875, 2015, 2016 t3rd (64F), 1931 6th (63F), 1949 7th (62F), 2007 8th (61F)). _60F ___ Dec 24 ____ 1941 (61F) __ 2015 (72F) _53F ____ Dec 29 ___ 1901 (55F) __ 1984 (70F) ____ tied 1889 Record high minima (starter era count 11.833, count at end of data 3.50), _37F ___ Jan 29 __ 1903 (39F) ___ 2002 (50F) ___ 2006 2nd (44F); 1970 3rd (42F); 1950 t4th with 1974 (40F). _44F ___ Feb 17 __ 1981 (46F) __ 1981, 2011 (46F) __ 1891 t-3rd 1948 (44F), 1984 5th (42F). _48F ___ Feb 25 __ 1930 (51F) __ 1930 (51F) ___ 1891 2nd (48F), 1996 3rd (47F), 2020 4th (46F), 1961,85 t-5th (45F) _58F ___ Apr 23 __ 1926 (60F) __ 1926 (60F) ___ 2001 2nd (59F), 1891 t-3rd 1996, 2007 (58F), 1908,53,79,90,2019 t-6th (56F). _62F ___ May 1 ___ 2001 (63F) __ 2010 (64F) ___ 1891 3rd (62F), 1936 4th (61F); .. 1899, 1963 t-5th (60F). _78F ___ June 16 ___ eventual record high minimum .. 1957, 91 t-2nd (76F); .. 2004 4th (74F). _77F ___ July 17 __ 1995 (84F) __ 1995 (84F) ___ 2016 2nd (79F), 2013 3rd (78F) ... _ _ _ _ _ _ ______________________________________1891 t1896 (count 0.5) t-4th also 1997 (77F); .. 1872,1901,52,72,74 t-7th (76F). _81F ___ Aug 11 ___ eventual record high minimum tied by 1896 .. 1905 3rd (80F), 1900 4th (79F), 2020 5th (78F). _75F ___Aug 22 ___ 1906 (78F) ___ 1906 (78F) ___ 1916,42 t-2nd (77F), 2003 4th (76F), 1891t1885,99 (count 0.33) (t-5th) _76F __ Aug 24 ___ eventual record high minimum .. 1998,2020 t-2nd (75F); .. 1880,1898 t-4th (74F). _75F __ Aug 25 ___ 1961 (76F) ___ 1961, 98 (76F) __ 1891t1898 t-3rd also 1979 (75F). 1900,18,47,72,80 t-6th (74F). _70F __ Sep 24 ___ 1970 (74F) ___ 1970 (74F) ___ 1891 t 2011 t-2nd (70F); .. 1934,59,68,84,2017 t-4th (69F). _72F __ Sep 28 ___ eventual record high minimum .. 1881 2nd (71F); ..1908,59,2010 t-3rd (70F); ..1886,2020 t-6th (69F). _51F __ Dec 23 ___ 1990 (58F) ___ 1990 (58F) ___ 2015 2nd (52F), 1891 t1931 t-3rd (51F), 2006 5th (48F), 1875 6th (47F), 2003 7th (46F). Summary: 14 records were set, of the ten since broken, the average of years breaking the records was 1956. If the four surviving records were broken in 2022, then the average would become 1975. The average surplus of eventual records is 4.4 F deg. This reduces to 3.1 F counting the four surviving records. ____________________________________________________________________________ 1892 _ This was a somewhat colder year which produced 13 records, one tied twice, for a count of 12.33. Of those, two survive, one having been tied three times for a count of 1.25. This is a survival rate of 10.1% (15.4% in terms of surviving as at least a tie). The most significant warm spells were in early April which produced the one surviving untied record high, and late July. The average year breaking 1892 records was 1937. This would change to 1950 if the two surviving records were broken at the next opportunity. The average surplus of the eventual record high over the 1892 broken values is 5.9 F deg (the smallest so far in the series) which falls further to 5.0 if the two surviving records are included. The year produced only two low maxima that have survived and one is now a four-way tie for a count of 1.25. The year has one surviving record low, 57F on July 17th. Only one other record low was set, for a total of two in the starter era, the second lowest count to 1870 (1.33). The other record set was 46F for May 20th, broken in 1907, later tied 2002). There were three record high minima in the early April warm spell, 59F Apr 3 (tied 2015), 62F and 60F on 4th and 5th untied. Also June 20th set a high minimum of 76F. The count for four records is 3.50. A minimum of 78F on July 26 was broken by 79F in 1979. There were five other records since broken for a count of 10.0 in the starter era. The survival rate is 35%, one of the higher outcomes for years in the starter era. Record high maxima (count 12.33, count at end of 2021 was 1.25) Temp ___ date _____ broken _____ eventual end of data record max _59F ____ Jan 14 ___ 1932 (70F) ___ 1932 (70F) _____ more recent, 66F (2005), 64F (1937), 62F (1972). _75F ____ Apr 3 ____ 1967 (76F) ___ 1981 (81F) ____ later tied by 1945 (t4, 77F (2002) third warmest), _80F ____ Apr 4 ____ eventual record .. (second warmest 1921 (78F), tied third warmest 1950, 2010 (76F). _70F ____ Apr 5 ____ 1910 (75F) ___ 1928 (80F) _____ recent max is 77F (1989). _73F ____ Apr 6 ____ 1910 (76F) ___ 2023 (80F) ____ 1912,21,47 (79F) _ 2010 (78F). _95F ____ June 13 __ 1961 (96F) ___ 1961 (96F) ____ 1892 second warmest, recent max is 94F (2017, tied third with 1940,84) _94F ____ June 14 __ 1956 (99F) ___ 1956 (99F) ____ 1892 third warmest, 1988 (96F) is now second. _93F ____ June 17 __ 1952 (95F) ___ 1957 (96F) ____ tied later by 1939, 1945. Highest recent max is 91F (2018). _96F ____ July 26 ___ 1940 (98F) ___ 1940 (98F) ____ tied third with 1963, 1989, 2005 _ 1966 (97F) now second. _97F ____ July 28 ___ eventual record tied later by 1931, 1949, 1999 .. (fifth warmest 1993 (96F)). _97F ____ July 29 ___ 1949 (99F) ___ 1949 (99F) ____ 1892 second warmest , third is 96F, 2002 tied with 2005). _67F ____ Nov 3 ____ 1903 (68F) ___ 2003 (79F) ____ tied 1876 and 1886 _58F ___ Dec 8 _____ 1924 (61F) ___ 1927 (65F) ____ more recent, 64F (1951, 1980). Record High Minima (starter era count 10.0, count at end of data 3.50). _44F ___ Jan 14 ___ 1932 (55F) ___ 1932 (55F) ___ 1995 2nd (48F), 1892 t-3rd t 2014 (44F), 1937 5th (43F). _39F ___ Feb 8 ____ 1965 (48F) ___ 1965 (48F) ___ 1991, 2005 t-2nd (40F), 1892 4th (39F), 2009,17 t-5th (38F). _59F ___ Apr 3 ____ eventual record high minimum tied later by 2015 .. 2000 3rd (55F), 1903 4th (54F), 1981 5th (52F). _62F ___ Apr 4 ____ eventual record high minimum .. 1981 2nd (57F), 1997 3rd (56F), 1974,88 t-4th (53F). _60F ___ Apr 5 ____ eventual record high minimum .. 1910,2010 t-2nd (56F), 1921,81,88 t-4th (55F). _73F ___ June 17 __ 1945 (74F) ___ 1957 (77F) ___ 1945,67 t-2nd (74F), 1892,1905,44 t-4th (73F), 2000,04 t-7th (72F). _76F ___ June 20 __ eventual record high minimum ... 1896,1943,87 t-2nd (74F). 1908,64 t-5th (73F). _75F ___ June 21 __ 1923 (77F) ___ 2012 (79F) ___ 1923t1953 t-2nd (77F); .. 1964,88 t-4th (76F) 1892t2021 t-6th (75F). _78F ___ July 26 ___ 1979 (79F) ___ 1979 (79F) ___ 1870t1892 t-2nd (78F) (count 0.5); 1885,1995,2020 t-4th (77F). _77F ___ July 29 ___ 1995 (79F) ___ 1995,2002 (79F) __ 2015 3rd (78F), 1892,98, 2020 t-4th (77F). (count 0.5). _58F ___ Nov 16 ___ 2006 (59F) ___ 2006 (59F) ___ 1892t 1927 t-2nd (58F); .. 1928 4th (58F), 1960 5th (54F). Summary: There were eleven records, for the seven since broken, the average year breaking the 1892 record was 1963. Counting the four surviving records, if they were broken in 2022, the average would change to 1984. The seven records broken were eventually overtaken by an average surplus of 4.6 F deg. This would reduce to 2.9 F deg counting the four surviving records. ____________________________________________ 1893 _ This year turned quite cold in general, and produced only four starter highs for the period 1869-1900. Two were tied for a count of only 3.00, the lowest of the starter period and lower than all following years until tied in 1943, then most of the others also except for those which set no new records mostly late in the series, and 1957, 1960, 1968, 1981 and more frequent recent years (with one or two new records). The four records were broken on average by 1926, and the margin of the eventual record high was 5.75 deg. While not very prolific this year's few records were not really obliterated. There were also four low maximum records sustained to end of the data, with one tied (count 3.50). The extinction date for the record highs was Aug 25, 1943. This was second earliest in the starter era and fourth earliest overall (1877, 1909 and 1904 were earlier). With a starter era count of 12.5, there were six record minimum temperatures, three ordinary ties, and one three-way tie, and even a four-way tie (count 3.08). The most significant cold spell was in mid-January, a low of +1 on 16th tied in 2004. There were no record high minima in 1893 with a starter era count of only 2.833. Record high maxima (count 3.0, extinction date Aug 25, 1943) Temp ___ date _____ broken _____ eventual end of data record max _70F ____ Apr 1 ____ 1917 (83F) ___ 1917 (83F) _____ also broken by 82F (1978), 79F (2016) 75F (2006) and 74F (1918,1967), 73F 1929 et al. _90F ____ June 11 __ 1920 (94F) ___ 1973 (95F) _____ also 94F in 1984, 92F in 2000 ___ 1893 tied by 1894 _95F ____ June 20 __ 1923 (98F) ___ 1923 (98F) _____ now tied fourth with 1995, second is 97F (1931,53), fourth 96F (1987). _93F ____ Aug 25 ___ 1943 (94F) ___ 1948 (95F) _____ tied by 1900, currently they are tied fifth with 1968, t2 (94F) are 1943,69,93). Record high minima (starter era count 2.833, count at end of data 0.0, extinction date Feb 10, 1960.) _39F ___ Feb 10 ___ 1960 (41F) ___ 2024 (47F) __ also 2023 (45F), 1999 (43F), 2020 3rd (42F), _ _ _ _ _____________ ____ 1960 5th (41F), 1893 t1876,81 (count 0.33) later also 1925,56 (all t-6th)(39F). _76F ___ Aug 27 ___ 1948 (79F) ___ 1948 (79F) ___ 1893t1900 (count 0.5) and 1980 (all t-2nd, 76F), 1891,1933,1973,2021 t-5th (75F). _76F ___ Aug 28 ___ 1948 (78F) ___ 2018 (79F) ___ 1948 2nd (78F), 1973 3rd (77F), 1893 4th (76F), 1959 5th (75F). _59F ___ Oct 22 ___ 1920 (60F) ___ 1979 (67F) ___ 2020 2nd (64F); .. 1935,36,42,84 t-3rd (62F), 1929,49 t-7th (61F). Summary: 4 records set, the average year breaking them was 1944, and the average eventual surplus was 5.5 F deg. ___________________________________________ 1894 _ Although somewhat warmer again, 1894 only set a total of ten starter record highs, with four ties the count was 8.00. None of these survived to the end of the data set. One was tied before the end of the starter era in 1897 (Sept 11). The average year breaking these records was 1921. The margin of the eventual record highs averaged 8.3 F deg. There were nine record low maxima during the year, one ordinary tie, and one five-way tie, the count was 7.70. The extinction date for the record highs was Jan 24, 1967. Despite the high count of record low maxima, only three surviving low minima occurred, one being tied later for a count of just 2.50. However, the year did have 9.83 record low minima in the starter era, more similar to the eventual record low max count. There were no record high maxima surviving by end of the data. 46F on Mar 6 survived to 1979 (49F, eventually 50F by 2011). In the starter era 1894 had set ten high minima. Record high maxima (count 8.0, extinction date Jan 24, 1967) Temp ___ date _____ broken _____ eventual end of data record max _57F ____ Jan 24 ____ 1967 (68F) ___ 1967 (68F) ____ 1894 now fifth warmest, 1989 (61F), 1999 (60F), 2019 (59F). _62F ____ Mar 6 ____ 1921 (64F) ___ 1935 (68F) ____ 1894 now fourth warmest, 2004 had 63F now third. _65F ____ Mar 18 ___ 1905 (67F) ___ 1989, 2011 (77F) _63F ____ Mar 22 ___ 1911 (64F) ___ 2012 (78F) ____ 1894 later tied by 1907 _90F ____ June 11 __ 1920 (94F) ___ 1973 (95F) _____ also 94F in 1984, 92F in 2000 ___ tied 1893 _93F ____ July 13 ___ 1916 (94F) ___ 1966 (101F) ____ tied 1876. _93F ____ Sep 11 ___ 1931 (99F) ___ 1931,83 (99F) __ later tied by 1897, these t4th with 1989 (94F) 3rd. _84F ____ Sep 15 ___ 1901 (88F) ___ 1927 (92F) ____ 90F (1993) is recent max for date. _88F ____ Sep 16 ___ 1915 (93F) ___ 1915 (93F) ____ 92F (1991) is recent max for date, tying 1941,70 for second. _55F ____ Dec 17 ___ 1924 (57F) ___ 2000 (62F) ____ tied 1888. Record high minima (starter era count 10.5, count at end of data 0.0, extinction date Mar 6, 1979.) _41F ___ Jan 5 ___ 1909 (49F) ___ 2007 (53F) ___ 1950 3rd (48F), 1997 4th (43F), 1998 5th (42F), 1894t2019 t-6th (41F). _38F ___ Jan 24 __ 1909 (40F) ___ 1967 (54F) ___ 1953 2nd (49F), 2002 3rd (45F), 1969,1990,2012 t-4th (42F). _46F ___ Mar 6 ___1979 (49F) ___ 2011 (50F) __ 1894 3rd (46F), 1974 4th (44F), 1882,1935 t-5th (43F). _48F ___ Mar 19 __1945 (49F) ___ 2012 (55F) __ 1983 2nd (52F), 1945t2010 t3rd (49F), 1894t1898 t-5th (48F). (count 0.5). _42F ___ Mar 21 __1903 (55F) ___ 2012 (57F) ___ 1894 tied 1890 (count 0.5); 1938 3rd (54F), 2010 4th (51F) _45F ___ Mar 22 __1903 (46F) ___ 1948 (57F) ___ 2012 2nd (56F), 1938 3rd (54F), 1929 4th (52F), 2003 5th (51F). _58F ___ Apr 28 __ 1908 (59F) ___ 1990,2009 (69F) __ 1935,62,83 t-3rd (62F), 1969,2011 t-6th (61F), 1908,38 t-8th (59F). _ _ _ _ _ ____________________ _ _ _ _ _____________________ 1894 t 1869 (58F) (count 0.5). _56F ___ May 3 ___ 1913 (67F) ___ 2018 (70F) ___ 2001 2nd (68F), 1913t2010 t-3rd (67F). 1894t1880, 1910 (count 0.5). _64F ___ May 7 ___ 1918 (70F) ___ 1918,30 (70F) __ 1894 3rd (64F), 1874 4th (62F), 2000 5th (61F), 1993 6th (60F). _73F ___ June 18 __ 1905 (75F) ___ 1957, 2014 (76F) __ 1905 3rd (75F), 1962 4th (74F), 1894, 2018 t-5th (73F). _74F ___ June 27 __ 1943 (76F) ___ 1943 (76F) ___ 1999 2nd (75F), 1894 t 1901,09,53 t-3rd (74F). 1880 t-6th (73F)* _71F ___ Sep 17 ___ 1915 (72F) ___ 1991 (77F) ___ 1894t1898, 1905, 1907, 1930 (t-3rd) (count 0.5). _70F ___ Sep 19 ___ 1905 (73F) ___ 1906 (74F) ___ 1894 3rd (70F), 1882,1891,1904,1949,2016,2017 t-4th (69F). Summary: 13 records, the average year breaking them was 1919. The average surplus of eventual records was 8.6 F deg. * 1880 t-6th (June 27) with 2001,03,08,13 and 21 (all 73F). . ___________________________________________________________________ 1895 _ This was a highly variable year for temperatures, with some prolific heat waves at far ends of the summer season (late May, mid- September) but also a very cold February and early March. December also had a very mild second half. The year set a total of 24 record high maxima with four ties, a count of 22.00, second only to 1913 in terms of the number of records held at end of a year (under the starter period rules). As one of the ties came in 1897 the count was 22.50 until then. Nine days retain a share of an eventual record, with three ordinary ties and one three-way tie for a count of 6.83. This count was 8.83 until Nov 1975 and 7.83 until Dec 1984. This is a survival rate of 31.1% (33.3% of days not removed as at least tied). 1895 is now tied with 1966 in fifth place for the count of record highs. It has more than any year in the period 2002-20 (although several of those are close behind). There are two separate four-day consecutive record intervals (both with one or two eventual ties) and this is only surpassed by five in late August and early September of 1953, and was matched in 1925 although without any ties there. In 2001 there was a four-day spell of record highs but one was later broken. Longer spells have occurred before being partially broken later. For the 15 records now broken, the average year that first did so was 1935, but if all nine of the records fell later this year, that would change to 1968. For the 15 broken records the average eventual surplus is 6.9 F deg but this would change to 4.3 F deg if the nine sustained records were included. There were also three record low maxima in 1895, two in February and one in October, with one tie the count is 2.50. The year produced five record low minima, with two ties (1914, 1964) the count is 4.00. That came from only seven records with a count of 7.0 in the starter era. The most significant is -4F on Feb 6th but 2F on the 8th was broken in 1934. The other five were from May to September. The hot spells also produced a total of seven surviving record high minima, there were two in the early June spell (June 1 77F, and June 2 76F tied with 1918 -- 75F on May 31 was later broken by 76F in 1987), and four in September, in addition to one in November, for a count of 6.50. A number of the mild late December days had minima that were later edged out by 2-3 degrees. There were 23.75 high minimum records set in 1895 in the starter era, third highest, for a survival rate of 27.3%. Record high maxima (count 22.0, count at end of 2021 was 6.83) Temp ___ date _____ broken _____ eventual end of data record max _86F ____ Apr 25 ____ 1915 (91F) ___ 1915 (91F) ____ now tied with 1939 fourth warmest, 88F (2009), (87F) 1960. _81F ____ May 4 ____ 1919 (82F) ____ 2001 (92F) _86F ____ May 29 ___ 1919 (92F) ____ 1969 (97F) ____ also 96F in 1987. ___ 90F on May 30 1895, not a starter record. _96F ____ May 31 ____ eventual record tied later by 1939 .. (third warmest 94F 1987, fourth warmest 93F 1929,37,86). _96F ____ June 1 ____ eventual record .. (second warmest 1918 (94F), tied third warmest 1937, 87 (93F)). _96F ____ June 2 ____ eventual record .. (second warmest 1919 (93F), tied third warmest 1961, 2000 (90F)). _95F ____ June 3 ____ eventual record .. (second warmest 1925 (94F), tied third warmest 1919, 30, 43 (92F) recent 87F (2014). _93F ___ July 20 ___ 1923 (99F) __ 1980 (101F) ____ tied 1876. _90F ___ Aug 29 ___ 1926 (93F) __ 1953 (99F) _____ tied 1877. _92F ___ Sep 11 ___ 1931 (99F) __ 1931,83 (99F) ___ tied by 1897. 96F (2013) now third warmest, 1895,97 tied with 1961,64. _93F ___ Sep 12 ___ 1961 (94F) __ 1961 (94F) ____ remains second warmest, 90F (2005) recent max, t1952. _93F ____ Sep 20 ____ eventual record tied later by 1983 .. (1985 3rd (88F), 1946 4th (86F), 1968 5th (85F)). _95F ____ Sep 21 ____ eventual record .. (second warmest 1914 (94F), third warmest 1940 (92F), fourth 1965 (88F)). _95F ____ Sep 22 ____ eventual record tied later by 1914 .. (tied third warmest 94F 1970, 1980, fifth 92F 1931). _97F ____ Sep 23 ____ eventual record .. (second warmest 1970 (93F), third warmest 1914 (92F), fourth 1941 (91F)). _72F ___ Nov 9 ____ 1975 (75F) __ 1975,2020 (75F) ___ 1986 (73F) third, 1895 was later tied (4th) by 1945, 1950. _68F ___ Nov 10 ___ 1931 (72F) __ 1985,2020 (74F) _59F ___ Nov 25 ___ 1908 (60F) ___ 1979 (73F) ____ tied 1890 and later also by 1905. _66F ___ Nov 26 ___ 1946 (67F) ___ 1946 (67F) ____ 1895 now tied second warmest with 1979, 1988 (65F 2011, 2020). _60F ____ Dec 20 ____ eventual record tied later by 1999, 2002 .. (fourth warmest 59F 1957, fifth 56F 1988). _54F ___ Dec 21 ___ 1923 (62F) ___ 2013 (65F) ____ later tied by 1902 _55F ___ Dec 27 ___ 1936 (60F) ___ 1949 (63F) ____ previous day 60F not a starter record (62F 1889). _60F ___ Dec 30 ___ 1984 (65F) ___ 1984 (65F) ____ 1895 tied second warmest with 1990. _60F ___ Dec 31 ___ 1932 (62F) ___ 1965 (63F) ____ 1895 tied fourth warmest with 1936, 1990 ... 1992 3rd (61F). Record high minima (starter era count 23.75, count at end of data 6.5.) _44F ___ Jan 7 ___ 1907 (49F) ___ 1946 (54F) ___ 2012 3rd (46F), 2008 4th (45F), 1895 t-5th 1930 (44F). _38F ___ Jan 11 __ 1909 (39F) ___ 2020 (51F) ___ 1895t1898 (count 0.5). 1975 2nd (48F), 1972 4th (44F), 1983 3rd (43F),. _42F ___Mar 1 ___ 1902 (49F) ___ 2017 (54F) ___ 2004 3rd (45F), 2018 4th (44F), 1895, 1971, 1972 t-5th (42F). _66F ___May 8 ___ 1930 (69F) ___ 2000 (70F) ___ 1895 t1872 t-3rd (66F), 1943, 1964, 2024 t-5th (65F). (count 0.5). _69F ___May 9 ___ 1964 (71F) ___ 2000 (74F) ___ 1895 3rd (69F), 1963, 1979 t-4th (67F). _67F ___May 11 __ 1970 (69F) ___ 2015 (70F) ___ 1895 t1985 t-3rd (67F), 1881 5th (66F), 1880 6th (65F). _69F ___May 30 __ 1919 (70F) ___ 1987 (74F) ___ 1986 2nd (73F), 2015 3rd (72F), 1919,31,2011 t-4th (70F), 1895 t1871 (count 0.5).* _75F ___May 31 __ 1987 (76F) ___ 1987 (76F) __ 1895 t2013 t-2nd (75F), 1929, 1939 t-4th (73F). _77F ___June 1 __ eventual record high minimum .. 2013 2nd (73F), 1987, 1991 t-3rd (72F). _76F ___June 2 __ eventual record high minimum later tied by 1918 .. 1999 3rd (74F), 1961 4th (72F). _75F ___July 21 ___ 1906 (76F) __ 1980 (82F) __ tied by 1885,96,98 _ 77F 1930, 78F 1940,49,77 also records before 1980. _77F ___Aug 16 ___ 1938 (79F) __ 1938 (79F) __ 2016 2nd (78F), 1895 t 1978 t-3rd (77F), 2015, 2018 t-5th (76F). _76F ___Aug 29 ___ 1948 (78F) __ 2018 (81F) __ 1979 3rd (77F), 1895 t1953,73 t-4th (76F), 1952 7th (75F). _77F ___ Sep 12 ___ eventual record high minimum .. 1947,61 t-2nd (73F), 1906,25,71 t-3rd (72F), 2018 6th (71F). _77F ___ Sep 21 ___ eventual record high minimum .. 1906 2nd (75F), 1907,89 t-3rd (72F), 2017 5th (71F). _75F ___ Sep 22 ___ eventual record high minimum .. 1980,89 t-2nd (73F), 1957,2021 t-4th (72F), 1919,65,2002 t-6th (71F). _76F ___ Sep 23 ___ 1970 (77F) __ 1970 (77F) __ 1895 2nd (76F), 1909 3rd (74F), 2019 4th (70F). _74F ___ Sep 26 ___ eventual record high minimum .. 1881 2nd (73F), 1891,1970 t-3rd (72F), 1958,72 (70F). _60F ___ Nov 8 ___ 1975 (63F) ___ 1975 (63F) ___ 1996 2nd (62F), 1895 3rd (60F), 1945 4th (57F), 1885,2006,20 t-5th (56F). _64F ___ Nov 9 ___ eventual record high minimum .. 1945 2nd (62F), 1975 3rd (60F), 1950 4th (58F), 2006 5th (56F). _43F ___ Dec 19 ___ 1949 (45F) __ 1949,57,2017 (45F) __ 1967 4th (44F), 1895 5th (43F), 1889, 2001 6th (42F). _47F ___ Dec 20 ___ 1957 (54F) __ 1957 (54F) ___ 1895 2nd (47F), 1998 3rd (46F), 2002,11,13 t-4th (41F). _49F ___ Dec 21 ___ 2013 (51F) __ 2013 (51F) ___ 1895 2nd (49F), 1957,2018 t-2nd (47F), 1998 4th (46F). _47F ___ Dec 24 ___ 1931 (50F) __ 2015 (63F) ___ 1941 2nd (49F), 1979 3rd (48F), 1895 4th (47F). _46F ___ Dec 25 ___ 1932 (47F) __ 2015 (57F) ___ 1979 2nd (50F), 1964 3rd (49F), 1987 4th (48F), 1932,65 t-5th (47F). _48F ___ Dec 26 ___ 1964 (50F) __ 1964 (50F) ___ 1895 2nd (48F), 2015 3rd (47F), 1891 4th (44F), 1973 5th (42F). Summary: 26 records set (count 23.75), of the 19 broken the average year first breaking them was 1946, which would change to 1970 if the seven remaining records were all broken in 2022. The average by which the 19 records were eventually surpassed was 5.8 F deg, which reduces to 4.2 F deg if the surviving records are also counted. * May 30 1895 t1871, later also 1908, 1911, 1969 all t-7th (69F). _______________________________________________ 1896 _ More intervals of very warm weather developed in April and May of 1896, and through parts of the summer and autumn. There were 21 high maximum records, with just one tie, for a count of 20.5. Only one of these, Nov. 27, survived to the present, a survival rate of only 4.9%. The count as recently as 1970 was however 9.00. The average year breaking 1896 record highs was 1953; if the Nov. 27 record falls this year, that average will change to 1956. The average surplus of eventual record highs was 6.3 F deg which reduces to 6.0 including the sustained record. The year produced just three surviving low maximum records, the most notable is Feb 17 (7F), a benchmark value and just two days after a record high. With a relatively small count of 6.5 record low minima in the starter era, 1896 produced three untied record low minima, including -5F on Feb 17, and five record high minima including 47F on Feb 29th (tied in 2016), three readings in the low 80s in the August heat wave (9th-11th, two are ties), and 60F on Nov 27 remains a record and was a benchmark until slightly higher readings in Dec 2013 and 2015. This gave a count of 3.5 from an original count of 28.5 which is second highest in the starter era (to 1898 with 32.83). Record high maxima (count 20.5, count at end of 2021 was 1.0) Temp ___ date _____ broken _____ eventual end of data record max _57F ____ Feb 6 _____ 1938 (58F) ___ 2008 (68F) ____ 1938 tied by 1991, 1896 thus fourth warmest. _54F ____ Feb 15 ____ 1915 (58F) ___ 1949 (73F) ____ more recent max 69F 1954, 62F 2018. _79F ____ Apr 15 ____ 1938 (84F) ___ 1941 (87F) ____ more recent max 83F 1960, 82F 2002, 81F 2003. _87F ____ Apr 16 ____ 2002 (92F) ___ 2002 (92F) ____ 1896 remains second warmest, 1976 (82F) third. _88F ____ Apr 17 ____ 1976 (91F) ___ 2002 (96F) ____ 1896 remains third warmest _90F ____ Apr 18 ____ 1976 (96F) ___ 1976 (96F) ____ 2002 (91F) second warmest, 1896 is third. _79F ____ Apr 20 ____ 1915 (82F) ___ 1927 (90F) ____ more recent max 1976 (89F), 2005 (87F). _91F ____ May 9 ____ 1936 (92F) ___ 1979 (94F) ____ 1896 third warmest, 1881, 1953 (90F). _92F ____ May 10 ___ 1970 (93F) ___ 1979 (94F) ____ later tied by 1965 (1896 remains t3rd). _91F ____ May 11 ____1993 (92F) ___ 1993 (92F) ___ 1896 remains second warmest. _87F ____ May 17 ____1974 (92F) ___ 1974 (92F) ___ 1977, 2017 (90F) are t2nd, 1896 is fourth. _91F ____ Jun 26 ____ 1909 (93F) ___ 1952 (100F) ___ tied 1876, 1880, 1891 and later 1901. _97F ____ Aug 7 _____ 1918 (104F) ___ 1918 (104F) ___ 1896 now 5th, 1924,1931,2001 t2nd (99F) _95F ____ Aug 8 _____ 1980 (96F) ____ 2001 (99F) _____1896 later tied by 1941 and non-rec 1983 _98F ____ Aug 9 _____ 1949 (100F) ___ 2001 (103F) ___ 1896 remains third (97F 1941). _96F ____ Aug 11 ____ 1944 (102F) ___ 1944 (102F) ___ tied by 1900 (99F in 1949 and 97F in 2005). _93F ____ Aug 12 ____ 1944 (97F) ____ 1944 (97F) ____ also 96F (2002), 95F (1988, 95) _72F ____ Oct 31 ____ 1919 (74F) ____ 1946,2024 (81F) __ also 76F (1933,45,50,61) 74F (1919), 73F (1994) _70F ____ Nov 17 ____ 1953 (71F) ___ 1953 (71F) ____ 1896 remains second, 68F (1924), 66F (1987). _72F ____ Nov 27 ____ eventual record .. (second warmest 1946, 60, 88, 90, 2006, 15 (all 64F)). _69F ____ Nov 28 ____ 2011 (70F) ___ 2011 (70F) ___ 1896 was later tied by 1990 (they remain t2nd). Record high minima (starter era count 28.5, count at end of data 3.5.) _41F ___ Jan 25 __ 1967 (43F) ___ 2010 (49F) ___ 1990 2nd (45F), 1967 3rd (43F), 1896t 1947 t-4th (41F). _36F ___ Feb 5 ___ 1909 (37F) ___ 1991 (50F) ___ 1896 t 1888 (36F) (count 0.5) _ 2019 2nd (44F), 1943 3rd (41F). _37F ___ Feb 7 ___ 1904 (42F) ___ 1904 (42F) ___ 1990 2nd (41F), 1953,91 t-3rd (40F), 1941,2019 t-5th (39F). _47F ___ Feb 29 __ eventual record high minimum later tied by 2016 .. 1880 3rd (46F), 1972 4th (44F). _59F ___ Apr 14 __ 2019 (60F) ___ 2023 (70F) ___ 1896, 2014 t-3rd (59F), 1945 5th (57F), 2002 6th (56F). _61F ___ Apr 15 __ 1941 (67F) ___ 1941 (67F) ___ 1960 2nd (62F), 1896 3rd (61F), 1938 4th (60F), 2002 5th (59F). _63F ___ Apr 16 __ 1941 (64F) ___ 2002 (69F) ___ 2012 2nd (65F), 1941 3rd (64F), 1969, 2017 t-4th (59F). _59F ___ Apr 17 __ 1959 (60F) ___ 2002 (74F) ___ 1976 2nd (66F), 2012 3rd (61F), 1959,1969 t-4th (60F). _58F ___ Apr 18 __ 1973 (61F) ___ 2002 (76F) ___ 1976 2nd (70F), 1973 3rd (61F), 1896, 1969 t-4th (58F). _62F ___ Apr 19 __ 1976 (68F) ___ 1976 (68F) ___ 1985 2nd (65F), 2002 3rd (63F), 1896,1973 t-4th (62F). _63F ___ Apr 20 __ 1976 (67F) ___ 1976 (67F) ___ 2005 2nd (64F), 1896 3rd (63F), 1952 4th (61F). _62F ___May 5 ___ 1944 (64F) ___ 2015 (66F) ___ 1944 t2006 t-2nd (64F), 1949 4th (63F), 1896 5th (62F). _71F ___May 10 __ 1979 (72F) ___ 1979 (72F) ___ 1896 2nd (71F), 1970 3rd (70F), 1880 4th (69F), 1895,1957 t-5th (67F). _69F ___May 18 __ 2017 (75F) ___ 2017 (75F) ___ 1896 t 1906 t-2nd (69F), 1877 4th (68F), 1977 5th (67F). _73F ___ June 22 __1908 (74F) ___ 1941 (76F) ___ 1909,88 t-2nd (75F), 1908,97 t-4th (74F), 1896t1907,34,49 t-6th (73F). _78F ___ July 5 ___ 1908 (80F) ___ 1999 (82F) ___ 1883,96,1919 t-3rd (78F) (count 0.5). 1911,55,2012 t-6th (77F). _77F ___ July 17 __ 1995 (84F) __ 1995 (84F) ___ 2016 2nd (79F), 2013 3rd (78F) ... _ _ _ _ _ _ ______________________________________1891 t1896 (count 0.5) t-4th also 1997 (77F); .. 1872,1901,52,72,74 t-7th (76F). _75F ___ July 21 __ 1906 (76F) ___ 1980 (82F) ___ 2019 2nd (80F), 1940,49,77 t-3rd (78F). 1885,95,96,98 tied (75F) (count 0.25). _79F ___Aug 8 ___ 1980 (80F) ___ 1980 (80F) ___ 1896 t 2001 t-2nd (79F), 1898, 1918 t-4th (77F), 1874,1907,77,78,79,2018 t-6th (76F). _82F ___Aug 9 ___ eventual record high minimum later tied by 2001 .. 1980 3rd (80F), 1909 4th (77F). _80F ___Aug 10 __ eventual record high minimum .. 1949 2nd (79F), 1891,2010 t-3rd (78F), 1961 5th (77F). _81F ___Aug 11 __ eventual record high minimum tying 1891 .. 1905 3rd (80F), 1900 4th (79F), 2020 5th (78F). _79F ___Aug 12 ___ 1988 (80F) ___ 1988 (80F) ___ 1896 2nd (79F), 1905 3rd (78F), 2005 4th (77F), 1885,1980 t-5th (76F). _76F ___Aug 13 ___ 1905 (77F) ___ 1908 (82F) ___ 2016 2nd (81F), 2002,05 t-3rd (80F), 1885 t 1896 (count 0.5). _70F ___Sep 15 ___ 1901 (72F) ___ 1931,2005 (75F) __ 1915 3rd (74F), 1903 4th (73F), 1889 t 1896 (count 0.5). _54F ___Nov 4 ____ 1948 (59F) ___ 1982 (62F) ___ 1961,75 t-2nd (61F), 1948 4th (59F), 1994 5th (58F). 1896t 1903,34 (54F). _60F ___Nov 5 ____ 1935 (61F) ___ 1938 (63F) ___ 1961 2nd (62F), 1935,59 t-3rd (61F), 1896,1948 t-5th (60F). _51F ___Nov 17 ___ 1918 (53F) ___ 1927 (60F) ___ 1928 2nd (57F), 1918 3rd (53F), 1896,1963,2010,2013 t-4th (51F). _54F ___Nov 18 ___ 1921 (55F) ___ 1928 (57F) ___ 1896, 1958 t-3rd (54F), 1954 5th (53F), 1966 6th (52F). _49F ___Nov 24 ___ 1931 (54F) ___ 1979 (61F) ___ 1999 2nd (56F), 2014 4th (53F), 1896 tied by 1908 (49F). _60F ___Nov 27 ___ eventual record high minimum .. 1976 2nd (54F), 2015,20 t-3rd (51F), 1937 5th (50F). _44F ___Nov 28 ___ 1911 (50F) ___ 2011 (56F) ___ 1990 2nd (55F), 2001 3rd (53F), 1896 t1870,77,79 (count 0.25) _45F ___Dec 13 ___ 1948 (48F) ___ 2015 (55F) ___ 1991 2nd (51F), 1983 3rd (50F), 1948 4th (48F), 2020 5th (47F). Summary: 33 records set (count 28.5) ... of the 28 since broken, the average year breaking the records was 1947. If the five surviving records all fell in 2022, that would change to 1958. The records broken have eventually been surpassed by an average of 6.8 F deg. With the surviving records counted, that decreases to 5.9 F deg. _______________________________________ 1897 _ This year was not quite as warm, and produced only ten record highs, three of which were tied, and another in a three-way tie, for a count of 7.83. Only one record remains (Oct 16) for a survival rate of 12.8%. The average year breaking these 1897 marks was only 1916, which would change to 1927 if the surviving record fell this year. The average surplus of eventual records is 12.2 F deg, which reduces to 11.0 if the surviving record is included. The year produced only three low maxima (count 2.50), two were in late July (both 68F). This was around the same time that Toronto was setting a 24h rainfall record. During the year there were also just three low minima (count 2.50) from an original sparse crop of 5.5 starter record low minima. There was one record high minimum (67F) with the Oct. 16 record max of 87F. This is the sole survivor from a starter era count of 10.083, a survival rate of 9.9%. Record high maxima (count 7.83, count at end of 2021 was 1.0) Temp ___ date _____ broken _____ eventual end of data record max _60F ____ Mar 21 ___ 1903 (65F) ___ 1921 (84F) ____ 1938 (74F), recent max 67F (2012). _60F ____ Mar 23 ___1902 (64F) ___ 1923, 2012 (76F) ___ tied 1878 and 1889. _60F ____ Mar 30 ___ 1902 (61F) ___ 1998 (82F) _____ tied 1875 _92F ____ July 10 ___ 1903 (93F) ___ 1936, 1993 (102F) _93F ____ Sep 10 ___ 1931 (97F) ___ 1931, 1983 (97F) ___ tied 1894, 1894,97 now t-4th, with 1989 (94F) third. _92F ___ Sep 11 ___ 1931 (99F) __ 1931,83 (99F) ___ tied 1895. 96F (2013) now third warmest, 1895,97 tied with 1961,64. _82F ___ Oct 15 ___ 1956 (84F) ___ 1956 (84F) ____ 1897 tied 2nd with 1960, 1975, more recent max 80F 1985, 77F 2014. _87F ____ Oct 16 ____ eventual record .. (second warmest 1879, 1958, 63 (83F), t5 1938, 47 (82F)). More recent 77F 1992. _68F ___ Nov 16 ____ 1927 (71F) ___ 1928 (72F) ____ more recent max 71F (1956, 1990, 2001). _57F ___ Dec 15 ____ 1901 (60F) ___ 2015 (68F) ____ Record High Minima (starter era count 10.083, count at end of 2021 is 1.0) _41F ___ Jan 3 ___ 1950 (43F) __ 2000 (51F) __ 2005 2nd (49F), 1998 3rd (46F), 2004 4th (44F), 1950,97 t-5th (43F). 1897 t1876 (count 0.5). _41F ___Jan 4 ____1906 (42F) __ 1950 (59F) __ 2000 2nd (46F), 1933,97,98 t-3rd (44F), 2003 6th (43F), 1906,92 t-6th (42F), 1897,1931,93,2015,20 t-8th (41F). _41F ___Mar 30__ 1902 (48F) __ 1998 (59F) __ 1945 2nd (58F), 1977,81 t-3rd (56F). 1897 tied 1871,86,98 (count 0.25). _57F ___Apr 25 ___1979 (58F) __ 1979,82 (58F) __ 1897 3rd (57F), 1878,95,1913,53,2008,11 t-4th (56F) _63F ___May 12 ___1908 (65F) __ 1959 (67F) __ 1970,85,93 t-3rd (66F), 1908 6th (65F), 1942,44 t-7th (64F) 1897 t1869,81 (count 0.33). _71F ___June 4 ___ 1925 (76F) ___1943 (78F) __ 2010 3rd (72F), 1897 4th (71F); 1960 5th (70F); 1877,1940 t-6th (69F). _76F ___Aug 15 ___ 1908 (78F) __ 1988 (81F) __ 1985 2nd (80F), 1908 3rd (78F); 2005 4th (77F), 1897,1942,47,80 t-5th (76F). _67F ___Oct 16 ___ eventual record high minimum .. 1879 2nd (65F), 1908 3rd (64F), 1881,1914,60 t-4th (62F), 1899,2014 t-6th (61F). _50F ___Nov 26 ___ 1908 (53F) __ 1946,2020 (55F) __ 1908,79 t-3rd (53F), 1992 5th (52F), 1964,2001 t-6th (51F), 1897,2009,11 t-8th (50F). _45F ___Dec 14 ___ 1901 (53F) __ 1901,2015 (53F) __ 1983 3rd (47F), 2006 4th (46F), 1897 5th (45F), 1918,20 t-6th (44F). _47F ___Dec 15 ___ 1983 (48F) __ 2015 (53F) ___ 1983,2008 t-2nd (48F), 1897,2011 t-4th (47F), 2018 6th (46F), 2006 7th (44F). _44F ___Dec 16 ___ 1928 (45F) __ 2021 (54F) ___ 1971 2nd (48F), 2015 3rd (46F), 1928 4th (45F), 1897,1982 t-5th (44F). Summary: 12 records were set, of the eleven since broken the average of years breaking them is 1927. If the one surviving record fell in 2022 this would change to 1935. The eleven records were eventually surpassed by an average of 8.4 F deg which would decrease to 7.7 F deg if the one surviving record were included. ________________________________________ 1898 _ This year had a rather hot summer and produced 19 daily record highs in the starter era (1869-1900), with three ordinary ties and one three-way tie, the count was 16.83. None have survived all the way to the present time. The average of years breaking these records was 1927. The average surplus of the eventual record highs is 6.9 F deg. 1898 accounts for just two record low maxima, 41F on April 28, and 28F on Nov 27 (later tied in 1932) for a count of 1.50. The extinction date for record highs was Feb 10, 1990. The year managed just a tied record minimum (count 0.5) in July, from a count of only 2.0 in the starter era, but the September heat wave had a run of very warm nights that set five consecutive high minimum records (Sep 1-5, 76F, 79F, 78F, 78F, 77F), of which the first and last have become four-way ties, the middle three are still exclusive to 1898 despite hotter days that broke the maximum records (2nd is tied with 7th 1881 as September monthly maximum). The earlier July heat wave only managed a 75F on July 2nd, well short of several other years. Oct 4 and 5 also have record high minima that are also monthly highs (75F, 75F), despite highs reaching only the low 80s (not starter record highs). So from seven in total the count is 5.50. This is the residue of an original count of 32.83 in the starter era, from 40 days with records (some tied), which forms the largest number of record high minima for any year at its conclusion. The survival rate was 16.8%. Record high maxima (count 15.83, extinction date Feb 10, 1990) Temp ___date ____ broken _____ eventual end of data record max _49F ___ Jan 15 __ 1928 (53F) __ 1932 (67F) ____ tied 1870 __ also 1937 (66F), 1995 (59F) _51F ___ Feb 9 ___ 1949 (60F) __ 1990 (63F) ____ tied later by 1937 _58F ___ Feb 10 ___1990 (61F) __ 1990,2001,2023 (61F) __ also 57F (1955) and 56F (1909) _65F ___ Mar 17 __1927 (67F) __ 1945 (75F) ___ more recent max 1990 (72F). _69F ___ Mar 19 __ 1918 (76F) __ 1918 (76F) ___ recent max 2012 (74F). _64F ___ Mar 20 __ 1903 (67F) __ 1945 (83F) ___ recent max 2020 (77F). _89F ___ June 12 __ 1914 (91F) __ 1933,73,2017 (93F) __ tied 1872 and later by 1901 also (later ties not records). _94F ___ Jun 25 ___ 1923 (97F) __ 1943,52 (99F) __ tied 1870, 1880 _94F ___ July 1 ____ 1901 (100F) _ 1901 (100F) ___ also 1964 (99F), 1963 (98F), 2018 (96F) _100F __ July 3 ____ 1966 (101F) _ 1966 (101F) ___ 1898 later tied by 1911, recent max 2002 (95F) _96F ___ July 4 ____ 1911 (97F) __ 1949 (102F) ___ recent max 1999, 2002, 2010 (95F) _89F ___ Aug 23 ___1911 (90F) __ 1916 (92F) ____ later tied by 1906, recent max 1976, 89, 96 (90F) _93F ___ Aug 24 __ 1972 (94F) ___1972 (94F) ____ remains t 2 (1947), more recent 1995 (91F) _93F ___ Sep 1 ____ 1924 (95F) ___ 1953 (97F) ___ recent max 2010 (96F), also 1929, 1973, 1980 (95F) _93F ___ Sep 2 ____ 1921 (94F) ___ 1953 (102F) __ later tied by 1914, recent max 2010 (94F), also 1944 (97F), sev'l 96F _93F ___ Sep 3 ____ 1921 (95F) ___ 1929 (99F) ___ recent max 1993 (95F), also 1973 (96F) _92F ___ Sep 4 ____ 1929 (97F) ___ 1929 (97F) ___ recent max 2018 (92F), also 1961 (94F), 1973 (93F) _90F ___ Sep 5 ____ 1961 (93F) ___ 1985 (95F) ___ tied 1884 and later by 1944, 1959 Record high minima (starter era count 32.833, count at end of 2021 was 5.5) _38F ___ Jan 11 __1909 (39F) __ 2020 (51F) __ 1975 2nd (48F), 1972 3rd (44F), 1983 4th (43F); 1895 t1898 (count 0.5) _44F ___Jan 13 __ 1932 (56F) __ 1932 (56F) __ 2007 2nd (45F), 1898, 1972 t-3rd (44F), 2006 5th (43F).. _39F ___Jan 15 __ 1930 (40F) __ 1995 (54F) __ 1932 2nd (48F), 1987 3rd (46F), 1937 4th (42F). 1869 t1898 (count 0.5) _38F ___Feb 9 ___ 1937 (39F) __ 2005 (46F) __ 1990 2nd (45F), 1956 3rd (40F), 1937 4th (39F) 1898,1929,49,52,65,96 t-5th (38F). _42F ___Feb 11 __ 1925 (47F) __ 1966 (50F) __ 2009,18 t-3rd (45F), 2020 5th (43F), 1898,1960,1984 t-6th (42F). _40F ___Feb 15 __ 1908 (40F) __ 1984 (49F) __ 2005,18 t-2nd (46F), 1949 3rd (45F), 1954 4th (44F). 1898 tied 1882 (count 0.5). _41F ___Mar 11 __ 1903 (43F) __ 1967,77 (50F) __1925,55 t-3rd (49F), 2016 5th (48F), 1935,2006 t-6th (47F) 1898 tied 1879 (count 0.5). _50F ___Mar 12 __ 2021 (52F) __ 2021 (52F) __ 1898 2nd (50F), 2006 2nd (49F), 1902 3rd (47F), 1982 4th (46F). _52F ___Mar 13 __ 2012 (54F) __ 2012 (54F) __ 1898 2nd (52F), 1953,77,2006,12 t-3rd (50F), 1929 7th (49F). _41F ___Mar 16 __ 1921 (43F) __ 1990 (55F) ___ 1948 2nd (52F), 2000 3rd (51F), 1945,73 t-4th (49F), 2016 6th (48F). _45F ___Mar 17 __ 1936 (50F) __ 1990 (53F) __ 2003 3rd (48F), 1945 4th (46F), 1898,2012,2016 t-5th (45F). _48F ___Mar 19 __ 1945 (49F) __ 2012 (55F) __ 1983 2nd (52F), 1945t2010 t3rd (49F), 1894t1898 t-5th (48F). (count 0.5). _46F ___Mar 20 __ 1903 (56F) __ 1948 (57F) __ 2012 3rd (55F), 1945,2010 t-4th (54F), 1938 6th (52F), 1976 7th (51F). _47F ___Mar 28 __ 1905 (53F) __ 1998 (63F) __ 1945,85 t-2nd (59F), 1949,89 t-4th (56F), 1946 6th (55F). _47F ___Mar 29 __ 1902 (50F) __ 1998 (62F) __ 1945 2nd (60F), 1907 3rd (58F), 1946 4th (57F), 1985 5th (55F). _41F ___Mar 30 __ 1902 (48F) __ 1998 (59F) __ 1945 2nd (58F), 1977,81 t-3rd (56F). 1898 t 1871,86,97 (count 0.25). _49F ___Apr 11 __ 1915 (52F) __ 2017 (61F) __ 1922,55 t-2nd (58F), 2014 4th (56F). 1915,19,80,81,2010 t-5th (52F). 1898 t1878 (count 0.5). _68F ___May 20 __ 1903 (71F) __ 1996 (74F) __ 1898 3rd (68F), 1959,82 t-4th (67F), 1889, 2019 t-6th (66F). _70F ___June 9 ___ 1922 (72F) __ 1984 (77F) __ 1933,2008 t-2nd (76F), 1939,73 t-4th (73F), 1898 t1876,82 (count 0.33). _71F ___June 12 __ 1942 (72F) __ 2017 (76F) __ 2015 2nd (73F), 1942,73,97,2005 t-3rd (72F), 1898 t1880,1914,39 (count 0.5). _74F ___June 13 __ 1961 (75F) __ 2006 (76F) __ 1961,2005 t-2nd (75F), 1898 4th (74F), 1983 5th (73F). 1892,1940,56,69,84,2015 t-6th (72F). _75F ___July 21 __ 1906 (76F) __ 1980 (82F) __ 1940,49,77 t-2nd (77F), 1898 tied 1885, 95, 96 (count 0.25). _77F ___July 29 __ 1995 (79F) __ 1995,2002 (79F) __2015 3rd (78F), 1898 tied 1892, also 2020 t-4th (77F). (count 0.5). _78F ___July 30 __ 1988 (79F) __ 2002 (80F) __ 1898,1917,2019 t-3rd (78F), 1909,95,2006 t-6th (77F). _74F ___Aug 23 __ 1901 (76F) __ 1906 (77F) __ 1898,1905,2020 t-3rd (74F), 1899,1964,1966,2009 t-6th (73F). _74F ___Aug 25 __ 1961 (76F) __ 1961,98 (76F) __1891,98,1979 t-3rd (75F). (count 0.5). 1900,18,47,72,80 t-6th (74F) _75F ___Aug 31 __ 1953 (78F) __ 1953 (78F) __ 2010,15 t-2nd (76F), 1898 4th (75F), 1964,73,79,80,2016 t-5th (74F). _76F ___Sep 1 __ eventual record high minimum later tied by 1980,2010,2015 .. 1878,81,1950,53,2013,14 t-5th (75F). _79F ___Sep 2 ___ eventual record high minimum .. 2010 2nd (78F), 1953 3rd (77F), 1878 4th (76F), 1961,77,80 t-5th (75F). _78F ___Sep 3 ___ eventual record high minimum .. 1953 2nd (77F), 1993 3rd (76F), 1878,1959,73,2018 t-4th (75F). _78F ___Sep 4 ___ eventual record high minimum .. 1907,2018 t-2nd (77F), 1953 4th (76F), 1905,29,32,73,79,85 t-5th (74F). _78F ___Sep 5 ___ eventual record high minimum later tied by 1907,1985,2018 .. 1880 5th (76F), 1910,79 t-6th (75F). _71F ___Sep 17 __ 1915 (72F) __ 1991 (77F) __ 1898 t1894 and later 1905,07,30 all tied-3rd (71F). (count 0.5) _71F ___Sep 18 __ 1905 (72F) _ 1905,72 (72F) __1898, 1991 t-3rd (71F). 1894,2016,2018 t-5th (70F). _67F ___Oct 3 ___ 1954 (68F) __ 1954,69 (68F) __1898 3rd (67F), 1890,1927 t-4th (66F), 1879,1968,1979,2007 t-6th (65F). _75F ____Oct 4 __ eventual record high minimum .. 1954 2nd (70F), 1941,86,2007 t-3rd (69F), 1995 6th (68F). _75F ____Oct 5 __ eventual record high minimum .. 1910,41 t-2nd (71F), 1900 4th (69F), 1959 5th (68F), 2007 6th (67F). _63F ___Oct 11 __ 1914 (64F) __ 2018 (69F) __ 1949 2nd (68F), 1990 3rd (67F), 1914 4th (64F), 1898,1913,54,61 t-5th (63F). _54F ___Nov 10 __ 1966 (58F) __ 2020 (60F) __ 1966,1977 t-2nd (58F), 1975,85,99 t-4th (57F), 2002,09 t-7th (56F), 1979 9th (55F). _43F ___Dec 30 __ 1948 (52F) __ 1948 (52F) __ 1992 2nd (46F), 1898, 1907 t-3rd (43F), 1906,32 t-5th (42F). Summary: 40 days broke or tied records, count 32.833, average year breaking 33 records was 1937, if surviving seven records all were broken in 2022, this would change to 1950. The count was reduced to 6.50 in 2018 and 5.50 in March 2021, and stood at 10 until Sep 1, 1980 (the first tie of any surviving record). 1898 lost ten of its record high count by 1915. The average surplus of the 33 records broken is 8.7 F deg which reduces to 7.1 if the five surviving records are counted. ________________________________________ 1899 _ The most remembered weather event of this year was a February deep freeze and east coast snowstorm mid-month, but much of the year was quite warm and set 18 starter record highs with two ordinary ties and one three-way tie for a count of 16.33. Only one tied record (Dec 19th) survived, recently reduced to a third share (with 1931 and 2025), a rate of just 2.0%. The average year breaking these 1899 records was 1925, which would become 1931 if the tied record were broken in 2026. The average surplus of the eventual record highs was 7.8 F deg which would be reduced to 7.5 F if the surviving record was included. The February cold wave set four low maximum records (10th-13th, 7F, 9F, 9F, 11F), with 16" snow 12th-13th. Two more low maxima were set on Oct 1-2 (51F, 49F, earliest sub-50F maximum of fall season). The count was 6.0 for the year. The February cold spell only took down two daily minima, one tied earlier in 1885, the 12th-13th later broken by 1914. The lowest reading was -6 (10th). Oct 3rd also took a one-third share, for a total of three record lows and a count of 1.83. The annual count was only 5.0 even at the time. There was just one tied record high minimum, 76F (June 15th) later tied in 1945 and 1956. (count 0.33), from a starter era count of 20.833, which is a survival rate of only 1.6%. Record high maxima (count 16.33, count at end of 2025 was 0.33) Temp___date _____ broken _____ eventual end of data record max _53F ___ Feb 21 ___ 1906 (58F) ___ 2018 (78F) _76F ___ Apr 30 ___ 1901 (80F) __ 1942 (91F) ___ tied 1879, recent max 1985 (84F). _84F ___ May 1 ____ 2001 (87F) __ 2001 (87F) ___ tied later by 1985, these now t3 (85F 2010). _86F ___ May 2 ____ 1913 (89F) __ 2001,18 (90F) ___ tied 5th warmest w 1930,92, 4th is 2010 (88F). _88F ___ May 28 ___ 1918 (91F) __ 1959 (94F) ___ more recent max 1977, 2016 (92F) _94F ___ June 5 ____ 1925 (99F) __ 1925 (99F) ___ 1899 third to 1966 2nd (95F), more recent 2010 (88F). _95F ___ June 6 ____ 1925 (98F) __ 1925 (98F) ___ 1899 remains second, 1953,68 (93F), recent 2010 (89F). _94F ___ June 7 ____ 1925 (96F) __ 1925 (96F) ___ 1899 remains tied second with 1999, 2008 (94F). _92F ___ June 8 ____ 1933 (95F) __ 1933 (95F) ___ 2011 (94F) recent max. _95F ___ July 27 ____ 1940 (98F) __ 1940,63 (98F) __ also 1955, 2005 (97F) and 1999 (96F), 1899 now sixth. _94F ___ Aug 5 _____ 1918 (95F) __ 1944 (101F) ___ also 1955 (100F), 2005 (98F). _79F ___ Oct 18 ____ 1928 (82F) __ 1928 (82F) ____ later tied by 1908 and non-rec 1945, recent max 2016 (81F). _72F ___ Oct 19 ____ 1905 (75F) __ 2016 (85F) _71F ___ Oct 26 ____ 1908 (72F) __ 1963,64 (78F) ___ tied 1874 __ more recent max 1989 (77F). _75F ___ Oct 27 ____ 1947 (78F) __ 1963 (82F) ___ t4 warmest with 1991, 2010, 3rd is 1989 (76F). _70F ___ Oct 28 ____ 1913 (72F) __ 1919 (83F) ___ more recent 1984 (79F) _55F ___ Dec 3 _____ 1912 (56F) __ 1998 (69F) ___ tied 1879, 1891. _58F ___ Dec 19 ___ eventual record later tied by 1931 and 2025 .. (third warmest 1929,67 (56F), fifth 2017 (55F)). Record high minima (starter era count 20.833, count at end of 2021 was 0.333) _40F ___Jan 16 __ 1995 (53F) __ 1995 (53F) __ 2016 2nd (42F), 1899 later tied by 1913,32,74 (t-3rd) (40F), 1906,47,90 t-7th (39F). _40F ___Feb 21 __ 1906 (43F) __ 2018 (55F) __ 1930,2002 t-2nd (50F), 1981 4th (47F), 1996 5th (46F), 1913,2016 t-6th (44F). _41F ___Feb 22 __ 1930 (42F) __ 1996 (46F) __ 1981 2nd (43F), 1930,1985,2002,12 t-3rd (42F), 1899,1983.2017 t-7th (41F). _60F ___Apr 26 __ 1907 (61F) __ 2009 (67F) __ 1908 2nd (63F), 1907 3rd (61F), 1899 4th (60F), 1895,1953,79 t-5th (59F). _55F ___Apr 30 __ 1903 (63F) __ 1903 (63F) __ 1942,74 t-2nd (60F), 1983 4th (59F), 1911,84,98 t-5th (58F). 1899 t1879 (count 0.5). _65F ___May 2 ___ 1913 (67F) __ 1913 (67F) __ 2001,10 t-2nd (66F), 1899,2018 t-4th (65F), 1894,1930 t-6th (63F). _76F ___June 6 ___ 1925 (77F) __ 1925 (77F) __ 1899,2021 t-2nd (76F), 1883 4th (75F), 1940 5th (74F), 1906 6th (73F). _73F ___June 14 __1956 (76F) __ 2005 (78F) __ 1899,1983 t-3rd (73F), 1892,1969,94 t-5th (72F). _76F ___June 15 __ eventual record high minimum later tied by 1945, 1956 .. 1988 4th (74F), 1987 5th (73F). _77F ___July 27 __ 1995 (78F) __ 1995 (78F) __ 1899,1930 t-2nd (77F), 1882,2020 t-4th (76F), 1869,87,1908,63,79,80 t-6th (75F). _78F ___Aug 5 ___ 1908 (81F) __ 1908 (81F) __ 1930, 2005 t-2nd (79F), 1899,1980,2002 t-4th (78F), 1890,96,1944,55,2010 t-7th (77F). _76F ___Aug 20 __ 1906 (77F) __ 1906,83,2015 (77F) __ 1899,1937,2004 t-4th (76F), 2009,19,21 t-7th (75F). _75F ___Aug 22 __ 1906 (78F) __ 1906 (78F) __ 1916,42 t-2nd (77F), 2003 4th (76F), 1899t1885,91 (count 0.33) (t-5th) _62F ___Oct 14 __ 1938 (63F) __ 1990 (68F) __ 1954 2nd (66F), 1970,71 t-3rd (64F), 1938,2014 t-3rd (63F), 1899,1915,55,2021 t-5th (62F). _61F ___Oct 15 __ 1915 (62F) __ 2014 (69F) __1975 2nd (66F), 1960,85,2017 t-3rd (65F), 1955,2021 t-6th (63F), 1915,38,43,2000 t-8th (62F). _67F ___Oct 18 __ 1928 (69F) __ 1928 (69F) __ 1899, 2016 t-2nd (67F), 1947 4th (66F), 1968 5th (64F), 1879,2007 t-6th (63F). _58F ___Oct 25 __ 1908 (69F) __ 1908 (69F) __ 1913 2nd (62F), 1975 3rd (61F), 1899t1900, 1991 (all tied 4th) (58F) (count 0.5). _59F ___Oct 26 __ 1908 (66F) __ 1908 (66F) __ 2010 2nd (63F), 1946,61 t-3rd (61F), 1918,20,63 t-5th (60F), 1899 8th (59F). _59F ___Oct 28 __ 1918 (60F) __ 1971 (64F) __ 1984 2nd (62F), 1947 3rd (61F), 1918 4th (60F), 1899, 1946 t-5th (59F). _47F ___ Dec 1 ___1982 (48F) __ 2001 (52F) __ 1991 2nd (50F), 1998,2006 t-3rd (49F), 1982,96 t-5th (48F), 1899 7th (47F) _46F ___ Dec 2 ___1939 (47F) __ 1982 (52F) __ 1970 2nd (49F), 1939,68,80,81 t-3rd (47F), 1899,2001,15 t-7th (46F), 1998 10th (45F). _44F ___ Dec 3 ___1902 (47F) __ 1998 (53F) __ 1982 2nd (51F), 1970,2009,12 t-3rd (49F), 1932,41 t-6th (48F), 1902 8th (47F). 1899t1879 (count 0.5). _53F ___ Dec 12 __1911 (54F) __ 2015 (55F) __ 1899 3rd (53F), 1979 4th (50F), 1956,91,2020 t-5th (46F), 1949 8th (45F). Summary: 23 records were set or tied, for a count of 20.833. The average year breaking 22 of these records was 1922. This would change to 1927 if the one surviving record falls in 2022. The average eventual surplus for 22 records was 5.7 F deg which reduces to 5.4 if the unbroken record is included. . _________________________________________ 1900 _ This is the last year of the starter record period, but its count would be the same if excluded since it has to break or tie highest values of the earlier 31 years to qualify. 1900 had numerous very warm spells and racked up a total of 22 records of which five were ordinary ties and one a four-way tie (count 18.75). This was third highest of the starter era. Three survived to the present time (two in May, one in November), so the survival rate is 16.0 per cent. May, July, August, October and November had the most notable warm spells. The average of years breaking 1900 record highs is 1932, which would change to 1944 if the three surviving records were broken later this year. The average surplus of the eventual record highs over 1900 record values is 6.8 F deg which drops to 5.8 if the three surviving records are also counted in. The average starter record (1869-1900) falls 7.2 F short (including those that have survived) of the eventual set, so 1900 has done slightly better than that average. By 1901-30, the maximum just from that thirty years (even in the numerous cases that did not break starter records) came a bit closer at 6.0 F short. Then in the modern warmer climate, the average maximum reading 1991-2020 falls just 3.6 F short of the period records (not surprising since it has set quite a few of them for zero contributions to the total to be averaged). Meanwhile, four record low maxima survive to end of the data, one tied, for a count of 3.5 -- all of them are in a cold period of late February into March. There is only one surviving record low minimum, 5F on Feb 27th, the residue of an original count of 5.5. There were three surviving record high minima, 46F on Jan 20, 68F on May 16, and 81F on July 18 (tied 2013), for a count of 2.50. Later spells produced values that were not quite able to hold or in one case had already been eclipsed in the 1890s. These non records include 79F on Aug 11th, 77F, 76F on Aug 26-27th (broken by 78F and 79F in 1948), 69F on Oct 5 and 56F on Nov 20th. I would imagine that had these weather events taken place in the late 20th century or more recently, some other record high minima would have been set in 1900. The annual average minimum was 2 F deg warmer than the average of 1869-1899 and only 1 F below the average for 1981-2020 (the period which I have assumed represents an urban heat island increase of 0.9 to 1.1 C or 1.6-2.0 F deg over those earlier years). The original count in the starter era was 17.0, which gives a survival rate of 14,7 per cent. Record high maxima (count 18.75, count at end of 2021 was 3.0) Temp ___ date _____ broken _____ eventual end of data record max _57F ____ Jan 20 ___ 1907 (58F) ___ 1951, 2006 (61F) _50F ____ Jan 21 ___ 1906 (59F) ___ 2006 (63F) _84F ____ May 13 __ 1930 (87F) ___ 1956 (89F) ____ 1900 later tied by 1906, recent max 2004 (86F) _88F ____ May 14 ____ eventual record .. (second warmest 1907 (87F), third 1991 (84F), fourth 1940,61,85 (83F)). _90F ____ May 15 ____ eventual record .. (second warmest 2018 (88F), third 1951, 2004 (87F)). _92F ___ Jun 27 ___ 1941 (94F) ___ 1966 (101F) _____ tied 1875, 1876, 1880. _94F ____ July 6 ___ 1908 (95F) ___ 2010 (103F) _97F ____ July 17 __ 1953 (100F) __ 1953 (100F) ___ tied 1885 __ 1955, 1968, 1999 hit 98F_ _95F ____ July 18 __ 1905 (96F) ___ 1953 (101F) ___ also 100F in 1977, 2012. _95F ____ Aug 6 ___ 1918 (96F) ___ 1931,55 (97F) __ remains third warmest Aug 6, recent max 94F (1989, 2001). _96F ____ Aug 11 __ 1944 (102F) __ 1944 (102F) ___ tied 1896 (99F in 1949 and 97F in 2005). _93F ____ Aug 25 __ 1943 (94F) ___ 1948 (95F) _____ tied 1893, currently they are tied fifth with 1968, t2 (94F) are 1943,69,93). _93F ____ Aug 26 __ 1948 (103F) __ 1948 (103F) ___ 1900 later tied by 1941, now t5 (1993 is third (96F) and 1980 fourth (94F). _92F ____ Aug 27 __ 1948 (101F) __ 1948 (101F) ___ 1900 later tied by 1933, recent max is 1980 (97F), 1993 (96F). _89F ____ Aug 30 __ 1921 (95F) ___ 1953,73 (98F) __ recent max 1991 (94F). _80F ___ Oct 8 _____ 1916 (84F) ___ 2007 (87F) ____ tied 1881 _76F ___ Oct 23 ____ 1947 (85F) ___ 1947 (85F) ___ tied 1871. _77F ___ Oct 24 ____ 2001 (79F) ___ 2001 (79F) ___ 1900 later tied by 1946, 1963. _67F ___ Nov 5 ____ 1935 (73F) ___ 1961 (78F) ___ 1900 later tied by 1934; recent max 1975, 1994 (73F) _67F ___ Nov 19 ___ 1921 (72F) ___ 1921 (72F) ___ also 71F in 1953, recent 67F (1991). _69F ___ Nov 20 ___ 1913 (72F) ___ 1985 (77F) ___ also 74F in 1991. _74F ___ Nov 21 ___ eventual record .. (second warmest 72F 1931, third 69F 1991). Record high minima (starter era count 17.00, count at end of 2021 was 2.50) _46F ___Jan 20 ___ eventual record high minimum .. 1951,91,2006 t-2nd (42F), 1927,53,95,2017 t-5th (40F). _63F ___May 14 ___ 1909 (65F) __ 1909 (65F) __ 1942,44 t-2nd (64F), 1879,1900 t-4th with 1991,2012 (63F) (count 0.5). _68F ___May 15 ___ eventual record high minimum .. 1909 2nd (67F), 1976 3rd (65F), 1889,1905 t-4th (63F), 1890 5th (62F). _75F ___July 8 ___ 1929 (77F) __ 1993 (80F) __1929,81,86,2010,15 t-2nd (77F), 1939,71 t-7th (76F), 1876,1900,21,37,2003,20 t-9th (75F) (count 0.5). _81F ___ July 18 ___ eventual record high minimum later tied by 2013 .. 1905 3rd (80F), 1907,99 t-4th (79F), 1953,55,77,82,2010 t-6th (78F). _77F ___Aug 26 ___ 1948 (78F) __1948,2021 (78F) __ 1900 3rd (77F), 1893 4th (76F), 1961,2016 t-5th (75F), 1909,18,76,93 t-7th (73F). _76F ___Aug 27 ___ 1948 (79F) __ 1948 (79F) __ 1893,98,1980 t-2nd (76F) (count 0.5) .. 1891,1933,1973,2021 t-5th (75F), 1959 9th (74F). _74F ___Aug 30 ___ 1928 (75F) __ 1973,2018 (78F) __ 1979 3rd (77F), 1953,60 t-4th (76F), 1928,2005 t-6th (75F), 1900,2004 t-8th (74F). _65F ___Oct 6 ____ 1910 (71F) __ 1910 (71F) __ 2017 2nd (68F), 1937,41,2007 t-3rd (66F), 1900,1903,59,82 t-6th (65F). _63F ___Oct 7 ____ 1903 (64F) __ 2005 (70F) __ 2007,18 t-2nd (67F), 1955,2017 t-4th (66F), 1944,59 t-6th (65F), 1903,36 t-7th (64F). _62F ___Oct 8 ____ 1908 (64F) __ 2017 (72F) __ 1922,49,82,90,2007 t-2nd (67F), 1959 7th (66F), 1908,36 t-8th (64F). _62F ___ Oct 23 ___1979 (67F) __ 1979 (67F) __ 2007 2nd (66F), 2020 3rd (63F), 1900,1956 t-4th (62F), 1990,2017 t-6th (61F). _62F ___ Oct 24 ___ 1908 (66F) __ 2017 (67F) __ 2001 3rd (64F), 1900 4th (62F), 1959 5th (61F), 1957 6th (60F), 1975 7th (59F). _58F ___Oct 25 ___ 1908 (69F) __ 1908 (69F) __ 1913 2nd (62F), 1975 3rd (61F), 1899t1900, 1991 (all tied 4th) (58F) (count 0.5). _62F ___Oct 27 ___ 1908 (66F) __ 1908 (66F) __ 2010 2nd (65F), 1900,1920 t-3rd (62F), 1899,1946,1963 t-5th (61F); 1918 8th (60F). _58F ___Oct 29 ___ 1918 (62F) __ 1946 (63F) __ 1947,50,84 t-3rd (61F), 1971,2017 t-6th (60F), 1935 8th (59F), 1900 9th (58F). _55F ___Nov 19 ___ 1906 (57F) __ 1906,2015 (57F)__1900,2003 t-3rd (55F), 1985,2004 t-5th (54F). 1913,57 t-7th (53F). _56F ___Nov 20 ___ 1985 (62F) __ 1985 (62F) __ 1899, 1913 t-2nd (56F), 1941,54,94 t-4th (55F); 1999 7th (53F), 1906,42 t-8th (52F). _49F ___Nov 21 ___ 1902 (51F) __ 1991 (62F) __ 1952 2nd (55F), 1931 3rd (54F), 1983 4th (53F), 1902,13 t-5th (51F), 1914,79,82 t-7th (50F). Summary: There were 19 records set for a count of 17.00. Of the 16 that have since been broken, the average of years breaking them was 1924. If the three other records are broken in 2022, the average will change to 1940. The eventual surplus for the 16 records broken is 5.4 F deg, which reduces to 4.6 if the three surviving records are counted also. _________________________________________
-
Continuing the deep dive into record NYC temps, I plan to examine each 30-year interval (starting with the 1869-1900 starter period) and log the records set in each year. This will give anyone interested in more detailed research or comparisons with UK-Ireland climate some interesting contextual data. For each year, I will mention the numbers of temperature records (including the other types) and the eventual disposition of those records later in the series. If a year has managed to retain some of its record highs as eventual records, there will be a survival rate given and if not, an extinction date of the last record to be broken. Four years (1958, 1992, 2004, 2014) did not set any record highs (had they been starter era years they would have been about middle of the pack, showing that quite a few starter years would likely have been shut out if the NYC records went back as far as the CET records (daily in that set to 1772)). Note: the term "benchmark" is sometimes used -- a benchmark record is not only a daily record but the earliest warm reading in the spring portion of the year, or latest warm reading in the autumn portion. They reverse around mid-January and mid-July. For cold records the concept is the opposite, latest cold reading in spring, earliest in autumn. Also identified where appropriate are monthly extreme values. Further clarification added July 24, 2021 -- work is now complete on logs of all four types of records, so I am extending the discussion and when the NYC file is next updated (after 31 August and the completion of the summer season) these logs will all be available. I expect it to take several weeks or all of August possibly to add these summaries to the various years. For later decades, total counts are compared to random expectations. All 32 years in the starter era 1869-1900 have equal random expectations of setting 11.4 record highs, and retaining 2.3 of them by 2023. Since 1869 and 1870 are not in a full decade, this reporting begins with 1871-80. The two years 1869-70 set a total of 15.83 records compared to an expectation of 22.8. They retained none of these, compared to 4.6 at random. 1869 -- 8 record highs (for 1869-1900) established. All were later broken. The average year of record breaking was 1923. One was tied (1937) before being broken (1955). The average deficit relative to eventual records was 9.1 deg. The extinction date for 1869 record highs was Aug 21, 1955 (after being tied in 1937). Starting from a count of 17.67 in the starter era, by end of data 1869 held eight record low maxima (two later tied, count 6.83). 1869 had nine record lows in the starter interval (count 8.0) and by the end of data had five, two of which are now tied (count 4.0). 1869 had a count of 9.33 high minima in the starter era (average or expected number is 11.4). There were no surviving high minima. The details follow the log of record highs below. Record high maxima (count 8.0, eventual end of data 0.0, extinction by Aug 21 1955) Temp __ date ____ broken ____ eventual end of data record max _54F ___ Jan 8 ____ 1907 (60F) __ 1998 (65F) _54F ___ Jan 30 ___ 1914 (58F) __ 2006 (64F) _61F ___ Feb 13 ___ 1951 (64F) __ 1951 (64F) ___ was second warmest for date to end of data, also mild CET _60F ___ Mar 27 ___ 1903 (67F) __ 1998 (83F) _93F ___ Aug 20 ___ 1937 (95F) __ 1955 (97F) _95F ___ Aug 21 ___ 1955 (96F) __ 1955 (96F) __ was tied in 1937 (and later by non-record 1995), so tied 2nd warmest for date _57F ___ Nov 30 ___ 1908 (62F) __ 1991 (70F) _62F ___ Dec 1 ____ 1908 (64F) __ 2006 (70F) Record high minima (count 9.333 in the starter era, eventual count 0.0, extinction by Apr 24, 1979). Temp __ date ____ broken ______ eventual end of data record max _40F ___ Jan 8 ____ 1907 (43F) ___ 2008 (53F) _39F ___ Jan 15 ___ 1930 (40F) ___ 1995 (54F) ___ tied by 1898 (count 0.5) _41F ___ Feb 9 ____ 1914 (42F) ___ 1989 (44F) _48F ___ Mar 27 __ 1905 (51F) ___ 1949 (61F) _57F ___ Apr 21 ___ 1923 (60F) ___ 1923 (60F) ___ now tied with 2012 as fourth highest for date (1957 59F, 1954 58F). _57F ___ Apr 24 ___ 1979 (59F) ___ 2008 (63F) ___ tied by 1885 (count 0.5), and later by 1913 _60F ___ Apr 27 ___ 1949 (61F) ___ 1949, 2011 (61F) ___ third warmest for date. _58F ___ Apr 28 ___ 1908 (59F) ___ 1990, 2009 (69F) _63F ___ May 12 ___ 1908 (65F) ___ 1959 (67F) __ tied by 1881, 1897 (count 0.333) _78F ___ July 16 ____1952 (80F) ___ 1952 (80F) __ tied by 1901 (count 1.0 for starter era, reduced by 0.5 to 8.833 after 1901) _45F ___ Nov 30 ___ 1908 (49F) ___ 2006 (56F) __ at this point 1869 already reduced to a count of 5.0 (1908 broke three of 11). Summary: 11 records, count 9.333, average year broken 1926, eventual surplus of last record set 7.5 F deg. _________________________________________________________ 1870 -- 10 record highs (for 1869-1900) established. Three were ties before 1900 (another later) and another a three-way tie (count 7.83). All were later broken. The average year of record breaking was 1934. One was tied (1935) before being broken (1938). The average deficit relative to eventual records was 8.1 deg. The extinction date for 1870 record highs was June 28, 1969. By end of data 1870 held only two record low maxima (one later tied, count 1.50). This was the residue of a rather small count of only 4.5 in the starter era. 1870 had only two record lows in the starter era (count 1.33), the lowest year count until 1906 set only one record low, and also 1870 established no surviving record lows It was the only year before 1901 to leave no trace in the eventual record count. The one solo record was Feb 22 which fell to 1918, and the three-way record with 1885 and 1888 on July 3rd became a four-way tie in 1904, these all fell in 1929 (the extinction date for 1870 record low minima), with 1933 the eventual record setter for that date. Also, 1870 had two surviving high minima (77 June 29, 82 July 17), neither had been tied since (76 and 79 closest), but the June 29th value was replaced by 2021 (78F). Count now reduced to 1.0. Record high maxima (count 7.833, eventual end of data 0.0, extinction by June 28 1969) Temp ___ date ____ broken ____ eventual end of data record max _49F ___ Jan 15 ___ 1928 (53F) __ 1932 (67F) ______ tied by 1898 (weakest starter record in Jan) _54F ___ Jan 26 ___ 1913 (56F) __ 1950 (72F) _80F ___ Apr 28 ___ 1938 (89F) __ 1990 (90F) ______ tied by 1935 _86F ___ May 16 ___1951 (87F) __ 1951 (90 F) _94F ___ Jun 25 ____ 1923 (97F) __ 1943,52 (99F) __ tied by 1880, 1898 _94F ___ Jun 28 ____ 1969 (96F) __ 1969,91 (96F) __ tied by 1880 (and later 1963) _92F ___ Jul 23 _____ 1918 (95F) __ 2011 (100F) _91F ___ Jul 24 _____ 1910 (94F) __ 1999,2010 (97F) _85F ___ Sep 24 ____ 1920 (88F) __ 2017 (91F) ____ tied by 1881 _65F ___ Nov 29 ____ 1968 (67F) __ 1990 (69F) Record high minima (count 10.25 in the starter era, eventual end of data 1.0) Temp ___ date ____ broken ____ eventual end of data record max _42F ___ Jan 12 ___ 2006 (45F) ___ 2017 (47F) ___ tied by 1975, count 1.0 for starter era. _36F ___ Jan 18 ___ 1913 (45F) ___ 1915 (47F) ___ tied by 1906,10 - count 1.0 for starter era. _44F ___ Jan 23 ___ 1906 (50F) ___ 1906 (50F) (note: May 16 min 63F edged out by 64F 1879 later tied by 1991, the eventual tied date records) _44F ___ Jan 23 ___ 1906 (50F) ___ 1906 (50F) _74F ___ Jun 19 ___ 1929 (75F) ___ 1993 (76F) _74F ___ Jun 24 ___ 1909 (79F) ___ 2025 (81F) __ tied by 1888, count 0.5 for starter era. (75F 1966, 76F 2010) _77F ___ Jun 29 ___ 2021 (78F) ___ 2021 (78F) __ surviving count reduced from 2.0 to 1.0 with this event. _82F ___ July 17 ___ eventual record high minimum ... (79F 1907, 2013 tied 2nd) _78F ___ July 24 ___ 1999 (79F) ___ 2010 (80F) __ tied by 1972, count 1.0 for starter era. _78F ___ July 26 ___ 1979 (79F) ___ 1979 (79F) __ tied by 1892, count 0.5 for starter era. _44F ___ Nov 28 ___ 1911 (50F) ___ 2011 (56F) __ tied by 1877,79,96, count 0.25 for starter era. Also later tied by 1907. _43F ___ Nov 29 ___ 1905 (49F) ___ 2005 (58F) _43F ___ Dec 5 ____ 1912 (45F) ___ 1973,82 (56F) Summary: 12 records, count 10.25, average year (11) broken 1934, eventual surplus of last record set 7.4 F deg. .. average year broken would become 1941 if one surviving record fell in July 2022. _________________________________________________________________________________________________________ In the decade 1871-80, a total of 103.25 starter records were set, compared to a random expectation of 114.20. Of these, ten have survived, compared to the random expectation of 24.0 (as of end 2022). Five of the ten were in 1880. 1871 -- 10 record highs (for 1869-1900) established. Two were ties by 1900 (another later) (count 9.00). All were later broken. The average year of record breaking was 1939. One was tied (1923) before being broken (1961). The average deficit relative to eventual records was 10.4 deg. The extinction date for 1871 record highs was May 30, 1986. The starter era count was 11.167, and by end of data 1871 held eight record low maxima (one later tied, and another part of a three-way tie including 1869 for July 1, count 6.83). 1871 established a count of 16.0 record lows in the starter era (1869-1900), of which there are now eight surviving record lows, three of which were later tied (count 6.50), and from a meagre count of 4.5 in the starter era, 1871 has one surviving high minimum (55F April 10, tied in 2013, count 0.50). A warmer night in a four-day warm spell as noted below for record highs, on April 9 (62F) survived until 1991 (68F) and remains well separated from third place 55F. Record high maxima (count 9.0, eventual end of data 0.0, extinction by May 30 1986) Temp ___ date ____ broken ____ eventual end of data record max _59F ___ Mar 1 ___ 1902 (63F) __ 1972 (73F) _63F ___ Mar 3 ___ 1961 (64F) __ 2024 (68F) ___ tied by 1923, 1961 t1967 (64F), 1991 (65F) _60F ___ Mar 9 ___ 1913 (65F) __ 2016 (77F) ___ tied by 1878 _61F ___ Apr 7 ___ 1904 (62F) __ 2010 (92F) ___ weak record, 1904 broken by 75F (1908) and that by 89F (1929). _85F ___ Apr 8 ___ 1929 (88F) __ 1991 (90F) _83F ___ Apr 9 ___ 1991 (86F) __ 1991 (86F) ___ second warmest on date to end of data. _80F ___ Apr 10 __ 1922 (86F) __ 1922 (86F) ___ also second warmest on date to end of data. _92F ___ May 30 __ 1986 (94F) __ 1987 (97F) __________ tied by 1942 _90F ___ Jun 4 ____ 1919 (95F) __ 1925 (99F) _76F ___ Oct 23 ___ 1947 (85F) __ 1947 (85F) ___ tied by 1900 Record high minima (count 4.75 in the starter era, eventual end of data 0.50) Temp ___ date ____ broken ____ eventual end of data record max _48F ___ Mar 10 ___ 1955 (51F) ___ 2016 (63F) _41F ___ Mar 30 ___ 1902 (48F) ___ 1998 (59F) __ tied by 1886, 1897, 1898, count 0.25 for starter era. _62F ___ Apr 9 ____ 1991 (66F) ___ 1991 (66F) __ second warmest high minimum for date. _55F ___ Apr 10 ___ eventual record high minimum later tied by 2013 _69F ___ May 30 ___ 1919 (70F) ___ 1987 (74F) __ tied by 1895 (count 0.5 starter era) and later by 1908, 1911 _70F ___ June 8 ___ 1971 (73F) ____ 1984 (77F) __ tied by 1922, 1965, 1966 (count 1.0 starter era) (note 45F on Dec 24 was within 2 of starter era record high min 47F 1895). Summary: 6 records, count 4.75, average year (5) broken 1947, eventual surplus of last record set 9.8 F deg. .. average year broken would become 1959 if one surviving record fell in April 2022. ______________________________________________________________________________________ 1872 -- 15 record highs (for 1869-1900) established. One (June 12) was a tie by 1900 (with 1898, that one and five others were later tied) (count 14.50). All were later broken. The average year of record breaking was 1924. Six were tied (1898/1901, 02, 08, 16/19, 27/32, 1930) before being eventually broken. The average deficit relative to eventual records was 8.0 deg. Also notable were 88 and 89 F on May 9-10, broken in 1896 and for 10th also 1889 (so therefore not starter records). The extinction date for 1872 record highs was Sep 8th, 2015 (this record was tied with 1916 and 1919 by that time). From a starter era count of 17.0, by end of data 1872 held seven record low maxima (one later part of a three-way tie, count 6.33). 10F on March 5th was a monthly record low maximum. There were three record low maxima Dec 24 to 27 with the 25th not quite joining in (13, 15, 12, 15; the 25th held to 1983, 13F). 1872 had a count of 16.0 record lows in the starter era 1869-1900, and from those maintained seven surviving record lows, one of which was later tied (count 6.50), including 3F also on March 5th, lowest minimum for March, and the year has no surviving high minima from its original count of 5.0, 78F on July 2 during a heat wave noted below was also broken by 1901 (82F). Record high maxima (count 14.50, eventual end of data 0.0, extinction by Sep 8 2015) Temp ___ date ____ broken ____ eventual end of data record max _53F ___ Feb 20 ___ 1913 (59F) __ 1930,39 (69F) _57F ___ Feb 24 ___ 1930 (65F) __ 1985 (75F) _62F ___ Mar 29 ___ 1905 (73F) __ 1945 (86F) _______ tied by 1902 _83F ___ Apr 26 ____1942 (84F) __ 2009 (92F) ___ _85F ___ May 8 ____ 1936 (91F) __ 1936,2000 (91F) ____ tied by 1930 _89F ___ Jun 12 ____ 1914 (91F) __ 1933,73,2017 (93F) ____ tied by 1898 and 1901 _93F ___ Jun 30 ____ 1901 (95F) __ 1964 (99F) ___ (note 92F on July 1 broken in 1898, not a starter record) _96F ___ July 2 _____ 1901 (100F)__ 1901,66 (100F) _93F ___ July 5 _____ 1911 (97F) ___ 1999 (101F) _92F ___ Jul 14 _____ 1936 (93F) ___ 1954 (100F) _____ tied by 1927, 32 _93F ___ Aug 14 ____1918 (96F) ___ 1988 (99F) _______ tied by 1908 _91F ___ Aug 18 ____ 1913 (94F) ___ 1913, 1987, 2002 (94F) _92F ___ Aug 19 ____ 1914 (94F) ___ 1914, 1966, 2002 (94F) _93F ___ Aug 22 ____ 1916 (95F) ___ 1916 (95F) _____ third warmest on date (94F 1976 also warmer) _93F ___ Sep 8 _____ 2015 (97F) ___ 2015 (97F) ___ tied by 1916,19 and remains tied second warmest for date Record high minima (count 5.0 in the starter era, eventual end of data 0.0, extinction by May 8, 1930) Temp ___ date ____ broken ____ eventual end of data record max _66F ___ May 8 ___ 1930 (69F) ___ 2000 (70F) ___ tied by 1895, starter era count 0.50 _75F ___ Jun 30 ___ 1908 (76F) ___ 1945,59 (79F) _75F ___ July 1 ____ 1901 (78F) ___ 2018 (79F) _78F ___ July 2 ____ 1901 (82F) ___ 1901 (82F) ___ tied by 1876, starter era count 0.50 _75F ___ Aug 14 ___ 1908 (84F) ___ 1908 (84F) _75F ___ Aug 19 ___ 1906 (77F) ___ 1906,2015 (77F) Summary: 6 records, average year broken 1909, average surplus of eventual records 4.5 F deg. ___________________________________________________________________________________________ 1873 -- Only 6 record highs were (for 1869-1900) established; fourth lowest count 4.25 in the starter period to 1893 (3.00), 1882 (3.50) and and 1875 (3.75). One record high was a four-way-tie by 1900 , and two others were ties within the starter period so the count was 4.25 for the starter record era; one of those two was later tied in 1944 to become a three-way tie and the other tied in 1913 and 1923 to become a four-way tie at that point (to 1926). Another record was tied in 1973. All these 1873 records were eventually broken. The average year of record breaking was 1940. The ties within the interval and in 1973 would change that stat to 1909 in terms of the average year tied or broken. The average deficit relative to eventual records was 7.0 deg. The extinction date for 1873 record highs was July 25th, 1987 (this record was tied with 1885 and 1944 by then). By end of data 1873 held 14 record low maxima (three tied, count 12.50). The most significant of them is probably 29F on Nov 14, an early season benchmark. This was most of the original count of 20.0 in the starter era. 1873 established seven surviving record lows from a count of 12.833 (14 records) in the starter era, one of the seven (May 4 38F) was later tied twice in 1911 and 1917 (count 6.33), the others including -1F on Feb 24 which is the latest subzero reading in the winter season to date, and the year has no surviving high minima from only two starter era records set (46F on Dec 4 survived to 1938). Record high maxima (count 4.25, eventual end of data 0.0, extinction by July 25 1987) Temp ___ date ____ broken ____ eventual end of data record max _92F ___ Jun 19 ___ 1929 (94F) __ 1994 (98F) _94F ___ Jul 25 ____ 1987 (95F) __ 1999 (97F) ___ tied by 1885 and later 1944 _89F ___ Aug 1 ____ 1911 (92F) __ 1933 (100F) ____ tied by 1879, 85 and 87. _92F ___ Aug 3 ____ 1926 (96F) __ 2005 (97F) _____ tied by 1879, and later 1913, 1923. _66F ___ Dec 4 ____ 1978 (67F) __ 1998 (74F) _____ tied by 1973, with 72F 1982 also a record briefly. _61F ___ Dec 12 ___ 1911 (63F) __ 1946 (70F) Record high minima (count 2.0 in the starter era, eventual end of data 0.0, extinction by Dec 4, 1938) Temp ___ date ____ broken ____ eventual end of data record max _63F ___ Oct 19 ___ 1902 (64F) ___ 1905 (68F) ___ (65F in 2016) _46F ___ Dec 4 ____ 1938 (47F) ___ 1998 (59F) ___ tied in 1925. ... at that time 1873 count reduced to 0.5. Summary: 2 records average year broken 1920, average eventual surplus 9.0 F deg. _________________________________________________________________________ 1874 -- Eleven record highs were (for 1869-1900) established; two were ties so the count is 10.00. Two have survived as eventual record highs. That makes the surivival rate 20.0% (as seen from 1900 after the eventual ties). The average year of record breaking for the ten that did not survive was 1926. If the survivors fell next year that would change to 1942. The average deficit relative to eventual records (including the two records) was 8.3 deg but would be 10.1 for the nine that have been beaten. From an original count of 13.5 in the starter era, by end of data 1874 held seven record low maxima (two tied, count 6.00). The most significant of them is 38F on April 29th, a late season benchmark (no date later in the spring had a max lower than 43F). 1874 had a count of 16.33 in the starter era, and established eleven surviving record lows, two of which were later tied (count 10.00), including five near 32F between April 27 and May 3. This was the third best survival rate for record low minima (61.2%) in the starter era, 1891 managed 100% to become the first year never to have a record low later broken, 1890 held on to 77% of its original count. The year has no surviving high minima (from only two starter era records) and even during two notable warm spells in the winter did not set any particularly impressive high minima. Record high maxima (count 10.0, eventual end of data 2.0) Temp ___ date ____ broken ____ eventual end of data record max _58F ___ Jan 4 ____ 1906 (60F) __ 1950 (66F) _59F ___ Jan 5 ____ 1950 (64F) __ 1950 (64F) _56F ___ Jan 7 ____ 1913 (58F) __ 2007 (72F) ____ (note Jan 7 1874 3.12" rain) _63F ___ Jan 23 ___ eventual record .. (second warmest 62F in 1887 and 1906, also 61F 1933, 1967). _66F ___ Feb 22 ___ 1997 (69F) __ 1997 (69F) ____ second warmest reading on date, tied in 1991. _72F ___ Feb 23 ___ eventual record .. (second warmest 70F in 1985, third 65F in 2017, fourth 64F 1922). _58F __ Mar 26 ___ 1904 (65F) __ 2021 (82F) _____ tied by 1903 _98F __ June 29 ___ 1934 (101F) __ 1934 (101F) ____ second warmest reading on date _71F __ Oct 26 ___ 1908 (72F) ____ 1963,64 (78F) ___ tied by 1899 _70F __ Oct 29 ___ 1918 (71F) ____ 1971 (78F) _50F __ Dec 28 ___ 1904 (51F) ____ 1982,2008 (65F) _____ tied by 1887 Record high minima (count 2.0 in the starter era, eventual end of data 0.0, extinction by Feb 20, 1909) Temp ___ date ____ broken ____ eventual end of data record max _ (note: Jan 4 (40F) and Jan 10 (38F) minima both 1 deg lower than starter era records). _39F ___ Feb 20 ___ 1909 (41F) ___ 1939 (48F) ___ tied by 1906 (count for starter era 1.0, reduced to 0.5 in 1906). _42F ___ Mar 18 ___ 1903 (46F) ___ 2011 (51F) ___ next day 47F was one deg below starter era record Summary: Two records, average year breaking them 1906, average surplus of eventual record high minima 9.0 F. ___________________________________________ 1875 -- Only five record highs were (for 1869-1900) established; one was a two-way tie and another a four-way tie so the count is 3.75, lower than each starter year and most later years also, except 1893 (3.0) and some much later into the record with lower expected frequencies. This is not surprising as 1875 was the coldest year on record. The only warm part of the year was the second half of December. None of these four have survived as eventual record highs. The average year of record breaking was 1945. The average deficit relative to eventual records was 12.0 deg. The extinction date for 1875 record highs was Feb 3, 1970. In the starter era, 1875 held 23.83 low maxima, the second highest count to 1888 (26.33). By end of data 1875 held 16 record low maxima (four tied with one other year and one with two others, count 13.33). The most notable spells were in April, with four between 13th and 19th, the 17th-18th 33F and 32F are colder than any later low maxima in any other years by 4 deg, and also Nov 30 with 14F a lower max than any other November day by nine degrees. No day was colder in the interval Dec 1-17 (18th 1919 was 11 F). February 1875 was also generally very cold despite the one mild reading noted below, and provided two records. 1875 was the second coldest year and by 1900 had a count of 26.83 record lows (second only to 1888). These established fifteen surviving record low minima, one of which was later tied (count 14.50), the most significant were three benchmarks (late season outliers) on April 19, 21 and 22 (22, 26, 28F all latest on record), and 5F on Nov 30th, the lowest November reading. Readings of +1F on Jan 18 and -1F on Jan 19th were taken out of the record column by 0F 1982 and -2F in 1994. The year has no surviving high minima from its original count of only 5.0. Record high maxima (count 3.75, eventual end of data 0.0, extinction date Feb 3, 1970) Temp ___ date ____ broken _____ eventual end of data record max _52F ___ Feb 3 ____ 1970 (56F) __ 1991 (64F) _60F ___ Mar 30 ___ 1902 (61F) __ 1998 (82F) _____ tied by 1897 _92F ___ Jun 27 ___ 1941 (94F) __ 1966 (101F) _____ tied by 1876, 1880, 1900. _74F ___ Oct 25 ___ 1963 (79F) __ 1963 (79F) ____ now tied third warmest for date with 1995, 2010 (2001 75F). _59F ___ Dec 22 ___ 1949 (63F) __ 2013 (71F) ____ a higher value 64F on Dec 23rd not a starter record (66F 1891). Record high minima (count 5.0 in the starter era, eventual end of data 0.0, extinction by May 22, 1959) Temp ___ date ____ broken _____ eventual end of data record max _42F ___ Feb 23 ___ 1943 (45F) ___ 1985 (55F) _43F ___ Feb 24 ___ 1915 (46F) ___ 2017 (58F) __ tied by 1909, count 1.0 for starter era. _48F ___ Apr 2 ____ 1918 (49F) ___ 1967 (61F) __ tied by 1910, count 1.0 for starter era. _69F ___ May 22 __ 1959 (72F) ___ 1959 (72F) __ remains second highest minimum for date. _45F ___ Dec 22 __ 1905 (46F) ___ 2013 (61F) Summary: Five records, average year breaking was 1928, average surplus of eventual records 12.0 F deg. ______________________________________________________________________________________________________________________ 1876 -- For its time this was quite a warm year and there were 18 starter record high maxima (for 1869-1900) with 2 two-way ties, 2 three-way ties and one four-way tie, the count was 14.91. Of those, two have survived, both in January. Also, 66 on March 7th was broken by 68F in 1878. The average year of record breaking (for 16 cases) was 1921, if the two January records fell next year that would 1932. The average deficit relative to eventual records was 7.2 deg (8.1 for the records actually broken). From its original count of 8.5, by end of data 1876 held six record low maxima (one tied, count 5.50). December provided three of those. Much of 1876 was quite warm but its cold spells (notably October, December) were robust. 1876 with a count of 13.0 in the starter era established six surviving record low minima, three in October and three more in December and with no later ties (count 6.00). The most significant was 32F on October 15th which is the earliest frost at the location. From a count of 17.0 in the starter era, there are only two surviving high minimum records, one later tied in 1943 (77F on June 28) and another still exclusive (79F July 13th). The count then is 1.50 at end of data. The min on Jan 2 was 46F but the record of 49F was set in 1890, tied 1911. We have now examined eight years and so far only five days share surviving record high mins, and the count is 4.0 (at random should be around 20 by this point). Record high maxima (count 14.91, eventual end of data 2.0) Temp ___ date ____ broken _____ eventual end of data record max _68F ___ Jan 2 ____ eventual record .. (second warmest 63F 1890 tied 1979, fourth 61F 1919). _58F ___ Jan 3 ____ 1913 (59F) __ 2000 (64F) _56F ___ Jan 9 ____ 1932 (62F) __ 1937, 2008 (64F) _60F ___ Jan 10 ___ eventual record .. (second warmest 59F 2016, third 58F 1933 and 2000) _56F ___ Jan 18 ___ 1913 (58F) __ 1973,90 (66F) _59F ___ Jan 19 ___ 1929 (62F) __ 1951 (64F) _87F ___ May 7 ___ 1930 (91F) __ 2000 (93F) _91F ___ Jun 26 ___ 1909 (93F) __ 1952 (100F) ___ tied by 1880, 1891 and later 1901. _92F ___ Jun 27 ___ 1941 (94F) __ 1966 (101F) _____ tied with 1875, 1880, 1900. _98F ___ July 9 ____ 1936 (106F) _ 1936 (106F) _____ now fourth after 1936, 1993 (101F) 1937 (100F). _93F ___ July 11 ___ 1911 (97F) __ 1988 (98F) _92F ___ July 12 ___ 1908 (96F) __ 1966 (99F) ___ tied by 1905. _93F ___ July 13 ___ 1916 (94F) __ 1966 (101F) ____ tied by 1894. _94F ___ July 19 ___ 1905 (95F) __ 1977 (102F) ____ tied by 1904. _93F ___ July 20 ___ 1923 (99F) __ 1980 (101F) ____ tied by 1895. _90F __ Aug 15 ___ 1938 (96F) ____ 1988 (97F) ____ tied by 1928, 1936 _73F ___ Nov 2 ____ 1929 (76F) __ 1950 (83F) _67F ___ Nov 3 ____ 1903 (68F) __ 2003 (79F) ____ tied by 1886, 1892. Record high minima (count 17.0 in the starter era, eventual count at end of data 1.5) Temp ___ date ____ broken _____ eventual end of data record max _44F ___ Jan 1 ____ 1966 (52F) ___ 1966 (52F) ___ tied by 1952. _41F ___ Jan 3 ____ 1950 (43F) ___ 2000 (51F) ___ tied by 1897, count for starter era 0.5. _47F ___ Jan 9 ____ 1937 (50F) ___ 1937 (50F) ___ now tied 2nd highest for date with 1998 and 2008. _40F ___ Jan 19 ___ 1942 (43F) ___ 1986 (45F) ___ tied by 1880, count for starter era 0.5, later tied also by 1933. _39F ___ Feb 10 ___ 1960 (41F) ___2024 (47F) __ also 2023 (45F), 1999 (43F), 2020 (42F) _________ 1876 tied by 1881, 1893, count for starter era 0.33, later tied also by 1925,56. _42F ___ Feb 12 ___ 1966 (45F) ___ 1966 (45F) ___44F (1984, 1998, 2009) since record also warmer than 1876. _42F ___ Mar 7 ____ 1974 (48F) ___ 2009 (51F) ___ tied by 1951. _68F ___ May 29 ___ 1929 (69F) ___ 1969 (74F) _70F ___ June 9 ____ 1922 (72F) ___ 1984 (77F) __ tied by 1882, 1898, count for starter era 0.333. _77F ___ June 28 ___ eventual record high minimum tied later by 1943 ... (76F 1880, 1966, 2010, 2021 tied 3rd) _78F ___ July 2 ____ 1901 (82F) ___ 1901 (82F) __ tied 1872, count for starter era 0.5 _81F ___ July 3 ____ 2002 (82F) ___ 2002 (82F) __ remains second warmest high minimum for date. _78F ___ July 4 ____ 1999 (79F) ___ 2002 (81F) __ 1876 tied by 1908, 1974 and 1983 (these four remain tied 3rd warmest). _75F ___ July 8 ____ 1929 (77F) ___ 1993 (80F) __ tied by 1900, starter era count 0.5, later also tied by 1921. _76F ___ July 9 ____ 1905 (78F) ___ 1981 (80F) __ tied by 1878 and 1885, starter era count 0.333 _76F ___ July 12 ___ 1905 (79F) ___ 1905 (79F) _79F ___ July 13 ___ eventual record high minimum ... (78F 1908, 1966, 1981 tied 2nd) _76F ___ July 14 ___ 1952 (78F) ___ 1952 (78F) __ tied by 1905, starter era count 1.0. (77F 1966, 1995). _78F ___ July 20 ___ 1930 (81F) ___ 2015, 19 (82F) _77F ___ Aug 7 ____ 1906 (78F) ___ 1918 (82F) _59F ___ Nov 2 ____ 1929 (64F) ___ 1971 (67F) Summary: 21 records, five tied once and two tied twice in starter era, average year breaking (19) of them 1942, average surplus of eventual record 5.2 F deg, and if the two surviving records fell in 2023, then the average year would shift to 1950. _____________________________________________________________________________________ 1877 -- There were just eight starter record high maxima (for 1869-1900) with 3 two-way ties, so the count is 6.50. All have been broken. The average year of record breaking was 1916, and the average deficit relative to eventual records was 8.1 deg. The extinction date for 1877 records was Feb 12, 1932. This makes 1877 the first starter era year to lose all its records set. However, 1909 was fully extinct by Feb 19, 1930, so 1877 was not the first year to lose all its records. From a relatively small starter era count of 5.5, by end of data 1877 held just three record low maxima (one tied, count 2.50). 1877 had a relatively small count of 4.0 record lows (five with two ties) in the starter era and established just one surviving record low minima (58F July 14), now tied by two other years (1888, 1926) for a count of 0.33. This is the second lowest eventual record count for low minima in the starter era (1870 had zero). There were also no surviving record high minima from the original count of 6.25 in the starter era. Record high maxima (count 6.50, eventual end of data count 0.0, extinction date Feb 12, 1932) Temp ___ date ____ broken _____ eventual end of data record max _53F ___ Feb 1 ____ 1916 (60F) __ 1989 (67F) _49F ___ Feb 2 ____ 1922 (51F) __ 1988 (59F) _54F ___ Feb 12 ___ 1932 (56F) __ 1999,2018 (62F) ____ tied with 1880 _88F ___ May 18 ___ 1906 (90F) __ 2017 (92F) _87F ___ May 20 ___ 1903 (89F) __ 1996 (96F) ____ tied with 1887 _90F ___ Aug 29 ___ 1926 (93F) __ 1953 (99F) _____ tied with 1895 _85F ___ Sep 14 ___ 1903 (88F) __ 1931 (93F) _57F ___ Dec 5 ____ 1916 (63F) __ 2001 (70F) Record high minima (count 6.25 in the starter era, eventual end of data count 0.0, extinction date Feb 3, 1983) Temp ___ date ____ broken _____ eventual end of data record max _41F ___ Feb 1 ____ 1916 (42F) __ 1988 (50F) _39F ___ Feb 2 ____ 1922 (40F) __ 1952 (42F) __ tied by 1903 (count 1.0 for starter era). _38F ___ Feb 3 ____ 1983 (45F) __ 1999, 2006 (46F) __ tied by 1890, count 0.5 for starter era, and later tied by 1903. _69F ___ May 17 ___1906 (70F) __ 1906 (70F) __ remains second warmest high min for date. (66F 1974 third). _65F ___ May 19 ___1903 (67F) __ 1986 (68F) __ tied by 1889, count 0.5 for starter era. _70F ___ June 3 ____ 1943 (75F) __ 1943 (75F) __ now tied second warmest high min for date with 1960. _46F ___ Nov 25 ___ 1908 (54F) __ 1979 (62F) _44F ___ Nov 28 ___ 1911 (50F) __ 2011 (56F) __ tied with 1870, 1879, 1896, count 0.25 (later tied also by 1907). Summary: Eight records, average year broken 1924, average surplus of eventual record 7.1 F deg. ________________________________________________________________________ 1878 -- Despite this being quite a warm year for the era, only ten record highs were set (for 1869-1900) and with three 2 two-way ties and one three-way tie the count is 7.83. All these records have been broken. The average year of record breaking was 1917, and the average deficit relative to eventual records was 10.4 deg. The extinction date for 1878 record highs is Mar 7th, 1946. By end of data 1878 held five record low maxima (three tied, count 3.50). This was almost all of the original set (count 4.0), as one of the original records (Nov 6, 38F) was tied in 1953 to reduce the end count by 0.5. So 1878 became the first year not to have a record low maximum later broken by any other year. 1878 with a count of just 7.0 record low minima in the starter era established three surviving record low minima with no ties for a count of 3.00. There were no surviving record high minima, although several spells of quite warm nights for that era, for example, 47F March 3 (broken by 48F in 1991 and the eventual record of 49F in 2020), 81F on July 19th (broken by 83F in 2013), and 65F on Oct 17 (broken by 67F 1928). In fact the count for the starter era was 15.833, which ranked 8th of the 32 starter years. Record high maxima (count 7.833, eventual end of data count 0.0, extinction date Mar 7, 1946) Temp ___ date ____ broken _____ eventual end of data record max _56F ___ Feb 28 ___ 1903 (62F) __ 1976 (67F) _____ tied by 1880 _68F ___ Mar 7 ____ 1946 (74F) __ 1946 (74F) _65F ___ Mar 8 ____ 1942 (69F) __ 1987 (76F) _60F ___ Mar 9 ___ 1913 (65F) __ 2016 (77F) ___ tied by 1871 (note 68 on Mar 10 broken by 69 in 1879). _60F ___ Mar 23 __ 1902 (64F) __ 1923, 2012 (76F) ___ tied by 1889, 1897. _84F ___ May 3 ___ 1913 (89F) __ 2018 (92F) _79F ___ Oct 2 ____ 1922 (88F) __ 2019 (93F) _77F ___ Oct 17 ___ 1908 (78F) __ 1938 (90F) _60F ___ Dec 2 ____ 1912 (61F) __ 1970 (66F) _60F ___ Dec 10 ___ 1911 (61F) __ 1946 (70F) ____ tied with 1885 Record high minima (count 15.833 in the starter era, eventual end of data count 0.0, extinction date July 19, 2013) Temp ___ date ____ broken _____ eventual end of data record max _41F ___ Jan 21 ___ 1906 (49F) __ 1906 (49F) _41F ___ Jan 22 ___ 1906 (47F) __ 1906 (47F) _37F ___ Jan 26 ___ 1913 (40F) __ 1916 (49F) ___ tied by 1911 _47F ___ Mar 3 ___ 1991 (48F) __ 2020 (49F) _47F ___ Mar 8 ___ 1987 (54F) __ 1987 (54F) ___ tied by 1903 _41F ___ Mar 9 ___ 1901 (43F) __ 2000 (48F) _45F ___ Mar 14 __ 1927 (46F) __ 1953 (51F) ___ tied by 1913 _37F ___ Mar 15 __ 1903 (43F) __ 2024 (51F) ___ also 1913, 2019 (49F) _46F ___ Apr 7 ____ 1903 (48F) __ 1991 (63F) _49F ___ Apr 11 ___ 1915 (52F) __ 2017 (61F) ___ tied with 1898, count for starter era 0.5 _65F ___ May 4 ____1942 (68F) __ 2018 (72F) _76F ___ July 9 ____ 1905 (78F) ___ 1981 (80F) __ tied by 1876 and 1885, starter era count 0.333 _76F ___ July 10 ___ 1905 (79F) ___ 1993 (80F) __ tied by 1903 _81F ___ July 19 ___ 2013 (83F) ___ 2013 (83F) __ remains second warmest for date _74F ___ Aug 18 ___ 1955 (75F) ___ 2002 (78F) __ tied by 1901, 1913, 1939. (note: 75F, 76F and 75F Sep 1-3 all lower than 1898 starter and all-time record values) _65F ___ Oct 17 ___ 1928 (67F) ___ 1928 (67F) __ tied second warmest for date with 1947. _46F ___ Dec 10 ___ 1907 (50F) ___ 1946, 1966 (54F) Summary: 17 records were broken on average by 1929. The average surplus of eventual records was 7.1 F deg. ___________________________________________________________________________________________ 1879 -- This was a generally warm year and 20 record highs were set (for 1869-1900) and with three 2 two-way ties, one three-way tie and one four-way tie, the count was 17.08 (by 1900). (edit Dec 12, 2021) One of these records has not been broken for a survival percentage of 5.8%. The average year of record breaking was 1935, but if the one surviving records was to fall in 2022, the average year of record breaking would move to 1940. The average deficit relative to eventual records was 8.5 deg but for the nineteen that have been broken, the average is 9.2 deg. October 1879 was a very warm month, and several other days missed starter record status by 1-2 deg, notably 83F on 16th (87F in 1897 is the only reading on that date higher in all of the subsequent years, 1879 now tied second with 1958, 63). Also, a reading of 83F on May 13 was one short of the starter record of 84F (1900). From its starter era count of 12.17, by the end of data 1879 held nine record low maxima (none tied, count 9.00). The most significant spell was in early November between two very warm intervals, with three days of highs in the mid 30s F (Nov 3-5) setting early season benchmarks (35 4th-5th). 1879 managed a count of 14.667 record lows in the starter era, and of those established nine surviving record low minima with one tie for a count of 8.50. Four were in November. Despite a starter era count of 15.25, there was only one surviving record high minimum (64F tied with 1991 for May 16), and nights in the October to December warm spells often came within 3-5 F deg of later daily records, probably with today's urban situation there would have been numerous high min records set in those intervals). Record high maxima (count 17.083, eventual end of data count 2.0) Temp ___ date _____ broken _____ eventual end of data record max _49F ___ Jan 25 ____ 1909 (52F) __ 1967 (60F) _69F ___ Mar 10 ___ 1955 (71F) __ 2016 (79F) _66F ___ Mar 11 ___ 1955 (67F) __ 1977 (73F) _56F ___ Mar 14 ___ 1903 (70F) __ 1946 (75F) _76F ___ Apr 30 ___ 1901 (80F) __ 1942 (91F) ___ tied by 1899 _95F ___ July 15 ___ 1977 (96F) __ 1995 (102F) _98F ___ July 16 ___ 1980 (99F) __ 1980 (99F) ___ tied by 1977 and remains tied second warmest for date. _89F ___ Aug 1 ____ 1911 (92F) __ 1933 (100F) ____ tied by 1879, 85 and 87. _92F ___ Aug 2 ____ 1917 (98F) __ 1955 (100F) _92F ___ Aug 3 ____ 1926 (96F) __ 2005 (97F) _____ tied by 1873, and later 1913, 1923. _85F ___ Oct 3 ____ 1919 (87F) __ 1919 (87F) ______ third warmest for date (86F 1922 second). _82F ___ Oct 9 ____ 1916 (86F) __ 1916 (86F) _76F ___ Nov 12 ____ eventual record .. (second warmest 73F 1909, third 72F 1912, fourth 70F 1927, 38). _69F ___ Nov 13 ____ 1931 (73F) __ 1931 (73F) ___ third warmest for date (71F 1964 second). _61F ___ Nov 14 ____ 1902 (63F) __ 1993 (72F) _73F ___ Nov 15 ____ 1973 (77F) __ 1993 (80F) ___ remains third warmest for date _55F ___ Dec 3 _____ 1912 (56F) __ 1998 (69F) ___ tied by 1891, 1899. _59F ___ Dec 6 _____ 1912 (64F) __ 2001 (71F) _58F ___ Dec 7 _____ 1932 (63F) __ 1998 (75F) ___ tied by 1884 and later 1911. _64F ___ Dec 11 ____ 2021 (66F) __ 2021 (66F) ___ (third warmest 63F 1897, 1971 and 1979). Record high minima (count 15.25 in the starter era, eventual end of data count 0.5) Temp ___ date _____ broken _____ eventual end of data record max _41F ___ Jan 28 ___ 1947 (42F) ___ 2002,18 (46F) _41F ___ Mar 11 ___ 1903 (43F) ___ 1967,77 (50F) ___ tied by 1898, starter era count 0.5 _55F ___ Apr 30 ___ 1903 (63F) ___ 1903 (63F) ___ tied by 1899, starter era count 0.5 _64F ___ May 13 ___ 1956 (69F) ___ 1956 (69F) ___ tied by 1906 and 1942. _63F ___ May 14 ___ 1909 (65F) ___ 1909 (65F) ___ tied by 1900, starter era count 0.5 _64F ___ May 16 ___ eventual record high minimum tied by 1991 __ (63F 1870, 1876, 1932, 1974, 2004 tied third warmest). _70F ___ June 11 ___ 1967 (71F) ___ 1984 (77F) ___ tied by 1883 (starter era count 0.5) and later 1927. _75F ___ Aug 2 _____ 1933 (80F) ___ 2006 (83F) _76F ___ Aug 3 _____ 1926 (77F) ___ 1975, 2006 (78F) _66F ___ Oct 2 _____ 1905 (67F) ___ 1954 (72F) _68F ___ Oct 11 ____ 2017 (71F) ___ 2017 (71F) ___ tied by 1990, remains tied second warmest for date (2018 also 68F). _65F ___ Oct 12 ____ 1922 (67F) ___ 2018 (71F) ___ tied by 1919. _50F ___ Nov 12 ____ 1902 (52F) ___ 2022 (60F) __ tied by 1882, starter era count 0.5. (1912,35 56F, 1982 55F, 1909 54F) _51F ___ Nov 13 ____ 1909 (59F) ___ 1909 (59F) _50F ___ Nov 14 ____ 1909 (53F) ___ 1951 (58F) _58F ___ Nov 15 ____ 1989 (61F) ___ 1989 (61F) __ remains tied second warmest (2008 also 58F). _44F ___ Nov 28 ____ 1911 (50F) ___ 2011 (56F) __ tied with 1870, 1877, 1896, count 0.25 (later tied also by 1907). _44F ___ Dec 3 _____ 1902 (47F) ___ 1998 (53F) __ tied with 1899, starter era count 0.5 _43F ___ Dec 6 _____ 1912 (48F) ___ 2001 (58F) Summary: 19 records, average for 18 broken by 1929, average surplus of 7.3 F deg. If the one surviving record fell next May, the average year breaking 1879 records would change to 1934. ___________________________________________________________________________ 1880 -- This was another generally warm year (until Nov-Dec) and 21 record highs were set (for 1869-1900) and with four 2 two-way ties, two three-way ties and one four-way tie, the count was 16.41 (by 1900). Five of these records have not been broken, for a survival percentage of 29%. The average year of record breaking was 1935, but if the five surviving records were to fall later this year or next year (Feb 29 cannot fall until 2024 at earliest), the average year of record breaking would move to 1957. The average deficit relative to eventual records was 5.7 deg but for the 16 that have been broken, the average is 7.4 deg. The two warm spells of late Feb-early Mar and late May remain among the more notable overall. From a starter era count of 15.5, 1880 established seven new low maximum records with one tie, and the end of data count was 6.5 ... most of these were in late November, still considered to be one of the most anomalous cold spells in the period of record. New early season benchmark of 23F (Nov 22) was one of five daily records set 19th to 26th. A max of 4 on Dec 30 was later broken in 1917 but is otherwise the second coldest December maximum and tied second coldest of any month with Feb 5, 1918. UK readers note that all this severe cold in eastern North America came just before a very cold and snowy period in mid-January 1881. 1880 had a count of 18.5 record low minima (21 with five ties) in the starter era, and established eight surviving record low minima with one two-way tie and a five-way tie with the other four years after the starter era had ended (June 2, 48F tied 1907,29,45,46) for a count of 6.70. Four were in November, with Nov 22 to 24 recording 13F, 14F and 14F. A reading of -6F on Dec 30 was removed by the -13 of 1917. Eight of the later broken 1880 records also came from Nov-Dec so that almost all of the year's production of record low minima came after mid-October. From an original count of 16.0 in the starter era, there are four surviving record high minimum readings associated with the record high maxima, and these are 47F on Feb 13, 51F on Mar 4, and 73F, 72F on May 25-26 (the latter tied in 2018) for a count of 3.50. May 27 also 72F was later broken by 74F in 1908. The late June hot spell also produced near-record values of 77F on June 25-26. Record high maxima (count 16.417, eventual end of data count 5.0) Temp ___ date _____ broken _____ eventual end of data record max _53F ___ Jan 27 ____ 1916 (69F) __ 1916 (69F) _65F ___ Jan 28 ____ 1916 (66F) __ 1916 (66F) ___ remains second warmest, 2002 (60F) third warmest. _51F ___ Jan 31 ____ 1913 (61F) __ 1916,47 (63F) _54F ___ Feb 12 ___ 1932 (56F) __ 1999,2018 (62F) ____ tied with 1877 __ 58F 13th was 3 short of 1869's 61F _68F ___ Feb 27 ___ 1997 (72F) __ 1997 (72F) ____ remains second warmest, 1976 (67F) third warmest. _56F ___ Feb 28 ___ 1903 (62F) __ 1976 (67F) _____ tied by 1878 _69F ___ Feb 29 ____ eventual record .. (second warmest 66F 1976, third warmest 61F 2016). _69F ___ Mar 4 ____ 1974 (70F) __ 1974 (70F) _____ tied by 1946, remains tied second warmest for date. _72F ___ Mar 5 ____ eventual record .. (second warmest 71F 1964, third warmest 70F 1961, 1976). _80F ___ Apr 14 ___ 1941 (85F) __ 2023 (91F) _____ fourth warmest for date (1945 83F third warmest). _84F ___ May 6 ___ 1918 (90F) __ 1949, 86 (92F) _86F ___ May 24 __ 1936 (92F) __ 1975 (93F) ____ tied by 1884, 1904, 1912. _95F ___ May 25 ___ eventual record .. (second warmest 93F 1991, third warmest 90F 2017). _95F ___ May 26 ___ eventual record .. (second warmest 94F 1914 and 1965). _96F ___ May 27 ___ eventual record .. (second warmest 95F 1914, third warmest 92F 1965). _94F ___ Jun 25 ___ 1923 (97F) __ 1943,52 (99F) __ tied by 1870, 1898 _91F ___ Jun 26 ___ 1909 (93F) __ 1952 (100F) ___ tied by 1876, 1891 and later 1901. _92F ___ Jun 27 ___ 1941 (94F) __ 1966 (101F) _____ tied with 1875, 1876, 1900. _94F ___ Jun 28 ___ 1969 (96F) __ 1969,91 (96F) __ tied by 1870 (and later 1963) _78F ___ Oct 12 ___ 1928 (86F) __ 1928, 54 (86F) ___ tied by 1886 _68F ___ Nov 11 ___ 1949 (74F) __ 1949 (74F) _____ tied third warmest with 2002 (2020_72F now second). Record high minima (count 16.0 in the starter era, eventual end of data count 3.5, extinction date July 19, 2013) Temp ___ date ____ broken _____ eventual end of data record max _39F ___ Jan 10 ___ 1933 (47F) __ 1933 (47F) ___ several other warmer Jan 10 min since 1933 (incl 45 1972, 44 2000). _40F ___ Jan 19 ___ 1942 (43F) ___ 1986 (45F) ___ tied 1876, count for starter era 0.5, later tied also by 1933. _38F ___ Jan 27 ___ 1911 (42F) ___ 1916 (53F) _47F ___ Feb 13 ___ eventual record high minimum __ second highest 45F 1882, third 44F 1951. _43F ___ Feb 18 ___ 1981 (48F) ___ 1981 (48F) ___ now third highest (2011 second, 46F). _43F ___ Feb 26 ___ 1951 (46F) ___ 1976 (49F) ___ tied by 1890, count for starter era 0.5. _44F ___ Feb 28 ___ 1903 (47F) ___ 1903, 1910, 2017 (47F) (note: 46F on Feb 29 was one degree below tied 1896, 2016). _51F ___ Mar 4 ___ eventual record high minimum __ 2nd highest 46F 2024, t3 45F 2008, 2020, t5th 44F 1923, 1961, 2004. _48F ___ Mar 5 ___ 1974 (49F) ___ 1979 (50F) ___ tied by 1919 _46F ___ Mar 23 __ 1903 (47F) ___ 2012 (58F) _56F ___ May 3 ___ 1913 (67F) ___ 2018 (70F) ___ tied by 1894, starter era count 0.5, also later tied by 1910. _73F ___ May 25 __ eventual record high minimum __ second highest 71F 1955, 1991. _72F ___ May 26 __ eventual record high minimum tied later by 2018 __ tied third highest 71F 1981, 2007. _72F ___ May 27 ___ 1908 (74F) ___ 1908 (74F) __ now third highest, 2016 was 73F. _71F ___ June 12 ___ 1942 (72F) ___ 2017 (76F) __ tied by 1898 (starter era count 0.5) and later tied also by 1914, 1939. _77F ___ June 25 ___ 1909 (78F) ___ 2025 (81F) __ tied by 1882 (count 0.5, they remain tied third highest for date). _77F ___ June 26 ___ 1943 (78F) ___ 1952 (81F) __ tied by 1909. _75F ___ Sept 6 ____ 1910 (77F) ___ 1985 (78F) __ tied by 1890 (starter era count 0.5). _53F ___ Nov 11 ____ 1931 (54F) ___ 2020 (64F) Summary: 19 records, average (15) broken by 1930. The average surplus of eventual records is 6.6 F deg (5.2 if four unbroken included). ... if the four surviving records fell in 2022, then the average year breaking 1880 records would become 1948. ______________________________________________________________________________________
-
Daily record maxima now and in past intervals for NYC This section will be a log of record daily high temps for NYC, both in the overall data set 1869-2023, and from the perspective of each year at its conclusion. This analysis may give some background for determining how changes are actually comparable to, or different from, past experiences. I start with the interval 1869-1900 (inclusive) and determine a "starter record" for that 32 year interval. This would have been the record high going into the year 1901. Then for each year, I adjust the list and show the records that existed at the end of each year. The expected number of records will drop gradually going forward. During the starter interval, it is a constant 11.4 (leap years 11.43, regular years 11.41). Then with each passing year, you would expect at random in a steady-state climate that the numbers would gradually fall off because it gets a bit more difficult each year to surpass records as they increase (which is by definition what they have to do). The count is adjusted for ties, so when a year ties a previous year, its count for that date is 0.5. If it's a third tie then the count is 0.33, and in the few four-way ties that exist, 0.25. (No five-way ties were detected). NYC temps are recorded to nearest whole Fahr degree, so no decimals come into play. I have done this same analysis for Toronto (in the excel file, not in this thread) using 1840-70 as the starter record interval, and the analysis looks quite similar, but it's a bit more complicated by the fact that potential records after 1977 are in tenths of a degree Celsius whereas the record to 1977 was like NYC, whole Fahr degrees. That created a few "pseudo-ties" which were only ties when the Celsius value was converted to a whole Fahr number (but this affected only about a half dozen cases, the rest were more clear cut). Four years in the entire NYC record failed to set a new daily record, those being 1958, 1992, 2004 and 2014. Quite a few others set records that have since been broken in all cases, most of the earlier years have had their record harvest culled considerably but a few survive. The ratio of surviving records to the original records (at end of year) is a percentage that I call "survival ratio." This tends to increase towards nearly 100% in the last thirty years although some records set as recently as 2017 have already fallen. Another interesting parameter to track is the longest surviving record for years that have now lost all of their original set. In this analysis, any starter record ties within the interval 1869-1900 are adjusted as explained in the count, and if a starter record survives as a tie then the survival count is adjusted. That is also true for later records except that once we pass 1901, the adjustments occur right away as ties are created, but not retroactively, so let's say 1901 ties 1966 (as happened in a July heat wave) then 1901 gets 1.0 in its "original record" count and 1966 gets 0.5 at that point, but both get 0.5 in the survival totals. Two days of the year had four-way ties for the eventual records, both in late July (28th, 30th) and eight cases of three-way ties are noted, 48 others are now two-way ties. That leaves 308 days of the year with a single exclusive record high. This is a table of the count of surviving record highs as of (edit) Apr 13 2023 (2021 has two records now, Mar 26 replaced 1922, and Dec 11 replaced 1879 and 2022 has a count of 3.0 from one February record replacing 1976, two March records tying 1935 and 1946, and one November record replacing a tie from 1948 and 2015; 2023 has two tied records from January and February and two new exclusive ones for Apr 6th and 13th). The decade totals are for ten years that can be referred to as "the forties, the fifties" etc, e.g. 1940-49 rather than the more familiar 1941-50. I do show the more traditional decade counts beside this table's results. The main finding here is that the 1940s had a similar rate to recent warmer decades, with the 1960s and 1970s somewhat lower. The count of surviving records is now sparse before 1910 and picks up considerably thereafter. It should be noted that in a "steady state" climate one would expect these numbers to vary around a fixed mean of 2.4 per year (there is no reason to expect a trend in any direction) so actual trends presumably tell us information about the changing climate. I am generally leaving out the reasons for this as I want these NYC and Toronto data sets to be available for anyone to make their own analysis without me setting any expectations or biases. But I think this analysis is valuable because up until now I had not seen anything very similar to what follows, the log of the gradually changing totals as seen from earlier points in time. (35.41 records from the starter period 1869-1900 survive, this being the result of 30 exclusive records maintained, nine shared (4.5), two three-way ties (0.67) and one four-way tie (0.25). This interval should have kept closer to double that number at random. The only years in the starter period to have done relatively well at maintaining records are 1880, 1881 and 1895.) <<< SURVIVING DAILY RECORD MAXIMUM COUNT for NYC >>> decade ____00 ___01 ___02 ___03 ___04 ___05 ___06 ___07 ___08 ___09 ______ total ____ total 01-next 00 decade ____00 ___01 ___02 ___03 ___04 ___05 ___06 ___07 ___08 ___09 ______ total ___ total 01-next 00 1860s _____ .... no data until last entry (1869) . .... .... .... .... .... ... . 0.00 _____ 0.00 _____ 0.00 1870s _____ 0.00_ 0.00_ 0.00_ 0.00_ 2.00_ 0.00 _2.00_ 0.00_ 0.00_ 1.00 ____ 5.00 _____10.00 (1871-80) 1880s _____ 5.00_ 5.00_ 0.00_ 0.00_ 0.00_ 0.00_ 0.00_ 0.00_ 0.50_ 0.00 ____10.50 _____7.00 (1881-90) 1890s _____ 1.50_ 3.33_ 1.25_ 0.00_ 0.00_ 6.83_ 1.00_ 1.00_ 0.00_ 0.50 ____ 15.41 ___ 16.91 (1891-1900) 1900s _____ 3.00_ 1.50_ 0.00_ 0.00_ 0.00_ 0.00_ 0.00_ 1.00_ 0.00_ 0.00 _____ 5.50 ____ 2.50 (1901-10) 1910s _____ 0.00_ 0.00_ 0.00_ 0.33_ 0.83_ 4.00_ 6.00_ 1.25_ 2.00_ 2.00 ____ 16.41 ___ 18.41 (1911-20) 1920s _____ 2.00_ 2.50_ 1.00_ 2.50_ 0.00_ 4.00_ 0.00_ 4.00_ 4.00_ 3.00 ____ 23.00 ___ 22.50 (1921-30) 1930s _____ 1.50_ 7.25_ 3.00_ 5.58_ 1.00_ 0.50_ 2.50_ 1.00_ 2.00_ 2.00 ____ 26.33 ___ 26.58 (1931-40) 1940s _____ 1.75_ 5.00_ 1.00_ 0.50_ 6.50_ 5.00_ 5.50_ 2.00_ 4.00_ 7.58 ____ 39.33 ___ 41.08 (1941-50) 1950s _____ 4.00_ 3.50_ 2.50_ 8.00_ 3.50_ 4.83_ 3.00_ 1.00_ 0.00_ 1.50 ____ 31.83 ___ 28.33 (1951-60) 1960s _____ 0.50_ 3.50_ 1.33_ 4.00_ 2.50_ 1.00_ 6.83_ 3.00_ 0.00_ 2.00 ____ 24.66 ___ 26.66 (1961-70) 1970s _____ 2.50_ 2.00_ 3.00_ 2.67_ 3.00_ 3.50_ 3.00_ 4.00_ 0.00_ 5.00 ____ 28.67 ___ 28.50 (1971-80) 1980s _____ 2.33_ 2.00_ 1.00_ 2.50_ 2.50_ 3.50_ 1.50_ 2.33_ 7.08_ 1.50 ____ 26.24 ___ 31.91 (1981-90) 1990s _____ 7.83_ 7.50_ 0.00_ 5.00_ 1.33_ 2.00_ 2.00_ 3.00_ 7.00_ 3.58 ____ 39.24 ___ 34.74 (1991-2000) 2000s _____ 3.50_ 9.17_ 4.00_ 1.00_ 0.00_ 2.00_ 3.50_ 3.00_ 3.00_ 2.00 ____ 31.17 ___ 31.17 (2001-2010) 2010s _____ 3.50_ 3.50_ 2.00_ 2.00_ 0.00_ 6.00_ 3.00_ 3.33_ 3.00_ 1.00 ____ 27.33 ___ 28.33 (2011-2020) 2020s _____ 4.50_ 2.00_ 2.00_ 3.83 _2.50_ 1.50 ..... future years ........ .... ___16.33 ____11.83 (2021-2030) _____________________________________________________ Now for comparison, the count of record highs at the end of each year, before most of them were broken later. For 1869-1900, ties are within that 32-year cohort. There were probably a few cases where one near-record was broken by another so that people living in that year might have noted a few additional records. The count from 1901 to present time is the adjusted count (e.g., a tied record in 1901 tying previous years counts 0.5, a tied record later in the set counts 1.0). <<< ORIGINALLY SET DAILY RECORD MAXIMUM COUNT for NYC (starter period 1869-1900) >>> In this compilation, the expected numbers at random are 11.4 per year to 1900 and then slowly decline to 2.4 at end of the set. Instead of the second decade total, an expected total is given, with that compared to the actual total as a surplus or deficit from the expected numbers at random. It should be inferred that "expectation" here applies to the period elapsed to the years in question, and for 1869-1900 it is structured to be random over that interval, so the only variability explored to 1900 is the decade by decade outcomes. decade ____00 ___ 01 ___02 ___ 03 ___04 ___ 05 ___06 ___ 07 ___08 ___ 09 ____ total ___ random__surplus/deficit 1860s _____ .... no data until last entry (1869) . .... .... .... .... .... .... .... 8.00 ____8.00 _____ 11.41 ___ -3.41 1870s _____ 7.83_ 9.00_14.50_ 4.25_10.00_ 3.75_ 14.92 _ 6.50 _ 7.83_ 17.08 ___95.66 ____114.20 ___-18.64 1880s _____16.42_15.00_ 3.50_ 8.00_12.00_ 7.25 _ 13.83_ 9.25_ 10.00 _ 8.83__ 104.08____114.70 ___-10.62 1890s _____17.00_16.67_12.33_ 3.00_ 8.00 _22.00_ 20.50_7.83_ 15.83_ 16.33__ 139.49____114.20 __ +25.29 1900s _____18.75_ 7.58_ 8.00_ 17.00_ 7.83 _12.83_ 9.83 _ 8.00_ 10.00 _ 3.00 __ 102.82____100.40 ___ +2.42 1910s _____ 7.50_12.33_ 9.25_ 25.33_10.50_ 12.00_15.50_ 5.00_ 15.50_ 15.33 ___128.24 ___78.70 __ +49.54 1920s _____ 6.00_17.00_ 7.33_ 10.57 _ 6.50 _ 7.50 _4.50_ 13.50 _ 11.50_ 13.00 ___ 97.40____64.50 __ +32.90 1930s _____15.50_16.50_ 8.83_ 13.33_ 6.50 _ 5.00_12.83 _ 5.50_ 15.50 _ 7.33___106.82 ____54.80 __ +52.02 1940s _____ 3.33_12.50 _ 6.00 _ 5.00_10.17_ 14.17_ 12.50 _ 9.33 _ 7.67 _14.33 ___95.00 ____ 48.00 __ +47.00 1950s _____ 7.83 _ 7.00 _ 6.00 _10.00_ 5.83 _10.00 _ 4.00 _ 2.00 _ 0.00_ 4.75 ___57.41 ____ 43.80 __ +13.61 1960s _____ 1.50 _ 8.00 _ 4.00 _ 8.17 _ 3.00 _ 3.50 _ 9.00 _ 6.50 _ 2.00 _ 2.50 ___48.17 ____39.50 ____+8.67 1970s _____ 5.00 _ 2.33 _ 5.00 _ 8.00 _ 4.00 _ 6.33 _ 5.00 _ 7.50 _ 1.00 _ 6.00 ___50.16 ____34.70 ___+15.46 1980s _____ 3.83 _ 2.00 _ 5.50 _ 5.50 _ 4.00 _ 4.50 _ 4.50 _ 3.83 _ 8.58 _3.00 ___45.24 ____31.20 ___+14.04 1990s _____11.50 _10.00 _ 0.00 _ 6.50 _ 1.33 _ 2.00 _ 3.50 _ 4.00 _ 7.83 _ 6.00 ___52.66 ____29.00 ___+23.66 2000s _____ 4.50 _ 12.83_ 5.00 _ 1.00 _ 0.00 _ 2.00 _ 4.50 _ 3.00 _ 4.00_ 2.00___38.83 ____26.30 ___+12.53 2010s _____ 3.50 _ 4.50 _ 2.00 _ 2.00 _ 0.00 _ 6.50 _ 3.00 _ 4.33 _ 3.00 _ 1.00___ 29.83 ____24.50___ +5.33 2020s _____ 4.50_ 2.00 _ 3.00 _ 3.83 _ 2.50 ._ 1.50 .... future years .... .... .....___ 17.33 ____ 12.83 ___ +4.13 * 2025 to June 25th ____________________________________________________________________________________________ The analysis shows that every decade has done at least somewhat better than random expectation at setting new records, because the starter set (1869-1900) was relatively weak. In some future posts I will examine what happened to various years' records over time and try to establish some rules for survival rates. For example, 1913 set 26.33 new records, a result of 26 exclusive records and one three-way tie with earlier records. Of these, only one has survived as part of a three-way tie (94 on Aug 18 tied later in 1987 and 2002). So the count for 1913 has gradually decreased from 26.33 after 1913, to 21.83 by end of 1920, 10.83 by end of 1930, 9.33 by end of 1940, 7.83 by end of 1950, 5.33 by end of 1980 and is now just 0.33 (a survival rate of 1.3%). This is probably the most feasted upon year, and some of its records would have held on nearby dates, for example, 89F and 89F May 2-3 lasted until 2001 and are above surviving records for May 1st and May 14th. What 1913 illustrates mainly is that a warmer year shortly after the cooler interval of starter records found the menu relatively easy pickings, many of these 1913 records were set in the first five months of winter and early spring weather, and a few in November. But as the warming became more established, later years were able to do slightly better than 1913. The fate of the eventually broken 26 daily records or shares can be seen in this table: 1913 Records survived until these years 1916 (2) 1917, t1918,22 (br 1930), 1919, 1921 (3) (one had tied 1903 for count of 0.5), 1922 (2), t1923* (br1926), 1924, t1927 (br1931), 1929, 1930 (2), 1934, t1939 (br1988), t1945,71 (br1983), 1950, 1963, t1973 (br 1990) and another broken in 1973, 2001 (2) and 2006 (Jan 21 60F). *was a three-way tie with 1873,79. ______________________________________________________ The fact that 1913 lost some of its records within the same decade shows that there would be an inherent bias towards a surplus of records in any given decade, since each time that happened the total count would be 2 rather than 1. However, records broken within that short a space are not a common occurrence. The combination of a weak starting field from the starter records, and this bias of double counting, is probably weighted about 2:1 towards the weak start. If the climate continues to warm, there will likely be ongoing surplus numbers of records. In recent decades (starting 1970) only these years have underperformed in terms of setting new records relative to what would be expected in a random sequence: 1981, 1992, 1994, 2003, 2004, 2009, 2013, 2014, 2019. Some of these have only been marginally below expectation. Nowadays a "normal" pace of setting new records would be around two exclusive and one tie. In some future posts I will examine some of these statistics and track what happened to a few other prominent past years. Some of the starter years lost most of their records within 30-40 years of the end of the starter interval. No year before 1981 has retained all its original records, 1981 only set two in Feb and Apr and has held on to them. The following year 1982 has already been reduced from a count of 5.5 to 1.0 (two records are now tied with other years -- all of its records were set in December, so the interval from April 3, 1981 to Dec 4, 1982 set no records). The first year in the sequence to hold on to 80% of its established records was 1953 which has retained 8 of its original 10.0 count. Then 1956 only set four but three are still unbroken for 75%. An early outlier is 1925 which has held on to 4 of the 7.5 count it had at end of the year, all of those coming in a June 2-5 heat wave. Besides the four years which never set a record, the year which was least able to hold records was 1978 which established one record (67 on Dec 4) that lasted only four years to 72 in 1982 (and that was broken in 1998). 1968 established only two, one on April 13 which lasted to 1977, and one on Nov 29 that was broken in 1990. The years which were most recently removed from record holding were 1889 (64 on Dec 25 was tied in 1982 then broken in 2015 by 66F), and 1872 which was in a three-way tie with 1916 and 1919 (93F) for Sept 8 up until 2015 with a new record of 97F. But the year which held on longest to an exclusive untied record before being eliminated from record holding appears to be 1896 (lost 91F on May 11 to 1993 92F). (Other years have lost more recently but still hold some records, for example 1922 which recently lost March 26 to 2021). The now broken records most unlucky to be removed would probably be 89, 88 on April 7-8 of 1929. These fell to 92, 90 (2010, 1991) but would still be records on every day but two in the next eight days and even in all four days between April 21 and 24 as well as May 1st. This graph tracks the statistics of annual records set, sustained to end of the data, random expectation and survival percentage of records set. The grey ascending component is survival rate in %. The blue gradually diminishing statistic is number of records set each year. This compares directly to the orange-yellow line that starts out at 11.4 and begins to head down to 2.4 at end of the data, which is the random expectation (in a steady state climate) of annual records set by end of each year (1869-1900 are a starter period with equal chances at random). And the bottom running orange statistic is the annual number of retained daily maximum records (adjusted count for ties, which has its maximum values as follows (in chronological order with minor changes since graph posted edited in) ... 5 in 1880 and 1881 6.83 in 1895 7.25 in 1931 7.58 in 1949 and 8.00 in 1953 6.83 in 1966 7.08 in 1988, 8 in 1990 (now 7.83), 8.5 in 1991 9.33 in 2001 (since fell to 9.17) 6.5 in 2015 (since fell to 6.0) (the horizontal scale is years of data, 1869 =1, 2020= 152) Edited May 18 by Roger J Smith
-
This graph shows the three data sets in 11-yr r.m. format (NYC green, CET red, TOR blue) after the NYC and TOR data are gradually reduced by up to 1.1 C after 1981 to eliminate the urban heat island component of warming. This leaves the three data sets comparable and generally speaking they seem to be running along in lock step with a few minor variations. The warming around the 1890s is a bit more prominent for the North American locations which were recovering from a very cool period in the mid-19th century, whereas the CET shows a somewhat less pronounced increase that appears to start a bit later perhaps (more like mid 1890s). The warm period around 1948-55 is evident before either slight cooling or flat temperature profiles in advance of the late 1980s warming that seems to have more momentum at NYC than in the other two sets which level off somewhat near the end (and the end in this format is the past decade or 2010-2020 inclusive). No 2021 data went into this analysis. This graph is part of a much smaller excel file I created to show only the mean annual temps at the three locations.

