

Roger Smith
-
Posts
5,927 -
Joined
-
Last visited
Content Type
Profiles
Blogs
Forums
American Weather
Media Demo
Store
Gallery
Everything posted by Roger Smith
-
April 2023 temperature forecast contest
Roger Smith replied to Roger Smith's topic in Weather Forecasting and Discussion
Updated anomalies and projections: _____________________________ DCA _NYC _BOS __ ORD _ATL _IAH __ DEN _PHX _SEA 11th __ (anom 10d) _________+4.8 _+3.4 _+1.3 __ +3.7 _+2.4 _+0.4 __-2.2 _-3.6 _-4.0 21st __ (anom 20d) ________ +6.8 _+7.2 _+4.5 __ +6.8 _+1.9 _-0.3 __ +1.3 _-0.8 _-5.2 11th __ (p anom 20d) _______+9.0 _+8.0 _+6.0 __ +7.0 _+8.0 _+6.0 __+2.0 _ 0.0 _-1.5 11th __ (p anom 27d) _______ +7.0 _+6.0 _+5.0 __ +5.5 _+6.0 _+4.5 __+2.0 _+0.5_-2.0 21st __ (p anom 30d) _______+3.5 _+4.0 _+2.0 __ +3.0 _+0.5 __0.0 __ +2.0 __0.0 _-2.5 30th __ (final anoms) ______ +3.9 _+3.9 _+2.2 __ +2.0 _+0.3 _-1.9 ___ 0.0 _+1.1 _-2.8 ==================== 11th _ Looks very warm mid-month in most locations, last week of outlook not as warm but still above normal in most cases. 21st _ Rest of month looks rather cool except for a strong warming signal in the far west after the weekend. 30th-1st _ Final anomalies now posted. -
April 2023 temperature forecast contest
Roger Smith replied to Roger Smith's topic in Weather Forecasting and Discussion
2022-23 Snowfall Contest current standings Rank _FORECASTER ___________ DCA _NYC _BOS __ ORD _DTW _BUF __ DEN _ SEA _ BTV ___ Total and departure _01 _ Scotty Lightning*___________16.0 _23.0 _ 33.0 __ 44.1 _37.5 _ 81.9 ___ 65.9__5.9 _ 84.0 ____ 391.3 __ 163.3 (53.9) _02 _ hudsonvalley21 ____________13.2 _ 29.3 _ 46.2 __ 42.8 _44.0 _ 90.0 __ 48.7 _ 8.2 _96.3 ____ 418.7 __ 170.5 (43.8) _03 _ so_whats_happening ______ 18.0 _38.0 _ 64.0 __ 45.0 _380_ 110.0 __ 42.0 _11.0 _ 84.0 ____ 450.0 __ 175.2 (30.5) _04 _ RodneyS ___________________ 7.4 _ 33.0 _ 50.0 __ 44.0 _48.0 _ 93.0 __ 46.0 _ 7.0 _ 98.0 ____ 426.4 __ 179.8 (44.6) (05) ____ Consensus _____________16.0 _40.0 _ 55.5 __ 44.1 _ 49.9 _ 93.7 __ 50.0 _ 8.2 _ 90.0 ____ 447.4 __ 191.4 (39.9) _05 _ DonSutherland1 ____________10.0 _36.0 _ 55.0 __ 45.8 _52.5 _ 95.0 __ 44.0 _ 7.0_ 100.0 ____ 445.3 __ 198.7 (44.6) _06 _ Roger Smith _______________22.2 _44.4 _ 55.5 __ 55.5 _66.6_ 133.0 __ 52.0 _15.9 _ 88.8 ____ 533.9 __ 199.3 (0.6) _07 _ RJay _______________________20.0 _50.0 _ 65.0 __ 31.0 _27.0 _ 86.0 ___ 50.0 _15.0 _ 80.0 ____ 424.0 __ 203.6 (57.7) _08 _ wxdude64 _________________19.5 _40.0 _ 58.5 __ 42.8 _50.5 _101.0 ___ 41.6 _ 8.7 _ 104.0 ____466.6 __ 210.6 (39.9) _09 _ Tom _______________________ 14.2 _ 41.1 _ 49.6 __ 53.9 _ 49.9 _ 93.7 __ 79.2 _ 6.7 _ 81.2 ____ 469.5 __ 216.3 (41.3) _10 _ BKViking ___________________ 25.0 _52.0 _ 60.0 __ 38.0 _50.0 _90.0 __ 60.0 _18.0_ 90.0 ____ 483.0 __ 234.4 (43.6) _11 _ George001 _________________ 12.0 _62.0_105.0__ 65.0 _70.0_140.0__ 60.0 _ 8.0_ 130.0____ 652.0 __ 316.2 actual snowfall to Apr 29, 2023 __0.4 __ 2.3 __12.4 __ 20.2 __37.1 __133.6 ___48.9 _ 8.1 _ 72.8 ____ 335.8 total Current best forecast ____________(04) __(01) __(01) ___(07) __(01) __ (06) ___(02)_(02,11)_ (07) (01 Scotty Lightning has three, (02) hudsonvalley21 has two, (07) RJay has two, (04) RodneyS and (06) Roger Smith have one, and George001 is tied for one with hudsonvalley21 (SEA). Lowest forecasts are best at all but DTW, BUF and SEA. ====================================== (Mar 4) _ All forecasts are still above actual values for DCA, NYC, BOS, ORD and DTW as well as BTV. One forecast is now equal to current total at DEN, otherwise the rest are still above the current value. BUF has passed all but two forecasts (Roger Smith 133.0, George001 has 140.0). SEA has a bit more than half the forecasts, and is between George001 (8.0") and hudsonvalley21 (8.2") with other higher forecasts. The table now contains the total error value which in most cases is subject to later decreases, but for those already passed by BUF or SEA, new snowfall will increase these values. NOTE: BUF now has no contest implications, further snow will not change differentials, except for myself and George001. I can gain 16.4" (twice my reserve of 8.2") but that would only move my rank (8th) closer to 7th. George001 is too far back to benefit much from further snow at BUF. Probably DEN is the most volatile location for changing ranks. The more reserve you have for DEN, the higher your potential to move ahead -- but that snow has to happen. Seems unlikely that the four northeast locations or Chicago will pass any forecasts, but DTW could still be a factor. Looks as though Scotty Lightning has the edge, he needs less than 1.0" more at DEN to pass so_whats_happening and then would have a bigger reserve than any chasers, except Tom, and his margin over Tom at DEN would not reverse the outcome. Unless there are very heavy snowfalls later in March at other locations, I think DEN will determine the outcome. (Mar 11) _ DTW has now passed RJay and is gradually approaching our cluster near consensus. As a result RJay fell from 5th to 7th. No change at the top because DEN has seen no new snow since last report. (Mar 16) _ BUF has now reached the second highest forecast (Roger Smith) so I cannot gain any further ground, a combination of that plus more snow at DTW moved me into 7th and RJay into 8th, otherwise no changes in the scoring order. Scotty awaits any further snow at DEN to move ahead of so_whats_happening who also has 0.5" more to use up as both of our leaders find DTW about to pass them. The net result would be that if DTW does pass both, Scotty will need about 1.8" more at DEN to pass swh. If nothing else changed by then, Scotty has the same forecast for BTV and appears in good shape otherwise. (Mar 20) _ DEN added 1.5" snow which moved Scotty Lightning into the lead. If DTW adds a small amount then so_whats_happening could retake the lead unless DEN adds similar amounts. BUF has moved past all but George001 now, but the margin for further gain is only 6.7"x2 or 13.4" which is not enough to change any contest ranks. (Mar 28) _ DEN added a further 3.6" and BTV 0.3" in the past week. This has led to a few changes in the contest ranks. Meanwhile, the table is now ordered by contest ranks instead of following the forecast table. The contest is not settled yet. Further snowfall at DTW could move hudsonvalley21 into the lead. However, Scotty Lightning retains more DEN snowfall to use up if the total exceeds 48.7" (hudsonvalley21's prediction). RodneyS also has some potential for gain at DTW, but he cannot pass hudsonvalley21 unless about 9" more falls there. Large late season falls at BTV could also help hudsonvalley21 and RodneyS, as SL and s_w_h have equal forecasts of 84.0", albeit 12" above the current total there, so that advantage would only begin to materialize after 12" more might occur (not too likely from climatology or current model runs). Also RodneyS and hudsonvalley21 have to avoid larger snowfalls at DEN in April or May, as SL has a margin of over 15" and they have recently, or will soon run out of margin there. Meanwhile so_whats_happening has one faint hope left, which would be April snow at SEA combined with no further snow anywhere else in play (BUF would not matter). I don't see any route to a contest win for those below fourth place although there are mathematical possibilities (that likely will not verify) mostly involving very heavy April snowfalls in the midwest. (Apr 4) _ Small additions at BUF and BTV, DEN may add today and tomorrow but not yet changed in table. (Apr 11) _ DEN added 0.2" otherwise no changes. Any further changes to table will appear here. (Apr 21) _ ORD added 0.4" otherwise no changes. (Apr 29) _ DEN added 2.0" recently and ORD, DTW added 0.1" _ no contest rank changes. -
Rapid snow melt underway now, visible satellite shows bare ground in eastern MT and western ND and temps currently 77 F, snow remains over central and eastern ND, northeast SD, temps near 40 F. Further west, rain across parts of WA state into southeast BC, at my location current weather rain, dense fog and 47F. Snow melt here has increased from gradual to moderately fast and creeks are near bankfull status. Would imagine a lot of the snow removal over Dakotas is evaporation (sublimation) rather than runoff but even so, rivers will collect the equivalent of 1-2" of liquid and with ice jam potential some flooding may occur on smaller rivers soon. I was reading elsewhere that winter wheat crop in southern/central plains is largely a failure due to drought. While it has been cold and snowy further north, March and early April in western KS bone dry and more variable in temperatures.
-
Yes except for that brief cold shot around May 8-10 with snow in parts of the northeast U.S. (trace at NYC 9th). Despite that it was very warm in May also, otherwise.
-
With more warmth appearing on the charts, I have taken my first graphic (days of 75+ April 1-15) and edited it to days of 80+ and continued that to end of the month. Daily records are in bold type. 1. ............................................ 83 1917 .............................................. 82 1978 .................................................... 2. ...................................................................................80 1963 81 1967.............................................................. 3. ........................................................................................................................81 1981 ........................................ 4. .............80 1892..................................................................................................................................................... 5. .................................................80 1928................................................................................................................... 6. .................................................................................................................................................................. 80 2023. 7. .....................................................89 1929 ...82 1942........................................ 87 1991...............92 2010........... 8. .85 1871 .......................................88 1929 ...........83 1959 ..............................90 1991. 80 1999 80 2010 ........ 9. .83 1871 ..............................................................................................................86 1991....................82 2013........ 10. .80 1871 .................................86 1922 ...................................................................................................................... 11. ................ 78 1887 .................80 1922 ................ 84 1955 ........................................................... 81 2011 80 2017.. 12. ...................................................................................................................90 1977.....80 1996.......................84 2023 13. .....................................................................81 1945 ..........82 1968.......(88 1977)............................82 2018. 90 2023 14. ......80 1880 ..........................................(85 1941) 83 1945 ...............................................................................91 2023...... 15. ...................................................84 1938 87 1941 ......83 1960.........................................82 2002 81 2003 80 2006 .... 16. ....................... 87 1896........................... 80 1941...................................82 1976.............92 2002.88 2003.88 2012 87 2017.. 17. ........................88 1896................................................80 1959 ..............91 1976..............96 2002.................................... 18. .......................90 1896................................................81 1963 86 1964 .96 1976................91 2002.....84 2008 .............. 19. .............81 1886.80 1891.80 1909 82 1914 81 1915.........86 1972 80 1973..92 1976.88.1985 84 1994 .89 2002 .85 2004.80 2019. 20. ......................................82 1915 83 1923.90 1927..85 1938 80 1941.82 1952 80 1963 89 1976............87 2005 83 2006 ......... 21. ................................................................87 1923...81 1936....85 1957 ...............................83 1985..81 1996 ...................... 22. .................81 1885,86......84 1902..........82 1926.... 80 1952 80 1960 .86 1962,1973....85 1977 85 1985..86 2001.82 2004.. 23. ..................84 1886.........83 1902 ..........84 1925..................................83 1973 .81 1979,1990 .85 1996 80 2001..86 2007......... 24. ..................83 1886.......................................................80 1942.81 1957.....................81 1992 80 1994....87 2001 .80 2011.. 25. .....80 1872 ......86 1895...82 1913..91 1915 .............86 1939 ....... 87 1960 82 1961 84 1962....82 1982 ............88 2009... 26. .....83 1872............................................80 1925.........84 1942................80 1969 821970....80 1985.................92 2009... 27. ..................................................92 1915............83 1935 ................91 1962 .84 1969 ...............91 1990........... 84 2009 .... 28. .80 1870........................80 1935 89 1938..84 1956 80 1957 89 1962.86 1969 80 1974 85 1983 82 1986.90 1990.80 2003.90 2009.85 2017,21. 29. ...................83 1888........82 1903........................81 1938 .......84 1951 .....80 1962. 89 1974..80 1983 ..................85 2017........ 30. ...........................80 1901.82 1903.80 1910........86 1941 91 1942 .80 1944 .80 1965 .......84 1985..................80 2007 ....... ________________________________________________________________ Based on temps at Toronto (90) and Providence RI (80), 22nd 1842 was possibly at least 85F. Flow was westerly. Between the two record highs in 1915, 26th had a max of 72F. 1896 was a year that could not hold on to significant heat wave records. May 9-11 (91, 92, 91) have all been overtaken as well. Then in August, 17th to 22nd lost all of these: 97, 95, 98, 94, 96, 93. The only record held is 72F on Nov 27, but 70 on Nov 17th and 69 on Nov 28 have also been lost. About half a dozen other less impressive records in Feb, June and Apr-May have also been lost. A shift of a few days in either direction, and many of those lost records would still be on the books. Another lost heat wave was 89F, 89F on May 2,3 1913. DISTRIBUTION OF 80+ DAYS IN APRIL 1869-1900 (32 yr) _ 20 1901-1930 _________ 25 1931-1960 _________ 33 1961-1990 _________ 46 1991-2020 _________ 46 2021,22,23 __________ 5
-
The adjustment of the NYC high means that 1912 no longer retains any share of the ten record highs it set (relative to 1869 to 1911). It was holding on to a 0.33 count of surviving highs for a long time. The other two years removed yesterday (1921, 1947) still have record counts of 2.5 and 2.0 counting ties. Those years also set a lot of records that have since been overtaken. If we allow 1869 to 1900 to be a "starter era" and automatically hold records from the highest values, and then take whatever new records came along after that, only four years failed to set new record highs (at NYC). Those were 1958, 1992, 2004 and 2014. Although every year before 1958 set records by those rules, of the 89 years 1869 to 1957, 30 have gone "extinct" like 1912 just did, but all of those 30 are before 1927, and all but two (1924, 1926) are before 1913. After 1958, the first year to fail to produce a record high, as mentioned three other years failed (1992, 2004, 2014), and just two (1968, 1978) have gone extinct. 1968 dropped out on Nov 29, 1990, and 1978 lasted only to Dec 4, 1982. The four "fail" years were effectively blocked from holding records on these dates (when the last of their actual highs was prevented from reaching record status) ... 1958 was done by Oct 10 1939. 1992 was blocked by May 23 1964. 2004 and 2014 were both blocked by Nov 25 1979. The first year to go extinct was 1909 which was done on Feb 19, 1930. 1877 lasted to Feb 12, 1932. By the time 1958 failed to set a record, 1904 had also left the tables (out on Feb 7, 1938). 1869 (extinct Aug 1955), 1878 (extinct April 1946), and 1893 (extinct August 1943) were done also before 1958. From 1961 to 2017 all the other extinctions occurred (before 1912 yesterday). Many of them were around 1990 when this warmer climate era set in. The most recent extinction before 1912 was 1906 leaving the tables on May 18, 2017. These years with only one record left are in some danger of going extinct later in 2023 or in 2024 with only one record or a tied share of one record (which one goes first? lay your bets, it could be none of these if some year with several records runs into a hot spell that takes away consecutive records): 1922 ___ 1.0 share of Apr 10 (86F) _ probably not this year 1942 ___ 1.0 share of Apr 30 (91F) _ closest call so far was 84F in 1985 (1942 broke 86F from 1941) 1957 ___ 1.0 share of June 17 (96F) _ although it broke 95F (1952) warmest since has been only 91F (1962 and 2017) 1943 ___ 0.5 share of June 25 (99F) _ tied with 1952 which has two other records 1934 ___ 1.0 share of June 29 (101F) _ probably not in a lot of danger 1913 ___ 0.33 share of Aug 18 (94F) _ one of the weakest records in the books (1987, 2002 share) 2019 ___ 1.0 share of Oct 2 (93F) _ seems fairly safe, only one October day in 1941 was warmer 1897 ___ 1.0 share of Oct 16 (87F) _ brushed off 83s from 1958 and 1963. 2003 ___ 1.0 share of Nov 3 (79F) _ closest approach since established was 74F in 2017. 1879 ___ 1.0 share of Nov 12 (76F) 1896 ___ 1.0 share of Nov 27 (72F) 1899 ___ 0.5 share of Dec 19 (58F) _ another weak record, shared with 1931 which has plenty of others 1965 ___ 1.0 share of Dec 31 (63F) _ has survived a number of close calls, 62F in 1992 1907 ___ 1.0 share of Jan 7 (64F) 1960 ___ 0.5 share of Feb 11 (65F) _ tied in 2009 1935 ___ 0.5 share of Mar 6 (68F) _ was tied by 2022 (which would not go extinct if this record fell in 2024) (1914 has a count of 0.83 but that includes a two-way tie (95F Sep 22) and a three-way tie (94F Aug 19) so both would have to be broken). (1937 has a count of 1.0 but this involves two tied records so both of those, Jan 9 (64F tied 2008) and Dec 18 (also 64F tied 1984), would have to be broken). ______________ Also of interest, the highest counts of records currently held are 9.17 2001 8.50 1991 8.00 1953 7.83 1990 7.58 1949 7.25 1931 7.08 1988 7.00 1998 6.83 1895 1966 6.50 1944 6.00 1916 1941 1946 2015 5.58 1933 5.00 1880 1881 1945 1977 1979 4.83 1955 4.50 2020 4.00 1915 1925 1927 1928 1948 1950 1963 2002
-
The title is pretty much the post. There is a widespread 1 to 2 foot snow pack in the Dakotas, Minnesota, Montana, Wyoming and southern prairies of Canada. Guidance showing clear potential for very warm weather to develop after this weekend with highs into the 70s and low 80s over the snow covered areas. Would expect the Missouri to start filling up gradually all month and it could lead to severe downstream flooding by May and or June. The Mississippi drainage may also increase levels fairly quickly although there is a smaller percentage of that basin currently snow covered. Further north the Red and Assiniboine may go into flood stage later this month with the usual problems for North Dakota and Manitoba. The past six weeks have been very cold with frequent snowfalls; Fargo ND has seen almost 70" for the season of which about 30" has fallen since March 1st. Grand Forks ND is similar. Snow cover maps show snow packs of 40-60 cm or 16-24 inches fairly widespread in the upper Missouri drainage, parts of Minnesota and all of the Red-Assiniboine drainage area. Severe flooding seems difficult to avoid especially if this warmth ends with rainfalls.
-
Another tie? Memo to self, widen column FG. That was and remains the latest April day not to hit 80F or higher at NYC.
-
Did you know that this outbreak included two F4 tornadoes in south central ON, one was near Grand Valley northwest of Toronto and another one hit Barrie north of Toronto where eight people were killed? That storm continued on for about two hours and dropped funnels several more times towards Peterborough ON where an F-1 did some damage in southwest suburbs. I was living in Peterborough at that time, and we were on the north side of the cell where we got a fairly severe storm too. It was quite a strong cold front on a Friday, the next day I was playing golf and there was a westerly wind blowing at 30-40 mph all day and it was much colder too. It had been near 85F on the afternoon of the 31st before the line of storms arrived.
-
The low tracked from about Colorado to Ohio 4th to 6th when it redeveloped over New Jersey and a 980 mb center formed south of Long Island, which tracked past Cape Cod into the Gulf of Maine 7th-8th with a very tight circulation. Here's a link to maps: http://www.wetterzentrale.de/reanalysis.php?map=2&model=noaa&var=1&jaar=1982&maand=04&dag=06&uur=1200&h=1&tr=360&nmaps=24#mapref With the previous low that moved past to the north on 3rd-4th, NYC recorded 1.86" of rain on 3rd, then 9.6" snow on 6th from liquid equivalent of 1.11". The daily high/low values from 1st to 10th are 65/46 58/36 56/43 52/32 48/27 41/21 30/21 43/25 39/34 53/34. Would have to think the max of 41F on 6th was early, the low reformed between 06z and 12z so it may have been briefly a rain-snow mix turning to all snow. The 21F must have been at midnight as it applies to 7th as well. Toronto also had extreme values that set daily records for temperature (max 22F on 6th, min 13F on 7th) but the total snowfall there was only 3.2 cm or 1.3". About 5-7" fell across southern Quebec and 8-12" in the Canadian maritimes from late 6th to early 8th, there must have been some much higher snowfalls in New England though. I found one link that states the NWS forecast 14" from a blizzard for Boston but the article didn't mention actual amounts.
-
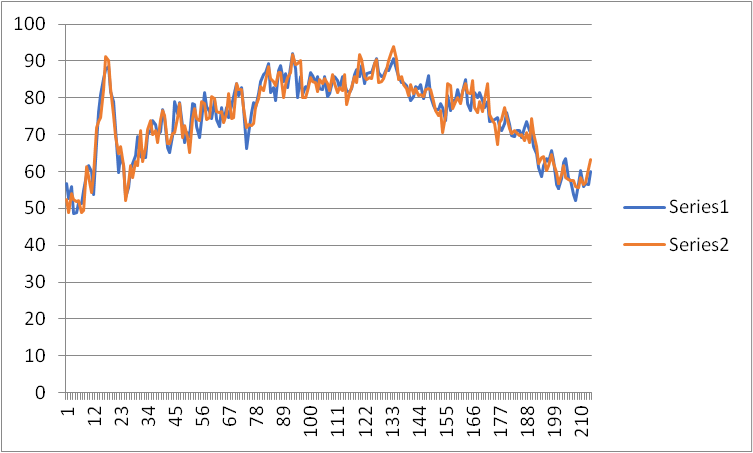
Given that GFS output for mid-April warmth, here's an average of daily highs from April to October for the four years with most impressive heat around same time, namely 1896, 1941, 1976 and 2002. The blue data represent daily calendar day averages Apr 1 to Oct 31. The orange data are slightly shifted for 1941 and 1976 so that all four have their peak day of mid-April warmth on the 18th. 1941 is shifted three days (so it runs from Mar 29 to Oct 28), and 1976 back by one day (runs Apr 2 to Nov 1). The most salient points would be continued relative warmth all of May and second half of June into July, not as impressive a warm signal by August, a slight recovery to warmth in early September, and a colder signal in October, although October 1941 had some record warmth in the first third. I also looked at rainfall amounts and those were generally dry to near end of May then mostly wet through summer and autumn months, in each case at least one month was very wet.
-
Maybe it would be good to speed up that timetable, figure out a way of modulating this energy, so we don't get tornadoes any more. I will say 3200-3700 AD for that one. And I am not optimistic we will still be around then at this rate.
-
Sure am, they were in the prime position overnight. And I think one day science will catch up. There has been a lot of work done by other researchers in curved bands within the solar system magnetic field, the only difference in my research is that I co-locate these with Jupiter and to some extent other planets. And if there are powerful signals involved, then moons of those planets would modulate the signals. I have no expectation of recognition of these theories in my lifetime, the over/under on when it will be recognized is about 2400-2700 AD and it would take somebody with a better designed career path than mine, I have been more or less blacklisted (for other reasons) since 1980. And I used to care about that but I don't now as my life has been splendid and I have done everything I wanted to do and a lot more. So whether people believe me or not is the least of my concerns or worries. I might add that the elites running our world are not exactly showing themselves to be an infallible brain trust but that's not my problem at age 74. Well 73.9 getting ahead of the curve there. (People may be confused by this exchange and I don't want to derail the thread given that a very dangerous severe weather potential exists for a large part of the forum, so I would just say the key point is that a lot of severe weather outbreaks show a strong correlation with times where Jupiter's magnetic field would be at a peak state of disturbance, and this happens at predictable times that are roughly 3.5 days apart and which peak in cycles of 435 days, which being longer than an earth year by about 20% means that roughly every five years the peak coincides with the spring months. However it would also be relevant to locate the earth's orbital position relative to the curved portions of the solar system magnetic field, so it's not as simple as saying there is a five year cycle of severe weather events ... I will leave it at that, my interest in severe weather is otherwise conventional and therefore this is seen as being a theory under development while I do normal meteorology). The dynamics of this system are pretty impressive whether it has anything to do with solar system magnetic fields or not.
-
Large tornado PDS warning in n/c AR near Franklin not far south of MO border. This is rather odd ... 3-18-1925, 4-3-1974, 2023. I suppose one might want to circle the 19th on one's calendar. Have to say, the trailing wave feature on this is taking a similar track to the 1925 event which ran about 150 miles south of the 1974 low (which in turn was a bit south of this one, at 21z on Apr 3 1974 there was a 986 mb low near Keokuk IA).
-
Remarkable to see temps at 0400h CDT near 80F around eastern MO and southern IL. As that cluster of cells develops I think it's going to get very severe in eastern Illinois and west-central Indiana later this morning towards 0900h. BUF and south area might get hit by the leading wave moving across sw ON overnight.
-
I was living about 100 miles north of Toronto when the 1974 event happened, we had a moderate thunderstorm roll through about midnight (3rd-4th) with a temperature near 12 C. It then warmed up to about 20 C during the day (4th). As you probably know a tornado hit Windsor ON evening of 3rd and caused nine fatalities at a curling rink that collapsed. But beyond that I am not aware of any severe storm activity further into southwest Ontario that night. One tornado that might have been quite close to your location in April 1967 (a day where Chicago was hit badly) was about an F-2 and I vaguely recall there being one fatality from that, somewhere around Exeter and or Mitchell ON. And more recently you'll maybe recall that extreme rainfall event on May 12, 2000.
-
Taking the list of 75+ days in first half of April that I posted yesterday, this is a frequency count of those days for twenty-two equal periods of seven years (not counting this year which as of April 13 will have four) ... 1869-1875 _ 3 1876-1882 _ 1 1883-1889 _ 2 1890-1896 _ 5 1897-1903_ 0 1904-1910_ 3 1911-1917 _ 2 1918-1924 _ 6 1925-1931 _ 6 1932-1938 _ 3 1939-1945 _ 7 1946-1952 _ 5 1953-1959 _ 4 1960-1966 _ 2 1967-1973 _ 4 1974-1980 _ 6 1981-1987 _ 5 1988-1994 _ 7 1995-2001 _ 2 2002-2008 _11 2009-2015 _ 10 2016-2022 _ 7 (total) ___ 101 (average per 7 yrs) _ 4.6 (average 1974-2022) _ 6.9 or nearly 1 per year (average 2002-2022) _ 9.3 or about 1.3 per year (average 1869-1917) _ 2.3 (per 7 yr) or about one every 3 years The interval 1918 to 1973 averages 4.6 (per 7 yr) or about 2 every 3 years ... so the pace is slowly increasing, although it was almost as active around the 1940s as it is now. The 1960s saw a drop back to about the frequency before 1910. The 101 warm days occurred in a total of 62 years, these 92 years did not have one ... 1869, 1870, 1872, 1873, 1874, 1875, 1876, 1877, 1878, 1879, 1881, 1882, 1883, 1884, 1885, 1886, 1888, 1889, 1891, 1893, 1894, 1895, 1897, 1898, 1899, 1900, 1901, 1902, 1903, 1904, 1905, 1906, 1907, 1909, 1911, 1913, 1914, 1915, 1916, 1919, 1920, 1923, 1924, 1926, 1927, 1931, 1932, 1933, 1935, 1936, 1937, 1939, 1940, 1943, 1944, 1948, 1951, 1952, 1953, 1956, 1957, 1958, 1961, 1962, 1964, 1965, 1966, 1969, 1971, 1972, 1973, 1975, 1979, 1980, 1982, 1983, 1984, 1988, 1990, 1992, 1993, 1995, 1997, 1998 (had several in late March), 2000, 2001, 2004, 2007, 2009, 2015, 2020, 2021 The have not years were 41 of the first 52, and 51 of the next 102 (1921-2022). That ratio is exactly half. From 1979 to 2022 the ratio was 20 of 44, so it has not fallen much. It has been five of 16 since 2007, under one third. Of all these "have not" years, only a few broke into the 80+ group for April 16-30, including 1899, 1915, 1923, 1927, 1962, 1990, 2007 and 2009.
-
The slow evolution and continued feed of near-record warmth will set up most of IL for late night heavy and locally severe, and then that will just edge further east and probably peak in a strong moderate or even low end high risk outcome in IN-OH-KY-TN tomorrow. The low is moving north rather than northeast and there is little push on the cold front until mid-day or even mid-afternoon. I continue to expect this to ramp up into a very severe conclusion. A separate cluster from ne OK and w AR will move into s MO and w TN and merge with the northern complex during the late morning.
-
Looking at summers that follow April record highs (or near misses) you can have the full range of outcomes so I wouldn't read much into it. Summers like 1941, 1955, 2002, 2010 are balanced by poor summers like 1915, 1942, 1967, 1976, 2009. You also get mid-range summers like 1892, 1929, 1977. I would not be surprised if the correlation was either random of slightly negative.
-
Very warm days at NYC April 1-15 A complete listing of days that reached 75F or higher. Current record highs bold type. Arranged by decades from 1869 to 2023. 1. .............................................. 83 1917 .............................................. 82 1978 ................75 2006..79 2016 ... 2. ................................................78 1918 ....77 1934. 75 1946..80 1963 81 1967................................................. 3. .............75 1892 ...............................................75 1945........................76 1967...81 1981 .......77 2002............. 4. .............80 1892......................78 1921...............76 1950..................75 1974.........................76 2010 .......... 5. .................................75 1910 ...79 1921..80 1928......................................75 1985.77 1989. .75 2010........... 6. ................................. 76 1910 79 1912,1921.77 1928..79 1947......................77 1991..75 2005...78 2010.80 2023. 7. ................................75 1908 .............89 1929 ...82 1942................................. 87 1991..78 2005...92 2010.. 8. .85 1871 ............................................88 1929 .........77 1954.83 1959 ......75 1986..90 1991. 80 1999 80 2010 .... 9. .83 1871 ...................................................................................76 1970...75 1981....86 1991..........82 2013........ 10. .80 1871 ..79 1887 ..................86 1922 ................79 1955 ................................75 1991....75 2008 ......... 11. ................ 78 1887 ..................80 1922 .................. 84 1955 .............................77 1987.......... 81 2011 80 2017 75 2023 12. ..............................................................................78 1947 ................90 1977............80 1996....76 2008 76 2017 84 2023. 13. .................79 1890 .77 1896 .......................81 1945 ...82 1968..(88 1977)76 1978...78 2006 77 2014..82 2018 77 2019 90 2023 14. ......80 1880 ......................... 76 1930 77 1938 (85 1941) 83 1945 79 1949 .........75 2002 75 2014.. 77 2018 .79 2022.91 2023 15. ......77 1880 ..... 79 1896 ....78 1925 ..84 1938 87 1941 78 1942 83 1960...76 1976..76 1994.82 2002 81 2003 80 2006 77 2012.. ___________________________________ If there's continued warmth I can post a similar graphic table for days 80+ in second half of April. Soon after this table ends, you get into the four-day 2002 and 1976 record heat waves both times reaching 96, the monthly maximum (17th 2002, 18th 1976). There was a similar heat wave in April 1896 (87, 88, 90 F followed the 79F shown for 15th above, all were broken in 2002 and or 1976). Some of the record highs from 1871 to 1910 are way below the pace, notably 7th had only hit 61F (1871) until 1904 edged it out at 62F, and 12th 68F in 1889 was the record until 73F in 1945. A reverse case would be April 2nd where the highest reading since the record high of 81F in 1967 is 73F in 1986 then only 68F from 2006, 2010. It was odd that 1929 lost two very impressive records of 89 and 88 (to 7th 2010 and 8th 1991), those values would have been at least tied records on any other day to April 25th except for 12th, 16th, 17th, 18th, 19th, 20th. (Note: edited in five new 75+ days in 2023 so far _ Apr 14)
-
The Wed map will quite possibly show considerably higher potential south into KY and TN in later versions. Dynamics look quite extreme even at this early stage, 25 C 850 mb readings in n TX, 110 knot 500 mb over n AZ and a surge northward of 20 C dew points into OK. I agree it looks to remain capped to near sunset but look out after that.
-
Thanks for running this contest, RodneyS, not that you had to do anything.
-
April 2023 temperature forecast contest
Roger Smith replied to Roger Smith's topic in Weather Forecasting and Discussion
Fixed and made slight changes to consensus as a result. -
I'm seeing a parallel to the Apr 3-4 1974 situation shifted a bit to the northwest, so therefore it could be extreme on two consecutive days because in 1974 the second day's outcome was somewhat diminished by having much of the severe zone over the Appalachians to mid-Atlantic states by mid-afternoon (there still was a minor resurgence), in this case the explosive development zone would be further west on Tuesday 4th (similar to Apr 3 1974 but shifted northwest) and as with 1974 it would be very active all night then become prone to redevelopment but more so because the cold front would still be west of the mountains in the Ohio valley by 18z-21z. A two-day outbreak with an overnight component and extreme potential in a heavily populated region, has super-outbreak potential. I fully expect to see high risk and PDS situations over all states from e KS to OH and e TX to GA, let's hope this either misfires or contains its worst cells to farmland because there could be quite a few long-track F3-5 cells involved in this.
-
Perhaps obvious but there seems to be high potential for this outbreak to continue most of the night 4th-5th across IL, IN, w OH and s MI, pause slightly and redevelop in OH-KY-TN on Wed 5th..It doesn't look a lot different from 4-4-74 to me. (the dynamics with this one are somewhat further north)


