psuhoffman
-
Posts
27,419 -
Joined
-
Last visited
Content Type
Profiles
Blogs
Forums
American Weather
Media Demo
Store
Gallery
Everything posted by psuhoffman
-

January Storm Term Threat Discussions (Day 3 - Day 7)
psuhoffman replied to WxUSAF's topic in Mid Atlantic
What’s it start with -
January Storm Term Threat Discussions (Day 3 - Day 7)
psuhoffman replied to WxUSAF's topic in Mid Atlantic
Euro saw the storm as soon as it came in day 10 range. It was iffy on temps for a couple runs though. But it was pretty locked in on the general setup and track from day 10 all the way in. Had one hiccup run that gave us northerners a scare but that was it. -
January Storm Term Threat Discussions (Day 3 - Day 7)
psuhoffman replied to WxUSAF's topic in Mid Atlantic
Next maybe your posts... -
January Storm Term Threat Discussions (Day 3 - Day 7)
psuhoffman replied to WxUSAF's topic in Mid Atlantic
@Ji you know there are always things that could go wrong. I guess the most obvious is the flow over the NE doesn’t relax enough and the WAA wave gets suppressed then the coastal develops too slow. Secondary development is always tricky. But this has a lot more going for it then against it. BTW word of advice. Don’t set your bar at hecs. But also when evaluating the setup each run weight the guidance according to their results and performance. Euro/Eps is the baseline. Then adjust using other guidance but don’t over weight the gfs. It shouldn’t get any more weight (frankly less) that most of the other ancillary guidance available. We way over weight it because of its prevalence. -
January Storm Term Threat Discussions (Day 3 - Day 7)
psuhoffman replied to WxUSAF's topic in Mid Atlantic
No so if we fail you should definitely be sacrificed -
January Storm Term Threat Discussions (Day 3 - Day 7)
psuhoffman replied to WxUSAF's topic in Mid Atlantic
Sorry I can break it down This Run Eased Nearer Direction -
January Storm Term Threat Discussions (Day 3 - Day 7)
psuhoffman replied to WxUSAF's topic in Mid Atlantic
Trend -
January Storm Term Threat Discussions (Day 3 - Day 7)
psuhoffman replied to WxUSAF's topic in Mid Atlantic
Anyone curious what I thought of the gfs -
January Storm Term Threat Discussions (Day 3 - Day 7)
psuhoffman replied to WxUSAF's topic in Mid Atlantic
Trend trend trend trend trend trend trend trend trend trend trend trend trend trend trend trend trend trend trend trend trend trend trend trend trend trend trend trend trend trend trend trend trend trend trend trend trend trend trend trend trend trend trend trend trend trend trend trend -
January Storm Term Threat Discussions (Day 3 - Day 7)
psuhoffman replied to WxUSAF's topic in Mid Atlantic
what did I miss? @Ji that’s the toll that must be paid. To get a big amplification we need the blocking to relax but that means the wave isn’t going to get trapped as a 50/50 and the next wave is likely a cutter. If we’re lucky we get enough CAD to avoid a total washout. Maybe if it comes out in weaker pieces... The blocking looks to reload pretty quickly after. -
January Storm Term Threat Discussions (Day 3 - Day 7)
psuhoffman replied to WxUSAF's topic in Mid Atlantic
There is a lot more that could go right -
January Storm Term Threat Discussions (Day 3 - Day 7)
psuhoffman replied to WxUSAF's topic in Mid Atlantic
2016 was the last time we saw this level of agreement in the eps at this range. Even the control looks like a carbon copy wrt axis of snow as the eps mean. Uncanny -
January Storm Term Threat Discussions (Day 3 - Day 7)
psuhoffman replied to WxUSAF's topic in Mid Atlantic
It is...if we assume there is NO further south adjustment. That’s very possible we’re about the range the euro locked into roughly the final outcome for the last few waves. And there are reasons this won’t be as suppressed. Frankly Thursday wouldn’t have been if not for some really bad luck wrt timing those 2 discreet vorts in front and on top. We see no such countermanding features this time. But it’s hard to ignore the seasonal trend. That and this is just my jam. Fear the fringe! -
January Storm Term Threat Discussions (Day 3 - Day 7)
psuhoffman replied to WxUSAF's topic in Mid Atlantic
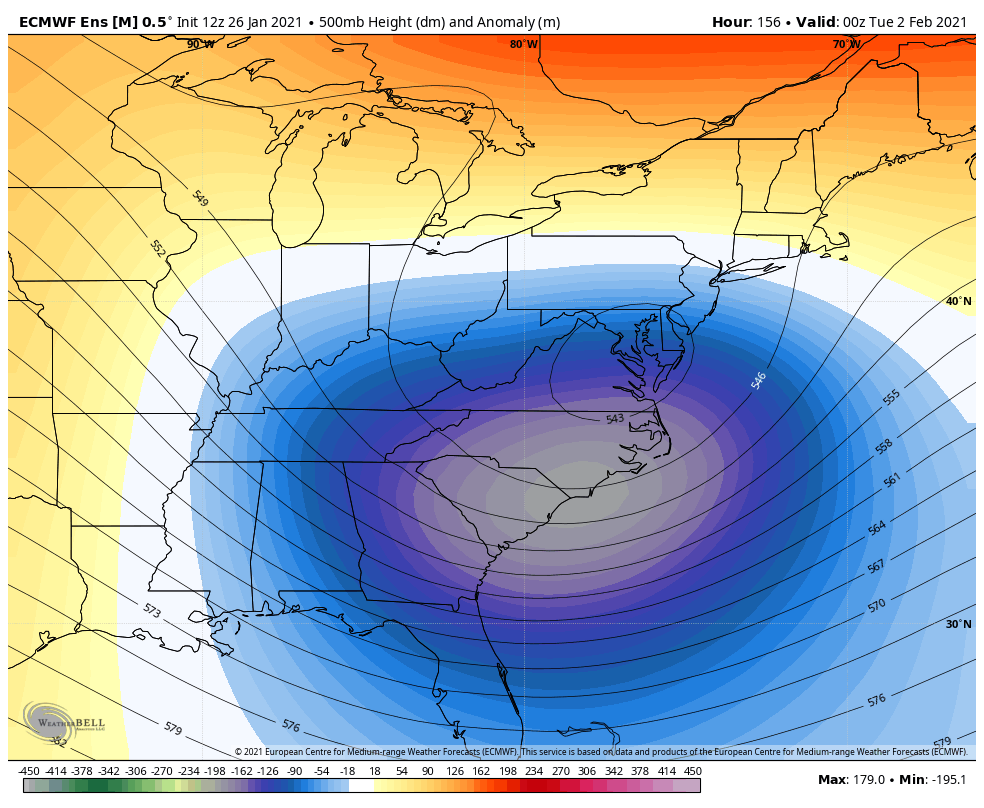
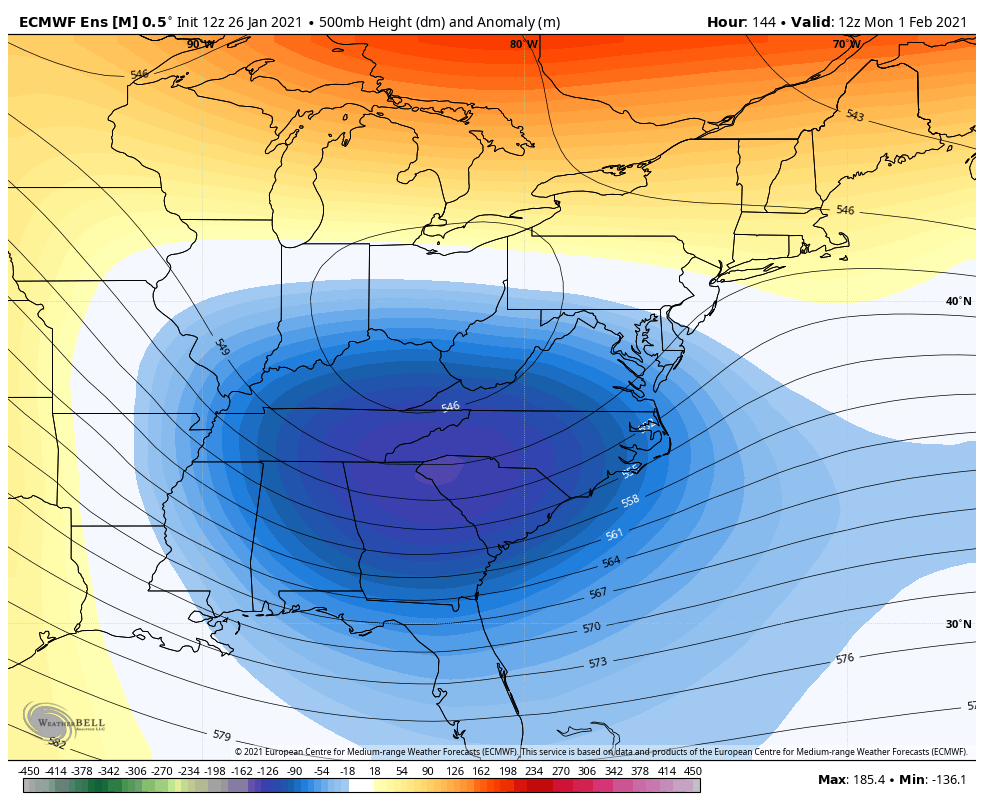
Optimist me: these might be the two most beautiful post 100 ensemble progs I’ve ever seen!
-
January Storm Term Threat Discussions (Day 3 - Day 7)
psuhoffman replied to WxUSAF's topic in Mid Atlantic
They look slightly south of where I would want them. 0z was PERFECT. 12z ticked slightly south again. Don’t get me wrong they look AMAZING but the northern part of the forum (Baltimore Northwest) is running out of wiggle room for any future adjustments south. That said we’re about the range guidance has been locking on here so maybe this was the last of the bumps south. -
January Storm Term Threat Discussions (Day 3 - Day 7)
psuhoffman replied to WxUSAF's topic in Mid Atlantic
I’m slightly worried about the south trend. That northern cutoff is getting mighty close to me... -
January Storm Term Threat Discussions (Day 3 - Day 7)
psuhoffman replied to WxUSAF's topic in Mid Atlantic
It went 30 miles too far south. STOP and back up just a tiny bit. -
January Storm Term Threat Discussions (Day 3 - Day 7)
psuhoffman replied to WxUSAF's topic in Mid Atlantic
I need that to her to the off the Delmarva before turning east... then it’s a forum wide win. -
January Storm Term Threat Discussions (Day 3 - Day 7)
psuhoffman replied to WxUSAF's topic in Mid Atlantic
That’s just about the textbook location of every significant DC snowstorm. Wouldn’t mind it deepening a few more MB. -
January Storm Term Threat Discussions (Day 3 - Day 7)
psuhoffman replied to WxUSAF's topic in Mid Atlantic
UK is perfectly acceptable. 4-6” through 144 and still snowing -
January Storm Term Threat Discussions (Day 3 - Day 7)
psuhoffman replied to WxUSAF's topic in Mid Atlantic
0z bullseyed northern VA. I don’t think we want it to keep trending south at this point. It’s good...especially for us...right now. 6z was good. Just pointing that out. -
January Storm Term Threat Discussions (Day 3 - Day 7)
psuhoffman replied to WxUSAF's topic in Mid Atlantic
DC has had 1 warning event in 6 years and were tossing a 6-8” snowstorm as a fail now????? -
January Storm Term Threat Discussions (Day 3 - Day 7)
psuhoffman replied to WxUSAF's topic in Mid Atlantic
I’m cautiously optimistic. I would probably be even more so if not for the recent burn. It’s almost an identical setup to the one I liked so much this week only this time so far no sign of rogue waves to mess it up. -
January Storm Term Threat Discussions (Day 3 - Day 7)
psuhoffman replied to WxUSAF's topic in Mid Atlantic
It obviously doesn’t know our climo and commitment to suck -
January Storm Term Threat Discussions (Day 3 - Day 7)
psuhoffman replied to WxUSAF's topic in Mid Atlantic
This is about the range where the euro finished making its big southward adjustments the last few waves. So I’m hopeful this time we’re close to where it latches on and it’s only minor adjustments from here on out. But yea we don’t want much more south at this point.