
LakePaste25
-
Posts
1,351 -
Joined
-
Last visited
Content Type
Profiles
Blogs
Forums
American Weather
Media Demo
Store
Gallery
Everything posted by LakePaste25
-

2026-2027 Record-breaking El Nino
LakePaste25 replied to Stormchaserchuck1's topic in Weather Forecasting and Discussion
I don’t know if this can be claimed with certainty yet. It’s also important not to use too much recency bias when it’s likely going to be the most powerful event on record. I’d be more skeptical if this was like 23-24. Even beyond 15-16 this event is in a league of its own. But, we will also have our own variations of winter forecasts this Fall and we can always look back on them. -
2026-2027 Record-breaking El Nino
LakePaste25 replied to Stormchaserchuck1's topic in Weather Forecasting and Discussion
A lot of times, these seasonal models lean too heavily into the ENSO state. Same with the CPC seasonal outlooks. We saw that the last 2 winters with too much emphasis on the SE ridge in the East. Since this El Niño is going to be very strong to historic, I feel that the generic outlooks for the seasonal mean this winter will end up being more accurate. We will also need to see if the pacific jet strengthens this Fall and begins to reverse the -PDO. -
2026-2027 Record-breaking El Nino
LakePaste25 replied to Stormchaserchuck1's topic in Weather Forecasting and Discussion
-
2026-2027 Record-breaking El Nino
LakePaste25 replied to Stormchaserchuck1's topic in Weather Forecasting and Discussion
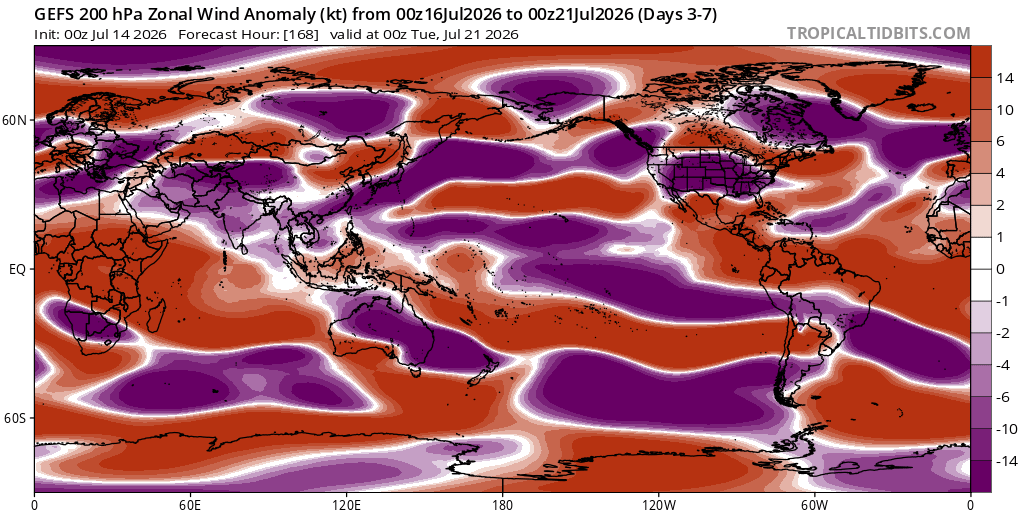
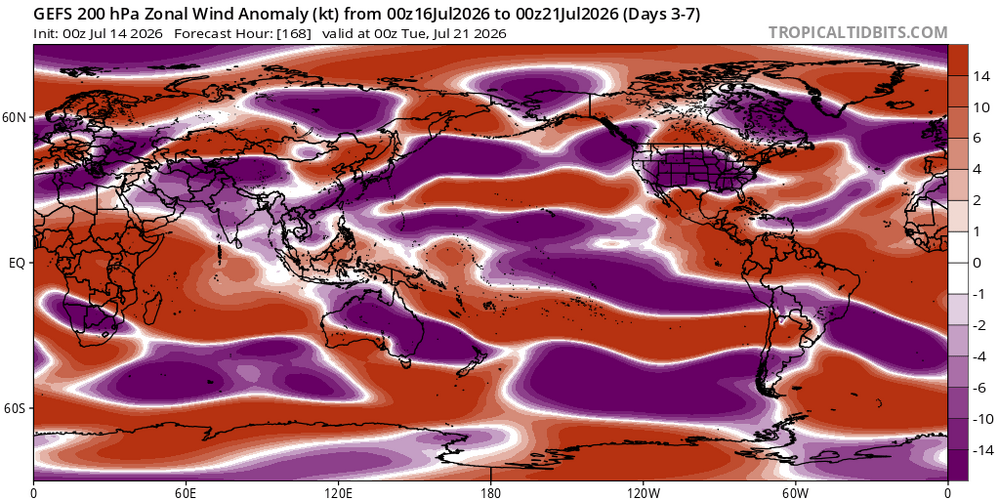
Definitely a lack of +U out there in the N pac. Wonder if this changes in the Fall.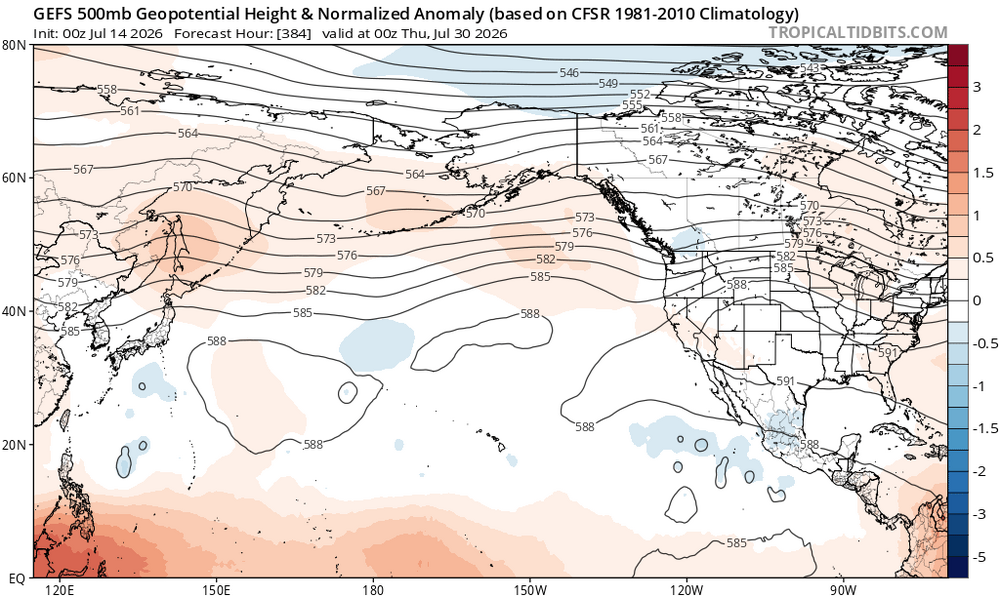
-
2026-2027 Record-breaking El Nino
LakePaste25 replied to Stormchaserchuck1's topic in Weather Forecasting and Discussion
The big question is, does the +ENSO signal become so strong by winter that its forcing overwhelms it in the seasonal mean? Do we start to see the -PDO finally reverse? -
2026-2027 Record-breaking El Nino
LakePaste25 replied to Stormchaserchuck1's topic in Weather Forecasting and Discussion
Hadley cell expansion is actually increasing the size and latitude (poleward) of subtropical ridging. Not *every ridge* but subtropical ridges. https://acp.copernicus.org/articles/20/5249/2020/index.html But to your point, that’s also true that baseline GPH goes up as well. That’s why whenever I look at past years, I use the climate period that fits that year whenever possible. For example: 1972 -> use 1961-1990 1982 -> use 1971-2000 etc otherwise it’s difficult to pick out a signal when these past years have too much troughing using the much warmer 1991-2020 baseline. Unfortunately the tools that use the correct climate period are not always available. -
2026-2027 Record-breaking El Nino
LakePaste25 replied to Stormchaserchuck1's topic in Weather Forecasting and Discussion
-
2026-2027 Record-breaking El Nino
LakePaste25 replied to Stormchaserchuck1's topic in Weather Forecasting and Discussion
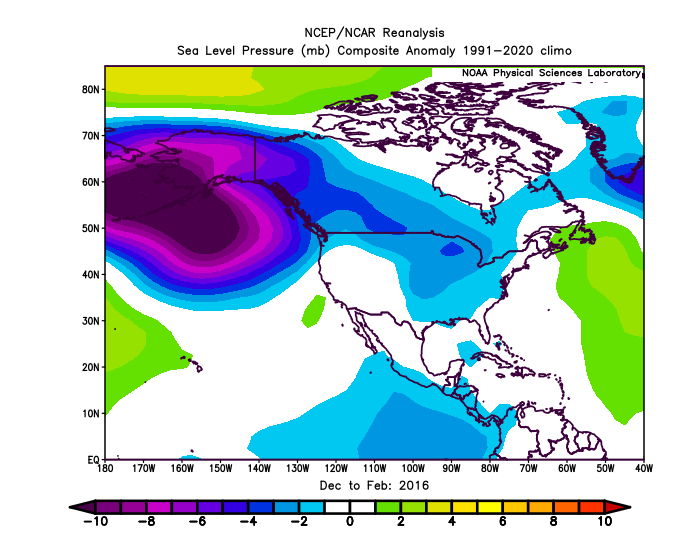
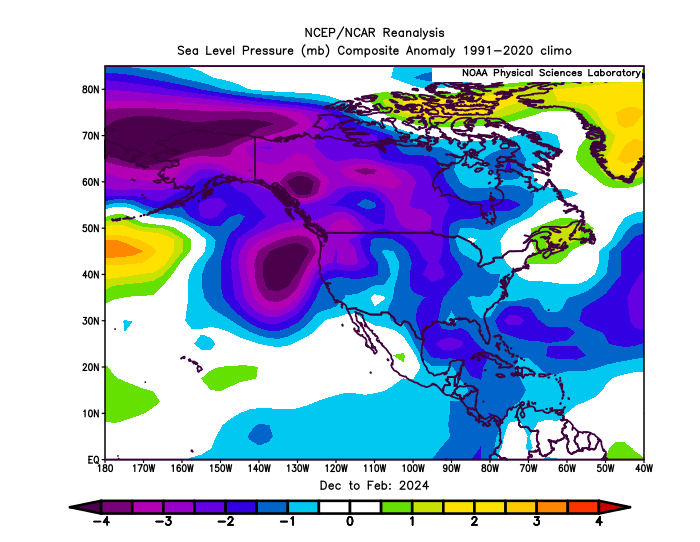
The stronger ridges and weaker troughs are likely playing a huge role. If you look at SLP, it’s less muted. However, still some subtle differences between the events.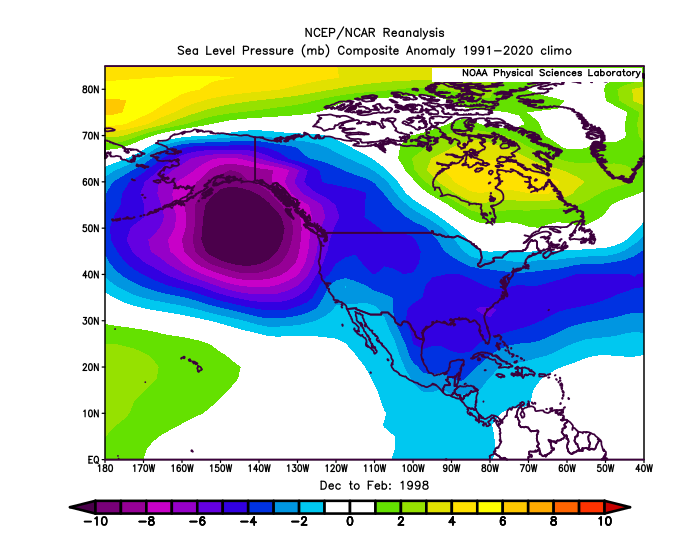
-
2026-2027 Record-breaking El Nino
LakePaste25 replied to Stormchaserchuck1's topic in Weather Forecasting and Discussion
that low west of the aleutians is something to watch since it actually has a meaningful correlation with less noise. -
2026-2027 Record-breaking El Nino
LakePaste25 replied to Stormchaserchuck1's topic in Weather Forecasting and Discussion
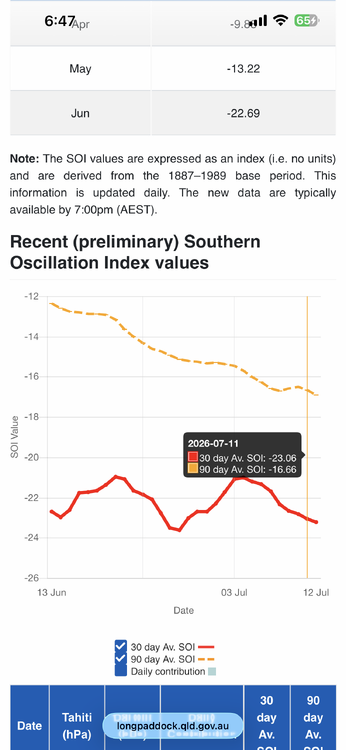
Yes. Every indicator points to it. I’m not really too concerned with a summertime 500 mb dataset that has a sample size of 4. Much of the cool summer Ninos were derived from -NAO which is less correlated.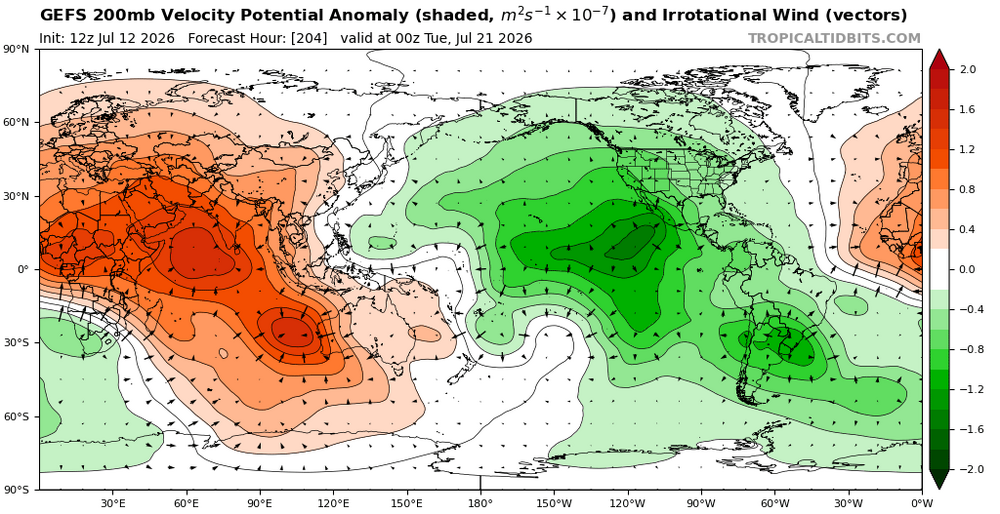
-
2026-2027 Record-breaking El Nino
LakePaste25 replied to Stormchaserchuck1's topic in Weather Forecasting and Discussion
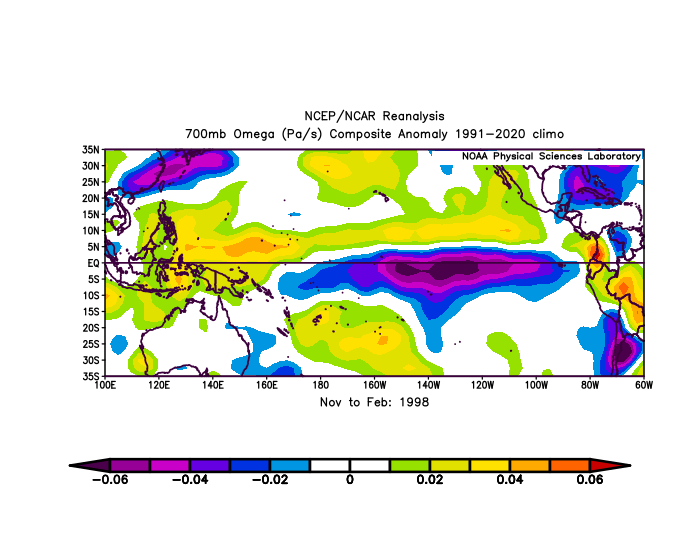
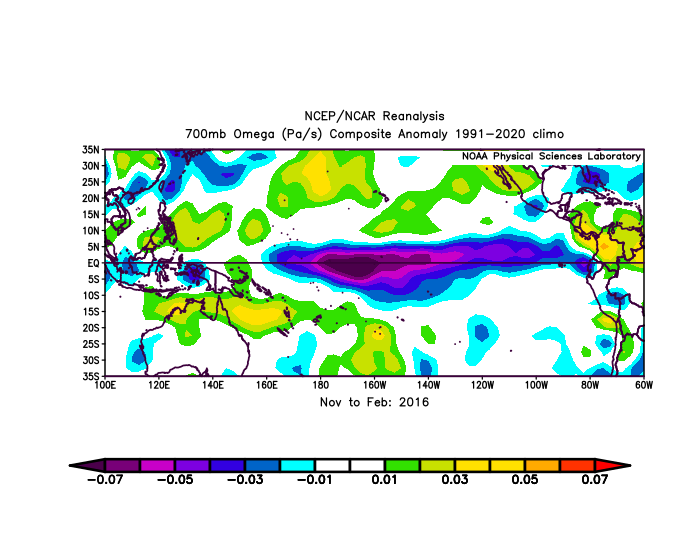
July should be our first “fully coupled” month. Come August, will need to find a site that plots omega since NCAR is discontinued. Would like to compare it to past super nino July’s. -
2026-2027 Record-breaking El Nino
LakePaste25 replied to Stormchaserchuck1's topic in Weather Forecasting and Discussion
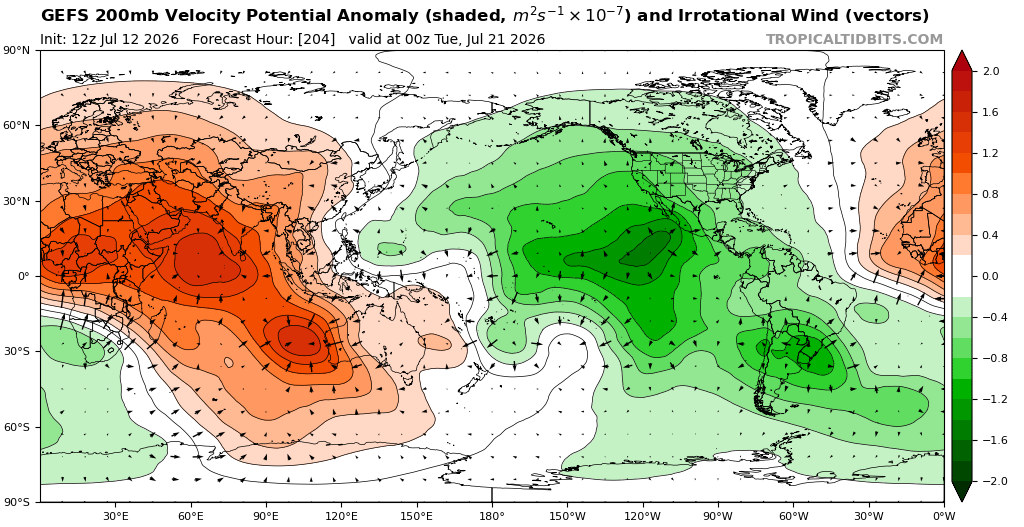
Yeah…if you look at 2016, the convection is very far west. Should be east of that IMO although we will really put that theory to the test if it’s “not cool enough” to stop convection there.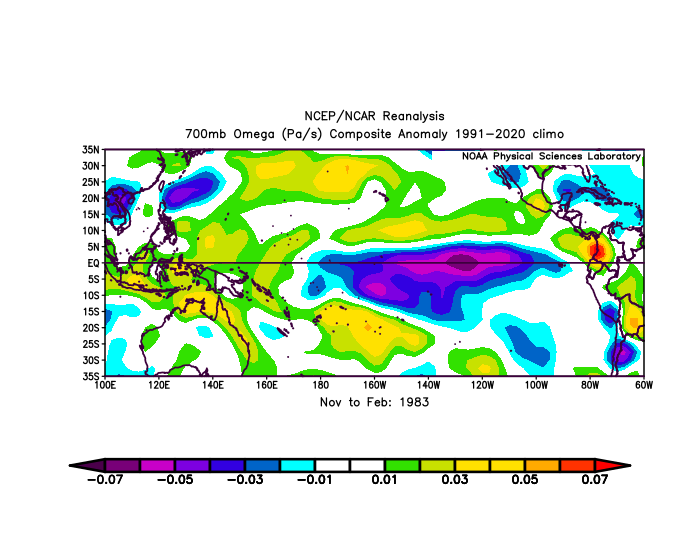
-
2026-2027 Record-breaking El Nino
LakePaste25 replied to Stormchaserchuck1's topic in Weather Forecasting and Discussion
I’m leaning towards a more canonical super Nino response than 15-16, but not quite to the level of 97-98. -
2026-2027 Record-breaking El Nino
LakePaste25 replied to Stormchaserchuck1's topic in Weather Forecasting and Discussion
We will see. I don’t deny that there could be *some* destructive interference. I’m just arguing that the event will be so strong and well-coupled that it won’t have a significant outcome that diverges from the canonical El Niño winter pattern (GOA low, strong southern stream, above normal N Tier, and wet S tier). 97-98 likely had constructive interference. -
2026-2027 Record-breaking El Nino
LakePaste25 replied to Stormchaserchuck1's topic in Weather Forecasting and Discussion
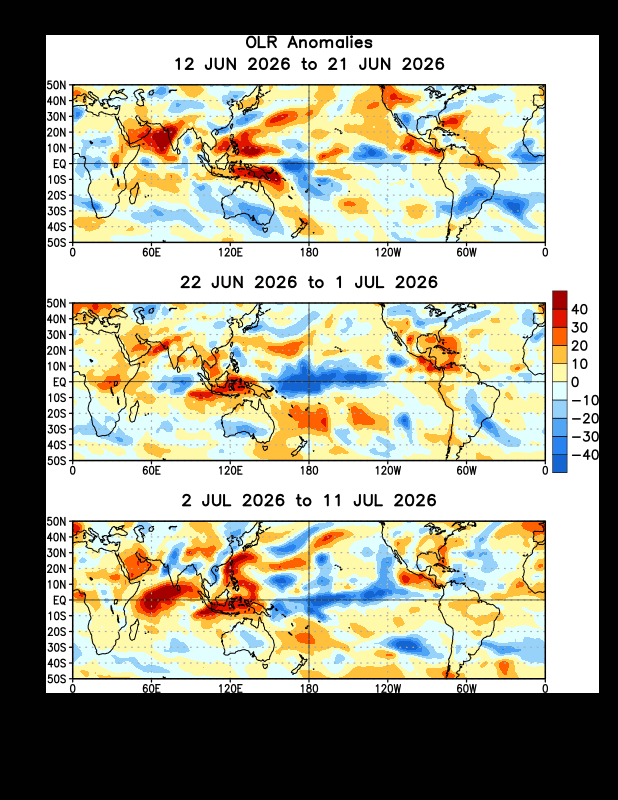
OLR is exactly what you’d expect in July for an E based Nino. Note the convection going north as you go east…that’s consistent with climatology this time of year due to the Humboldt current which impacts Nino 1+2.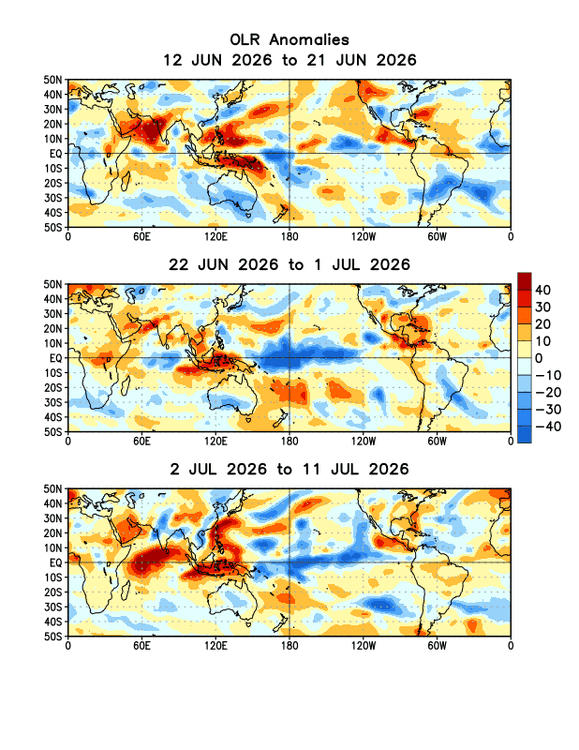
-
2026-2027 Record-breaking El Nino
LakePaste25 replied to Stormchaserchuck1's topic in Weather Forecasting and Discussion
15-16 was an oddball. Unusually strong MC forcing in december and in Jan/Feb the E Pac convection was unusually far north (failed to collapse near the equator as it’s supposed to do during winter), which actually enhanced Baja ridging as it was the descending branch of the Hadley Cell. Both of these factors helped contribute to the record warm December and the Mid Atlantic blizzard. -
2026-2027 Record-breaking El Nino
LakePaste25 replied to Stormchaserchuck1's topic in Weather Forecasting and Discussion
My opinion is that it’s such a strong looking event that you leave less room for things such as the PDO to influence the pattern, especially when it can potentially flip. It’s still early in its development. Previous winters the ENSO state was fairly weak so there were more opportunities for competing influences to destructively or constructively interfere. -
2026-2027 Record-breaking El Nino
LakePaste25 replied to Stormchaserchuck1's topic in Weather Forecasting and Discussion
I’m towards the “it’ll be a canonically coupled event” camp. And for the record I disagreed with takes during 24-25 and 25-26 that we’ll see predominate RNA pattern (we didn’t). So i’m not just saying it because I want it to be warm. -
2026-2027 Record-breaking El Nino
LakePaste25 replied to Stormchaserchuck1's topic in Weather Forecasting and Discussion
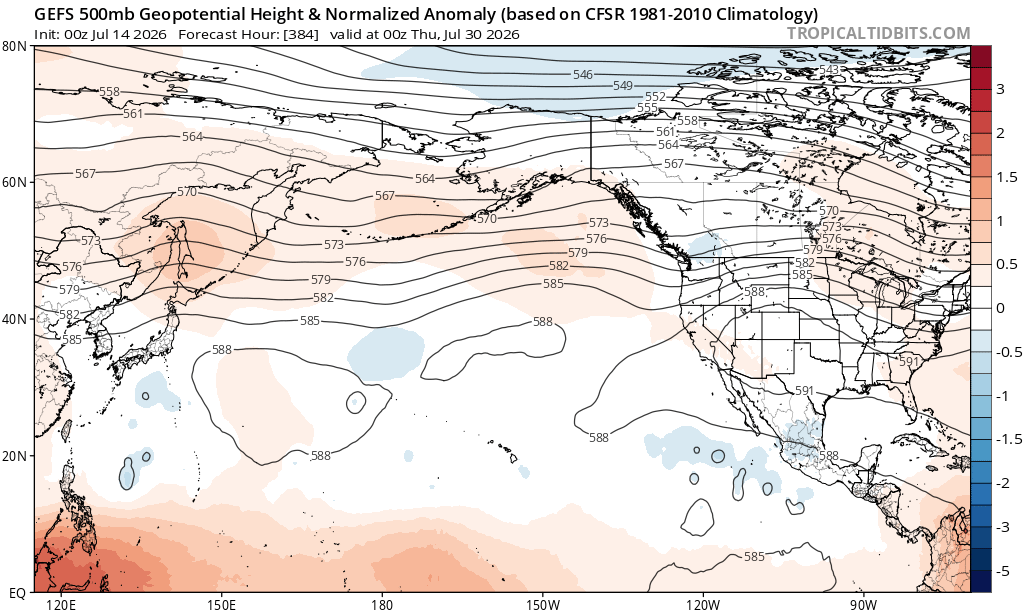
It’s related to El Niño. It’s just a shifted pattern from past ones. My guess is the lack of arctic ridging (which is weakly correlated with +ENSO) and AGW are allowing the ridge to go further south and be much stronger. -
2026-2027 Record-breaking El Nino
LakePaste25 replied to Stormchaserchuck1's topic in Weather Forecasting and Discussion
It’s free on Alex Boreham’s site (cyclonicwx.com) SST page. That second link I posted is from a forecaster that went and tabulated it for past ENSO events which isn’t paywalled either.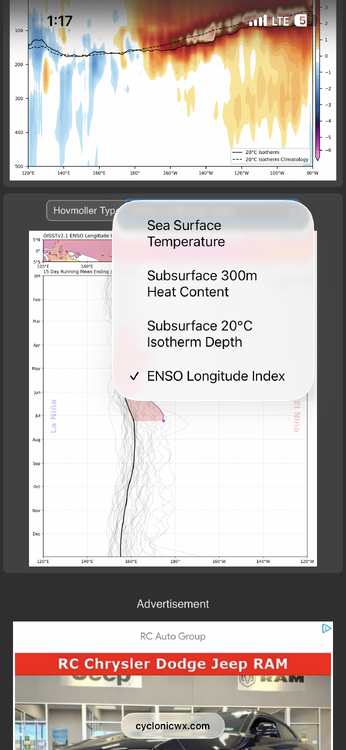
-
2026-2027 Record-breaking El Nino
LakePaste25 replied to Stormchaserchuck1's topic in Weather Forecasting and Discussion
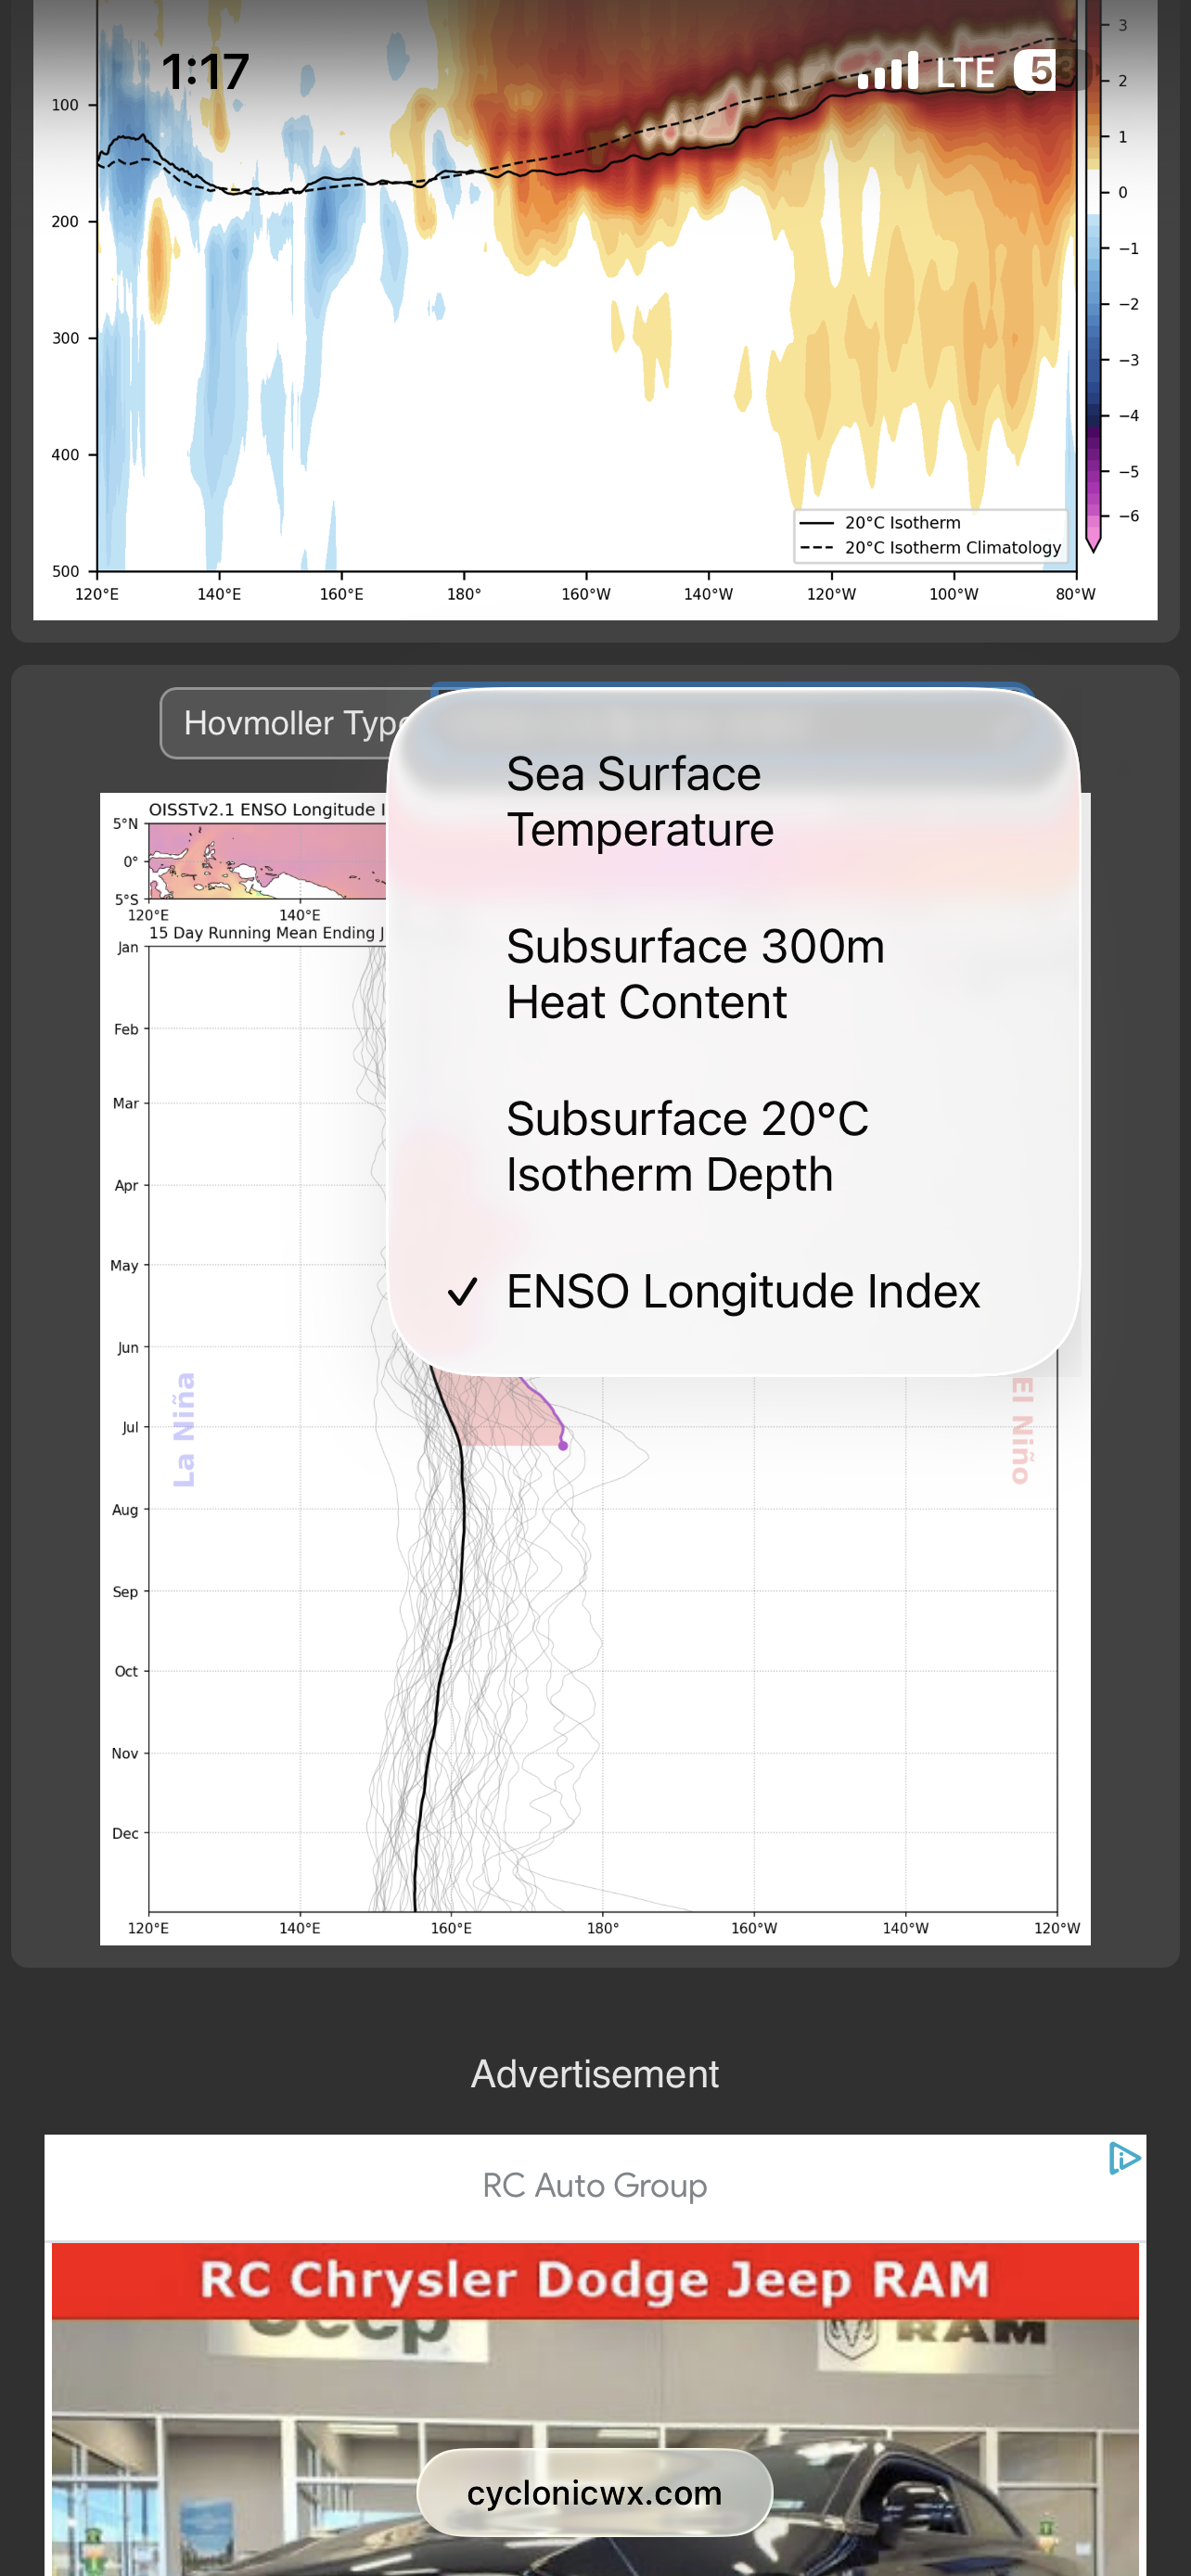
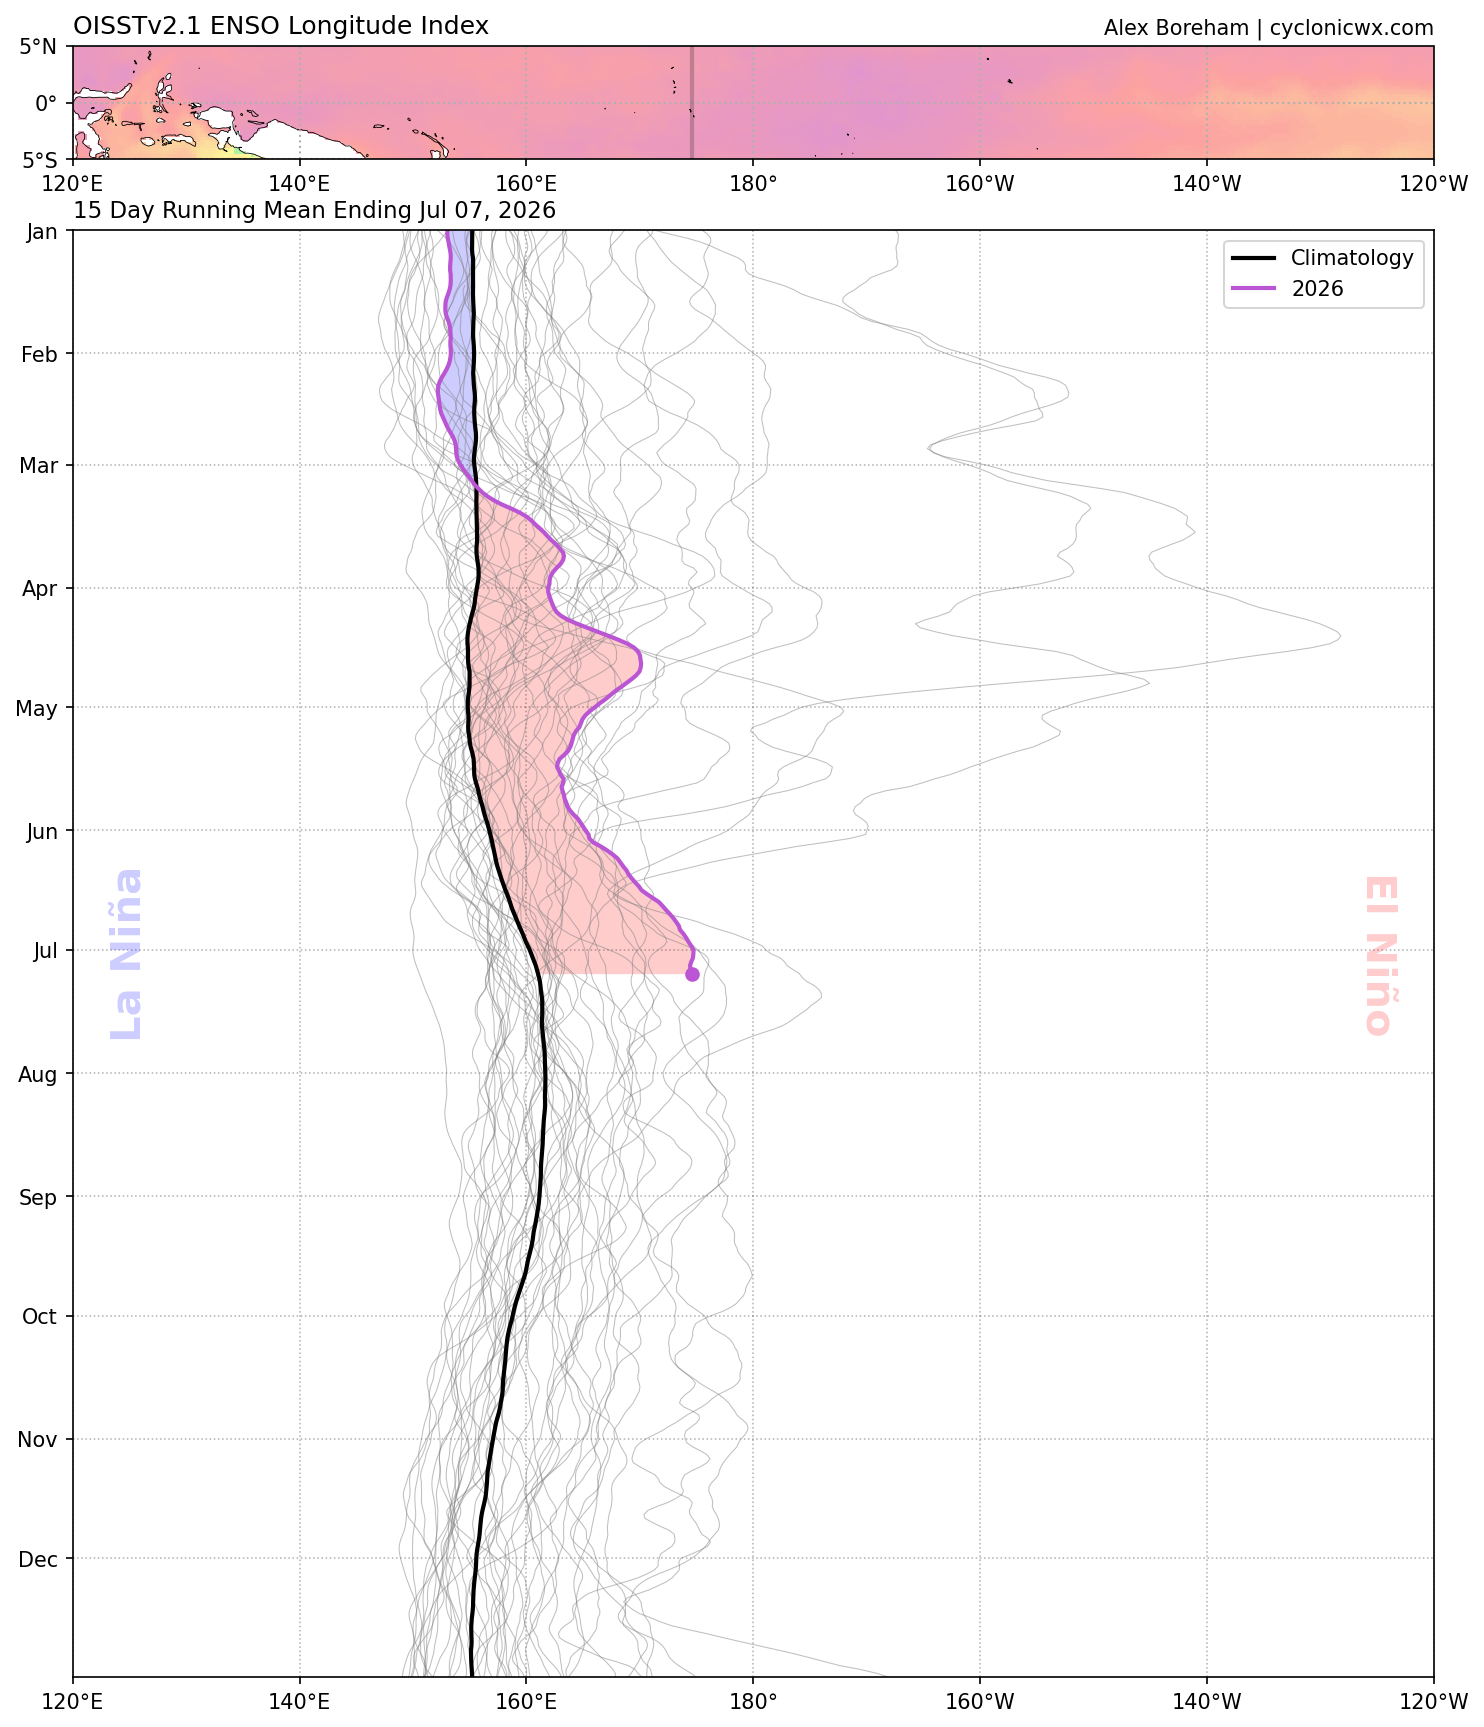
Enso longtidue index. It’s a fairly new index that’s used to calculate the longitude in the tropical pacific (between 5N and 5S) where it’s most supportive of deep tropical convection regardless of actual SSTA. Threshold for deep tropical convection is dynamic year-year as it incorporates mean tropics SST. https://agupubs.onlinelibrary.wiley.com/doi/full/10.1029/2018GL079203 There’s actually a page that calculates past events with it: https://ggweather.com/enso/eli.htm Looks like they assign the 97-98 event as the highest (note that the 220 peak is the same as 140W). -
2026-2027 Record-breaking El Nino
LakePaste25 replied to Stormchaserchuck1's topic in Weather Forecasting and Discussion
ELI has already surpassed most of the historical events. i would expect this to go further east as that 30C isotherm moves east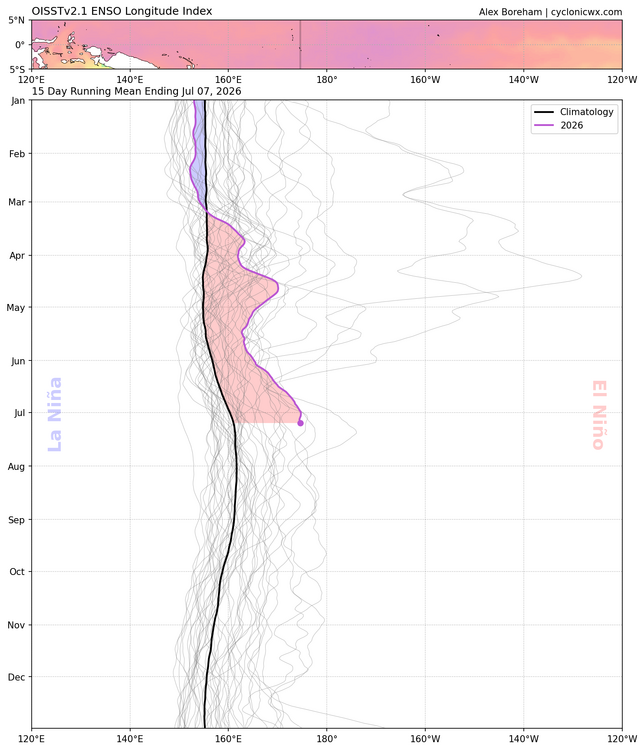
-
2026-2027 Record-breaking El Nino
LakePaste25 replied to Stormchaserchuck1's topic in Weather Forecasting and Discussion
What a few of us have been saying on here: -
2026-2027 Record-breaking El Nino
LakePaste25 replied to Stormchaserchuck1's topic in Weather Forecasting and Discussion
I’d argue against -PNA in general if we see less MC forcing. Even the extreme jet extensions under Eastern Pacific forcing are usually “bootleg” +PNA/+EPO as the Aleutian Low reaches the western US. Still mild for the NE. Then if forcing shifts back towards dateline, can get periods of +PNA/-EPO with actual cold air to work with. -
2026-2027 Record-breaking El Nino
LakePaste25 replied to Stormchaserchuck1's topic in Weather Forecasting and Discussion
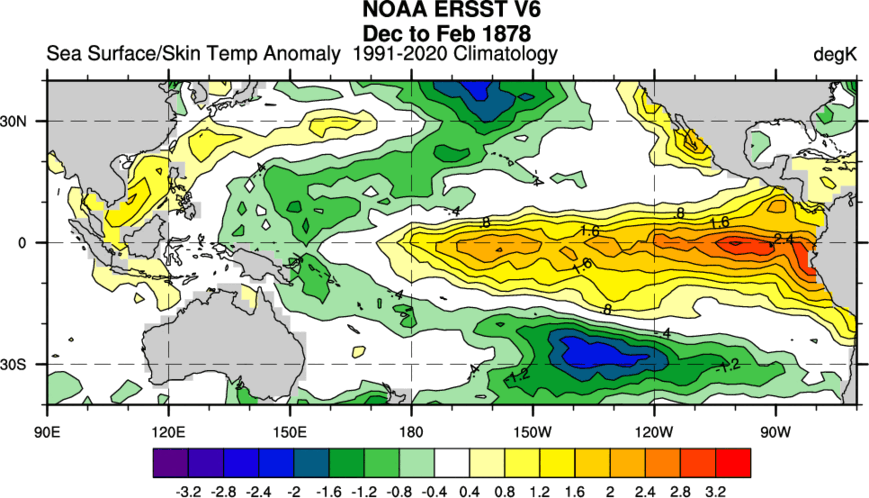
1877-78 is probably the closest to an extreme east based event. Unfortunately I cannot change the 1991-2020 climatology for this map (not an option), so you have to extrapolate that the anomalies in Nino 3 here were likely extreme for its time since the baseline SST’s have warmed since then.