salbers
-
Posts
644 -
Joined
-
Last visited
Content Type
Profiles
Blogs
Forums
American Weather
Media Demo
Store
Gallery
Everything posted by salbers
-
Yes this hurricane's large size gives it more total energy and more impact - thus its peak winds (category) are only part of the story.
-
Also - trying to get more colorful on the IR satellite over the past 24 minutes: https://col.st/3Kpaw
-
Looks like a slow motion to the N on the edge of this CRP radar display:
-
At least on IR satellite the shape resembles having an eye: https://col.st/Y7YNB
-
Convective spiral bands trying to develop to slowly surround the center, on 1-minute visible satellite: https://col.st/GoDgr
-
1-minute visible imagery showing convection firing close to the circulation center: https://col.st/WYbsy
-
1-minute visible imagery: https://col.st/zFFam
-
Live camera in New Mexico at night, along with sky simulation: https://stevealbers.net/allsky/allsky_las.html las_2307003.mp4
-
Live Sky simulations and verifying cameras from three locations: CU-Boulder: https://stevealbers.net/allsky/allsky_atoc.html Golden Colorado: https://stevealbers.net/allsky/allsky_nrel.html Dark Sky New Mexico: https://stevealbers.net/allsky/allsky_las.html nrel_2307016.mp4
-
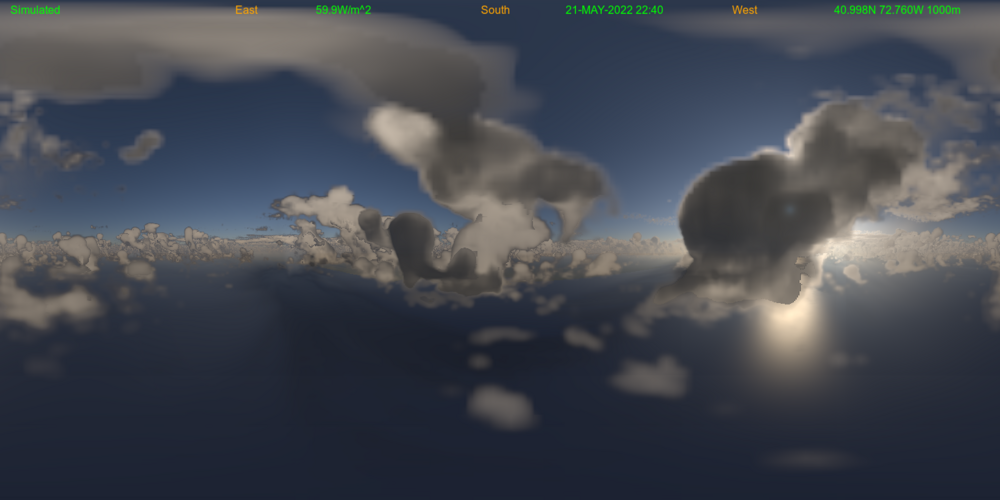
Here is a sky simulation of an LES cloud model using a visualization package I developed. The cloud model data at 40m resolution is from the University of Connecticut. The imagery is designed to be photo-realistic (matching human color perception) and physically based. http://stevealbers.net/allsky/cases/les/les_15deg_cyl.mp4 (fly through) http://stevealbers.net/ (home page) https://cfd.engr.uconn.edu/data/ (UConn cloud data) Steve
- 1 reply
-
- 2
-

-

-
Yes a radar indicated tornado warning heading towards Slidell.
-
Eye is almost closed now on IR, yet the cirrus is translucent enough to still look better on the visible satellite.
-
Some cirrus spilling over the eye in IR satellite, though still looks strong in visible. https://weather.cod.edu/satrad/?parms=subregional-E_Gulf_Coast-14-24-1-100-1&checked=map&colorbar=undefined
-
Grand Isle Current Tide: https://tidesandcurrents.noaa.gov/waterlevels.html?id=8761724
-
Those hot towers are really zipping around the north side of the eye the past few minutes.
-

-
Current Mesoscale Sector visible loop (click URL for latest) https://rammb.cira.colostate.edu/ramsdis/online/loop.asp?data_folder=goes-16/mesoscale_01_band_02_sector_05&width=1000&height=1000&number_of_images_to_display=40&loop_speed_ms=80
-
More eyewall development - an inside view:
-
Thanks Tip - the direct link is here where you can save the images as an animated GIF. It's from the mesoscale goes16 sector, band 2, 1 minute time interval. The website is from CIRA/RAMMB in Ft. Collins where they have lots of good satellite stuff. https://rammb.cira.colostate.edu/ramsdis/online/loop.asp?data_folder=goes-16/mesoscale_02_band_02_sector_02&width=1000&height=1000&number_of_images_to_display=40&loop_speed_ms=80 Other related links: https://rammb.cira.colostate.edu/ramsdis/online/goes-16.asp https://rammb-slider.cira.colostate.edu/?sat=goes-16&sec=mesoscale_02&x=1000&y=1000&z=0&angle=0&im=12&ts=1&st=0&et=0&speed=130&motion=loop&maps[borders]=white&lat=0&p[0]=band_02&opacity[0]=1&pause=0&slider=-1&hide_controls=0&mouse_draw=0&follow_feature=0&follow_hide=0&s=rammb-slider&draw_color=FFD700&draw_width=6
-
Each sequence looks better with a developing eye:

-
A closer animated view - trying to wrap around a little:

-
Here is some of that convection closer to the center. Animation: https://rammb.cira.colostate.edu/ramsdis/online/loop.asp?data_folder=goes-16/mesoscale_02_band_02_sector_02&width=1000&height=1000&number_of_images_to_display=40&loop_speed_ms=80

-
This advisory does have 195mph... WTPN31 PGTW 312100 MSGID/GENADMIN/JOINT TYPHOON WRNCEN PEARL HARBOR HI// SUBJ/SUPER TYPHOON 22W (GONI) WARNING NR 016// RMKS/ 1. SUPER TYPHOON 22W (GONI) WARNING NR 016 02 ACTIVE TROPICAL CYCLONES IN NORTHWESTPAC MAX SUSTAINED WINDS BASED ON ONE-MINUTE AVERAGE WIND RADII VALID OVER OPEN WATER ONLY --- WARNING POSITION: 311800Z --- NEAR 13.7N 125.1E MOVEMENT PAST SIX HOURS - 250 DEGREES AT 14 KTS POSITION ACCURATE TO WITHIN 010 NM POSITION BASED ON EYE FIXED BY A COMBINATION OF SATELLITE AND RADAR PRESENT WIND DISTRIBUTION: MAX SUSTAINED WINDS - 170 KT, GUSTS 205 KT
-
I only see Signal #4 on their website 2am bulletin linked here: http://pubfiles.pagasa.dost.gov.ph/tamss/weather/bulletin/SWB%2312.pdf However they did post a SIgnal #5 on Twitter: https://twitter.com/dost_pagasa/status/1322612280987541504
-
Here is some more live force-13 coverage: