

salbers
-
Posts
644 -
Joined
-
Last visited
Content Type
Profiles
Blogs
Forums
American Weather
Media Demo
Store
Gallery
Everything posted by salbers
-
We are trying to use scientific references when possible. That should qualify at least some of the posts in this thread? We are mainly speculating in advance of future publications that should help clarify things.
-
Thanks for helping to clarify what was in a sense a raw blog (yet informative) post. And yes, the audio interview is earlier from March 2010. Perhaps it's the symposium from November 2011 that had some larger numbers? I would greatly doubt that 3.5Gt/yr is already occurring though it might potentially occur at some point. I'm checking to see if the symposium website has any further details - so far no luck. I elsewhere see this 2008 EGU reference that suggests a potential short-term release of 50Gt in the future. http://www.cosis.net...008-A-01526.pdf
-
http://cid-yama.livejournal.com/368223.html Non-gradual methane releases from ESAS quantified From a symposium November 30th. Bad news: directly observed fluxes exceed estimated by up to 3 orders of magnitude Interpretation of acoustical data recorded with deployed multibeam sonar allowed moderate quantification of bottom fluxes as high as 44 g/m2/d (Leifer et al., in preparation). Prorating these numbers to the areas of hot spots (210×103 km2) adds 3.5Gt to annual methane release from the ESAS. This is enough to trigger abrupt climate change. link That's in addition to the 8 tg from non-abrupt releases. This is the figure we were waiting on. This is the estimated additional releases from abrupt non-linear sources. 3.5 Gt a year. See Shakhova Interview
-
We should keep in mind that if we assume the 1400Gt is ready to release (from the 2011 AGU abstract), a 100 fold increase over the current 6Mt / year is only 0.6 Gt. This is only 1/2000 of the amount stated as ready to release. At a minimum we should have more researchers sent to the ESAS to tell us why such an increase would be impossible.
-
Yes, good to see your posts in the second RC thread. I had posted briefly in the first one.
-
Was the RealClimate thread posted by David Archer? I've cited his papers before in this forum on the long term residence of CO2 in the atmosphere/ocean system. So far from my reading this provides some good background information and perspective. Such as a Gigaton of sudden release is about like a volcano's temporary effect (though opposite in sign). And as WeatherRusty mentioned in the longer term it's more a function of the CO2 that Methane converts into. The thread also confirms what I suggested earlier that we need another 1-2 orders of magnitude for the Arctic release to be really significant. Here is a link to satellite vs. ground based comparisons: http://www.agu.org/p...1GL047871.shtml Back to the present - one day surface temperature anomalies are pretty warm in the Arctic: http://www.esrl.noaa...s.fnl.anim.html
-
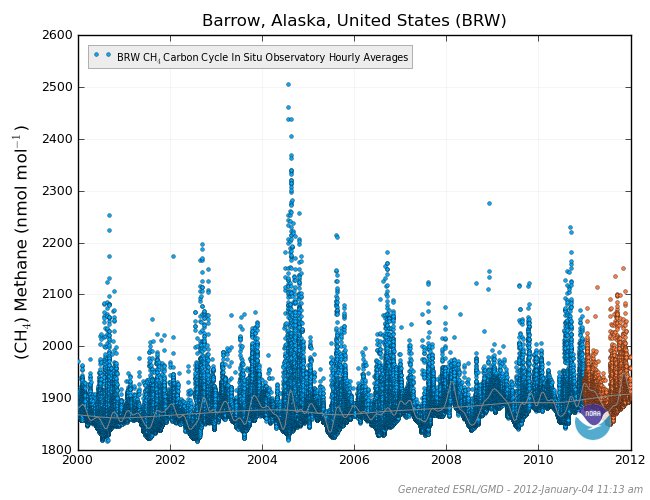
I'm not sure I'm ready to state that the Barrow surface measurements are inaccurate (beyond occasional flask QC issues). For one thing, the AIRS for 2011 image posted earlier does show a CH4 rise near Barrow in the autumn (November compared with August). Perhaps the peak areas miss Barrow, yet the values at Barrow still rise. Also recall my earlier post about the agreement between the hourly in-situ measurements and the flasks. Secondly, it's possible that levels at the surface will be different than at 400mb. Also, the surface measurements have more autumnal rise in some years compared with others, just like the satellite.
-
I also think looking more at the hourly in-situ data would help give a better picture in real-time. It seems to be close to the same accuracy as the weekly flasks.
-
While we wait for Bethesda, I'll suggest that the 35ppb jump does show up at Barrow if you look at the running mean curve (plotted on top of the dots). The seasonal jump shows up during the second half of 2011. We can put this jump in perspective over the past decade of seasonal swings. http://www.esrl.noaa...am=ccgg&type=ts Also the longer term trend is up about 5ppb per year for the past 5 years as I eyeball this graph. Over the past several decades we did have some strong rises in the 1990s as mentioned earlier: http://en.wikipedia.org/wiki/File:Mlo_ch4_ts_obs_03437.png
-
Interesting plots. Just for reference I estimate that a 8Tg increased release (over a year) should raise global CH4 concentratoins by about 3ppb. Over a local high latitude area it could be more if there hasn't been enough time for dispersion.
-
The thing is though that the Arctic methane stores have the potential to overwhelm the other sources.
-
I think albedo feedbacks are part of the game though?
-
There are ice cores that show the history of methane changes in the atmosphere (seen earlier in this thread). It's unclear what time resolution they have for various points in the past. As I've said the present Arctic methane release may be related to the uptick in the global methane, though I'd agree it isn't proven yet and it isn't impacting the climate yet. It's great that we have the hourly (and weekly) monitoring at Barrow and other stations (along with satellite), so if the 8Tg per year really does increase by several fold or more we'll have a good way to assess and confirm the local observations of the ESAS. Future climate impact is possible as it's probably been a long time since the ESAS has been this free of ice and this warm. So this isn't so much a theory as something unfolding that we can watch in near real-time. It is though a good question as to how to go about making an informed prediction of future releases. What is yours?
-
I think the "brochure" poster may be different from what was presented in the regular poster session at AGU. The title and author list are different. They are both related in subject matter though. One is more geared to the public, while the other abstract is geared more towards a scientific audience. It would be interesting if we can find a copy of the more scientific one (if they are in fact separate). I looked on the AGU eposter site and it wasn't there. Can it be found somewhere else? I did find this informative presentation from Nov 2010 by the same authors: http://www.google.co...e7ONJrQdh4-r8Sw In this presentation are they saying we're already above the 8Tg per year emission by orders of magnitude? I think the observed uptick in the global CH4 concentration over the past few years is roughly consistent with an 8Tg per year emission rate, not yet higher than that. This is a fairly simple calculation to make if we wanted to pin it down more.
-
That will be interesting to track. I think the total amount of methane in the atmosphere is about 5000 Tg (teragrams) or 5 gigatons. By the way here is the 2011 AGU abstract. I was at this conference, though I didn't know ahead of time to check out this poster. I wonder if the poster is available online somewhere, beyond the "brochure" we've seen? ................................................................................................................................................... AGU Fall Meeting THURSDAY, DECEMBER 08, 2011 GC41B-0794. Ebullition-driven fluxes of methane from shallow hot spots suggest significant under-estimation of annual emission from the East Siberian Arctic Shelf Natalia E. Shakhova; Igor P. Semiletov; Anatoly Salyuk; Chris Stubbs; Denis Kosmach; Orjan Gustafsson ABSTRACT FINAL ID: GC41B-0794 TITLE: Ebullition-driven fluxes of methane from shallow hot spots suggest significant under-estimation of annual emission from the East Siberian Arctic Shelf SESSION TYPE: Poster SESSION TITLE: GC41B. Permafrost and Methane: Monitoring and Modeling Fluxes of Water and Methane Associated With Arctic Changing Permafrost and Coastal Regiona I Posters AUTHORS (FIRST NAME, LAST NAME): Natalia E Shakhova1, 2, Igor Peter Semiletov1, 2, Anatoly Salyuk2, Chris Stubbs3, Denis Kosmach2, Orjan Gustafsson4 INSTITUTIONS (ALL): 1. IARC, Univerrsity Alaska Fairbanks, Fairbanks, AK, United States. 2. Laboratory of Arctic Research, Pacific Oceanological Institute FEBRAS, Vladivostok, Russian Federation. 3. University of California, Marine Science Institute, Santa Barbara, CA, United States. 4. Institute of Applied Environmental Research, Stockholm University, Stockholm, Sweden. Title of Team: ABSTRACT BODY: The high-latitude, shallow ESAS has been alternately subaerial and inundated with seawater during glacial and interglacial periods respectively. Subaerial conditions foster the formation of permafrost and associated hydrate deposits whereas inundation with relatively warm seawater destabilizes the permafrost and hydrates. Our measurements of CH4 in 1994-2000 and 2003-2010 over ESAS demonstrate the system to be in a destabilization period. First estimates of ESAS methane emissions indicated the current atmospheric budget, which arises from gradual diffusion and ebullition, was on par with estimates of methane emissions from the entire World Ocean (≈8 Tg-CH4). Large transient emissions remained to be assessed; yet initial data suggested that component could increase significantly annual emissions. New data obtained in 2008-2010 show that contribution of ebullition-driven CH4 fluxes from shallow hot spots alone could multiply previously reported annual emission from the entire ESAS. KEYWORDS: [0330] ATMOSPHERIC COMPOSITION AND STRUCTURE / Geochemical cycles, [0312] ATMOSPHERIC COMPOSITION AND STRUCTURE / Air/sea constituent fluxes, [0428] BIOGEOSCIENCES / Carbon cycling, [4219] OCEANOGRAPHY: GENERAL / Continental shelf and slope processes. SPONSOR NAME: Natalia Shakhova
-
Yes I think I had noticed that line too and it might have been correct in 2008. When we say 3-4 orders of magnitude though, over what region are we talking about? The Arctic emissions overall are something like 10-20% of the total global emissions, and that is what supposedly increased by 1/3 on the link at the methane alert site. Here is a wikipedia page that breaks down the various emissions. It would be interesting to try to put some numbers on how these components are changing. http://en.wikipedia....spheric_methane Here's a quote from the paper in the previous post: ............................................................................................................................................................ The annual outgassing from the shallow ESAS of Tg C-CH4 is of the same magnitude as existing estimates of total CH4 emissions from the entire world ocean (1, 25). Although the oceanic CH4 flux should be revised, the current estimate is not alarmingly altering the contemporary global CH4 budget. These findings do change our view of the vulnerability of the large sub-sea permafrost carbon reservoir on the ESAS; the permafrost “lid” is clearly perforated, and sedimentary CH4 is escaping to the atmosphere. ......................................................................................................................................................... So that is about 8Tg per year from the ESAS, compared ot about 600Tg per year of global emissions (unless the units are actually different - Tg of Carbon vs. CH4). So we do have 1-2 orders of magnitude to go before this becomes globally significant. The question is how fast will this emission grow?
-
Here is a U.S. Government report from 2008 on methane emissions. It says we have 1000 years before this is a big factor, though I wonder what they would say if the report were updated with the latest data. http://downloads.cli...-report-ch5.pdf There also seems to be enough uncertainty so that at least some noticeable climate impact would be possible during this century.
-
The degree of alarmism is in the eye of the beholder. It is stated on that Methane alert site that the amount being released is still relatively small on a climate forcing basis, though it has increased by about 1/3 in the Arctic region in recent years. The question is what is the probability this increase will continue, and even accelerate on a geometric basis as the rapid warming continues? On another note, perhaps we need more methane monitoring stations in Siberia and other permafrost areas.
-
Yes, that agrees with the eposter about Arctic CH4 levels rising quite a bit in the past 5 years. I also see a trend in the AIRS data at latitudes around 60N where there's more rise over land rather than over the ocean. Perhaps related to soil/vegetation release?
-
Yes, here is a related poster that summarizes some of these issues: http://eposters.agu....12/Poster-2.pdf
-
What then is the reason global methane values have drifted more upward the past 4-5 years? Could it be from surface vegetation in warmer and wetter sub-arctic areas? What's happening in the arctic is significant on a global scale if you look at the higher average methane readings at high latitudes (post #66). This is a significant source region I would think.
-
Good question, hard to say for sure. I see in post #322 a periodicity in the spikes that seems to be of an annual frequency. And for 2011 in Barrow there were more spikes between June and November compared with other months. In post #319 (top figure) we see more spikes Jun-Nov in both 2009 and 2010, though not so much in 2008. I'm unsure if the seasonal trend of mean values (as you show in monthly means at Barrow) is well correlated to the frequency of spikes or not.
-
Yes, looks like more spikes in the warmer months when the soil is thawing and vegetation is active.
-
Unsure on the timing - it's been in the works for a while. Here though is a poster on Carbon Tracker for some general info and its extension called Carbon Tracker Methane is mentioned. http://www.esrl.noaa.gov/gmd/co2conference/posters_pdf/tans_poster.pdf
-
The FTP site is working for me now, and I can see the flagged data available here, though only up to the end of 2010. Column 14 represents the flag settings... ftp://ftp.cmdl.noaa...._ccgg_event.txt