

TheClimateChanger
-
Posts
4,436 -
Joined
-
Last visited
Content Type
Profiles
Blogs
Forums
American Weather
Media Demo
Store
Gallery
Everything posted by TheClimateChanger
-
Central PA Winter 23/24
TheClimateChanger replied to Voyager's topic in Upstate New York/Pennsylvania
I shared this in the Pittsburgh area thread, but figured it would be relevant here as well since there are frequent complaints about the airport readings. I have been seeing a lot of complaints about airport readings everywhere. -
Pittsburgh, Pa Winter 2023-24 Thread.
TheClimateChanger replied to meatwad's topic in Upstate New York/Pennsylvania
-
Interesting. Has snowfall increased or decreased over that time?
-
Winter '23-'24 Piss and Moan/Banter Thread
TheClimateChanger replied to IWXwx's topic in Lakes/Ohio Valley
- 848 replies
-
- 11
-

-
Central PA Winter 23/24
TheClimateChanger replied to Voyager's topic in Upstate New York/Pennsylvania
If we just continuously move our temperature measurements to cooler and cooler locations, we can will away the warming. I think suburban Western Chester County looks like an ideal candidate to utilize for the DC/Baltimore metro. When they moved the official Johnstown station from the city to the top of a mountain, it completely eliminated the warming. Are there any mountains near CXY/MDT? -
Pittsburgh, Pa Winter 2023-24 Thread.
TheClimateChanger replied to meatwad's topic in Upstate New York/Pennsylvania
On the plus side, looks like we may have a green Christmas this year instead of the more typical brown. -
Pittsburgh, Pa Winter 2023-24 Thread.
TheClimateChanger replied to meatwad's topic in Upstate New York/Pennsylvania
Even the NWS is punting the rest of December: -
Pittsburgh, Pa Winter 2023-24 Thread.
TheClimateChanger replied to meatwad's topic in Upstate New York/Pennsylvania
Averaging by month (which applies the current mean for December), we have a 0.5F cushion over 2016, 2012, 1991 & 1949. That means the final monthly mean could fall off a full 6F [6/12 = 0.5] and we'd still tie those years using monthly averaging. I'm kind of doubting December's mean falls off that much over the next three weeks given the current modeling. Note using daily averaging, 2012, 1991 & 1949 bump up one place with a mean of 54.3F.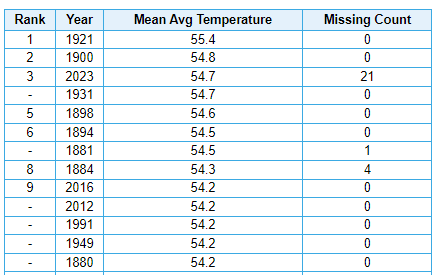
-
Pittsburgh, Pa Winter 2023-24 Thread.
TheClimateChanger replied to meatwad's topic in Upstate New York/Pennsylvania
Not out of the question that we could surpass 2012 for warmest year on record since the official observation site moved out of the city, and warmest overall in the threaded record since 1931. The odds are certainly increasing. -
Pittsburgh, Pa Winter 2023-24 Thread.
TheClimateChanger replied to meatwad's topic in Upstate New York/Pennsylvania
-
December 2023 General Discussion
TheClimateChanger replied to michsnowfreak's topic in Lakes/Ohio Valley
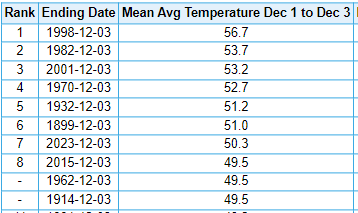
Still the second warmest December 8 on record, dating back 150 years. You can’t complain about that. -
Winter 2023/24 Medium/Long Range Discussion
TheClimateChanger replied to Chicago Storm's topic in Lakes/Ohio Valley
-
Odds on this being the least snowiest calendar year on record at Central Park? Currently tied for least snowfall to date with 2020. The full year record is 3.4 inches, from 1913.
-
-
Pittsburgh, Pa Winter 2023-24 Thread.
TheClimateChanger replied to meatwad's topic in Upstate New York/Pennsylvania
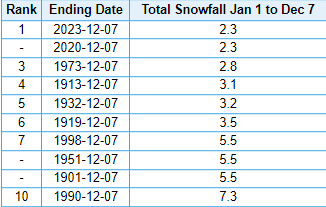
If this is right, we'd be looking at a top ten least snowy start to winter [through the 21st]. While just one run of one model, it's consistent with earlier runs. This particular run actually has substantially more snowfall elsewhere in the region than earlier runs, but still suggests the Pittsburgh region receives little accumulation. -
Pittsburgh, Pa Winter 2023-24 Thread.
TheClimateChanger replied to meatwad's topic in Upstate New York/Pennsylvania
17.6" was the final tally last winter, which was the least since 1990-91. Simple probability would suggest that we probably won't see so little this winter. But it certainly is off to another slow start. I am not even seeing any 384-hour model fantasy snowfalls yet. -
Pittsburgh, Pa Winter 2023-24 Thread.
TheClimateChanger replied to meatwad's topic in Upstate New York/Pennsylvania
When I look at years with ONIs equal to or higher than this, I see a lot of disasters in Pittsburgh. Do you guys think this winter will be the second straight disaster? Here are all cases of a wintertime ONI greater than or equal to 1.8: 1957-58: 37.0" 1965-66: 48.0" 1972-73: 26.3" 1982-83: 30.1" 1997-98: 24.2" 2015-16: 29.6" Mean: 32.5" Five of six cases were below the normal seasonal snowfall. The most recent 4 of which were around 30" or less for the season.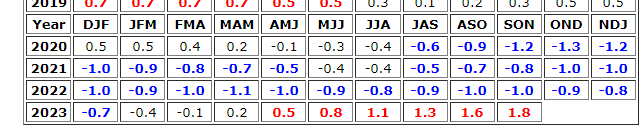
-
El Nino 2023-2024
TheClimateChanger replied to George001's topic in Weather Forecasting and Discussion
Looks like we are way out of 2009-2010 territory, at least by ONI. Already higher than the peak from that event. Below the mega events of 1997-1998 & 2015-2016, but only a touch below the SON ONI from 1982 (2.0) and on par with 1972 (1.8) and those were two of the strongest events until the 1997-1998 El Nino.
-
December 2023 General Discussion
TheClimateChanger replied to michsnowfreak's topic in Lakes/Ohio Valley
What are you seeing for the low temperature that day? Here are the record warmest minima: Currently, the NWS point-click forecast centered on MKE Airport has 54F/42F for the high and low, which would be the 4th warmest high and 2nd warmest low. Overall, the mean looks like it would be 2nd highest on record behind only 1946.

-
December 2023 General Discussion
TheClimateChanger replied to michsnowfreak's topic in Lakes/Ohio Valley
That would be pretty incredible, as its only happened one time on record dating back to the early 1870s in the Milwaukee area record. In fact, after December 8, there are only 12 days later in the month where it has reached 60 or better [many of them right at the 60F mark]. Current numbers to beat for Friday, December 8th:
-
Great post, Don. I wouldn't necessarily discount the possibility of a 2015-esque month, however. Obviously, we are only 3 days into the month, but 2023 is running 0.8F warmer than 2015 in those 3 days. So, we are certainly off to a running start.
-
Pittsburgh, Pa Winter 2023-24 Thread.
TheClimateChanger replied to meatwad's topic in Upstate New York/Pennsylvania
Very short period (just three days), but this is not the warmest first three days of December on record. In fact, it's not particularly close. 1982 averaged an incredible 59.2F over that stretch. Still, good for fourth place in the threaded record. In more recent decades, 2012 & 1998 saw similar temperatures to this year.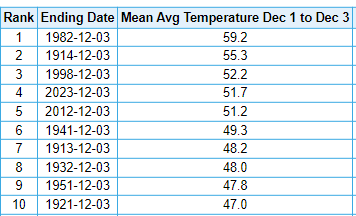
-
Sorry, I didn't see you had already shared this. I have to admit when I first saw the number I had to do a doubletake. Wasn't sure if Spencer gave the anomalies in degrees C or F. The 0.91 value was so high compared to the 1991-2020 mean - which is, by far, the warmest possible base period one could select - that I was thinking at first it must have been Fahrenheit!
-
Pittsburgh, Pa Winter 2023-24 Thread.
TheClimateChanger replied to meatwad's topic in Upstate New York/Pennsylvania
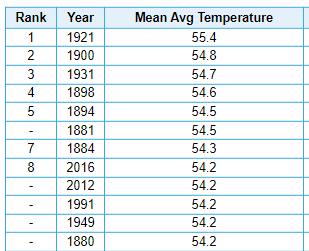
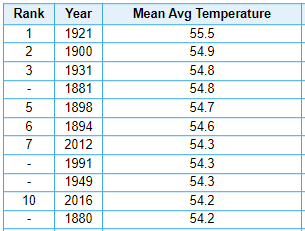
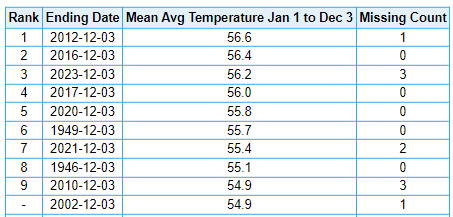
It will be interesting to see where 2023 ends up in the rankings. Currently tied for 19th place. A couple of years have a considerable amount of missing data and could be inflated if those missing days are clustered in the cool season [since the values shown below are calculated by averaging all available days]. Obviously, the majority of the years were from the downtown station which averaged around 2 1/2 degrees warmer than the PIT airport until its termination in 1979. Looking at the airport data, only 2016, 1991, 2017, 2012 and 1949 (at AGC) were warmer to date. Here are the current annual records, shown with two different methods of averaging (by month and by day). Averaging by month is preferable when there is missing data, since it ameliorates the effect of the missing days being clustered in the cold or warm months. But with few missing days, averaging by day is more precise. I think we have a fair shot at climbing into the top 10, despite the 19th rank to date. Averaged by monthly mean Averaged by daily mean For comparison, here is AGC to date. If the official site was still there, several recent years would be quite a bit higher in the threaded record.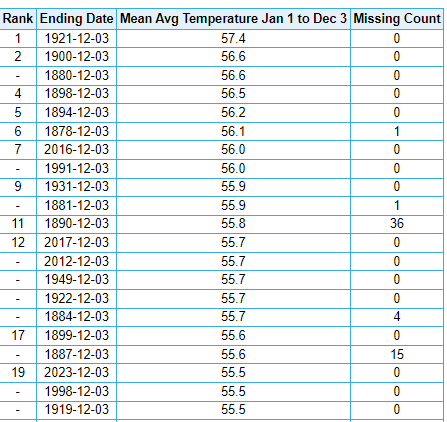
-
November came in at +0.91C on the UAH satellite data set. YEAR MO GLOBE NHEM. SHEM. TROPIC USA48 ARCTIC AUST 2022 Jan +0.03 +0.07 -0.00 -0.23 -0.12 +0.68 +0.10 2022 Feb -0.00 +0.01 -0.01 -0.24 -0.04 -0.30 -0.49 2022 Mar +0.15 +0.28 +0.03 -0.07 +0.23 +0.74 +0.03 2022 Apr +0.27 +0.35 +0.18 -0.04 -0.25 +0.45 +0.61 2022 May +0.18 +0.25 +0.10 +0.01 +0.60 +0.23 +0.20 2022 Jun +0.06 +0.08 +0.05 -0.36 +0.47 +0.33 +0.11 2022 Jul +0.36 +0.37 +0.35 +0.13 +0.84 +0.56 +0.65 2022 Aug +0.28 +0.32 +0.24 -0.03 +0.60 +0.51 -0.00 2022 Sep +0.25 +0.43 +0.06 +0.03 +0.88 +0.69 -0.28 2022 Oct +0.32 +0.43 +0.21 +0.05 +0.16 +0.94 +0.04 2022 Nov +0.17 +0.21 +0.13 -0.16 -0.51 +0.51 -0.56 2022 Dec +0.05 +0.13 -0.03 -0.35 -0.21 +0.80 -0.38 2023 Jan -0.04 +0.05 -0.14 -0.38 +0.12 -0.12 -0.50 2023 Feb +0.09 +0.17 0.00 -0.11 +0.68 -0.24 -0.11 2023 Mar +0.20 +0.24 +0.16 -0.13 -1.44 +0.17 +0.40 2023 Apr +0.18 +0.11 +0.25 -0.03 -0.38 +0.53 +0.21 2023 May +0.37 +0.30 +0.44 +0.39 +0.57 +0.66 -0.09 2023 June +0.38 +0.47 +0.29 +0.55 -0.35 +0.45 +0.06 2023 July +0.64 +0.73 +0.56 +0.87 +0.53 +0.91 +1.44 2023 Aug +0.70 +0.88 +0.51 +0.86 +0.94 +1.54 +1.25 2023 Sep +0.90 +0.94 +0.86 +0.93 +0.40 +1.13 +1.17 2023 Oct +0.93 +1.02 +0.83 +1.00 +0.99 +0.92 +0.62 2023 Nov +0.91 +1.01 +0.82 +1.03 +0.65 +1.16 +0.42

