

TheClimateChanger
-
Posts
1,912 -
Joined
-
Last visited
Content Type
Profiles
Blogs
Forums
American Weather
Media Demo
Store
Gallery
Posts posted by TheClimateChanger
-
-
I think it's still early, no? They should have just started emerging over the past week. They don't fly until after they've molted. If you aren't seeing any activity by next week at this time, then I'm going to think something is wrong.
-
8 minutes ago, NEOH said:
That seems very late for Southern Ohio (even in 1904). We are about 2 weeks ahead of schedule here in Northeast Ohio. The Black Locust are the latest to leaf out this year. There are very few, if any, Ash trees remaining. Total devastation from the ash borer.
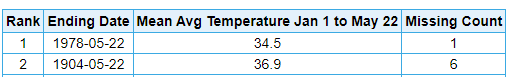
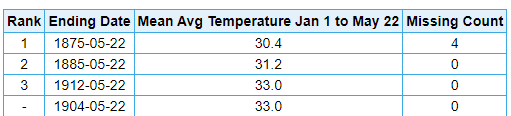
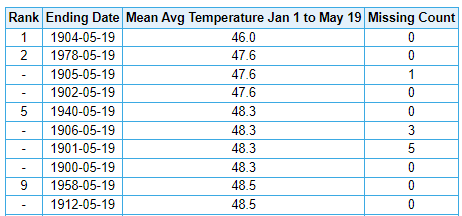
The late leaf out reported that year is consistent with the temperature data, though. 1904 was one of the coldest years to date on record.
Dayton - only 1978 cooler
Cleveland - only 1875 & 1885 cooler, tied with 1912
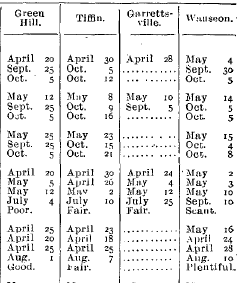
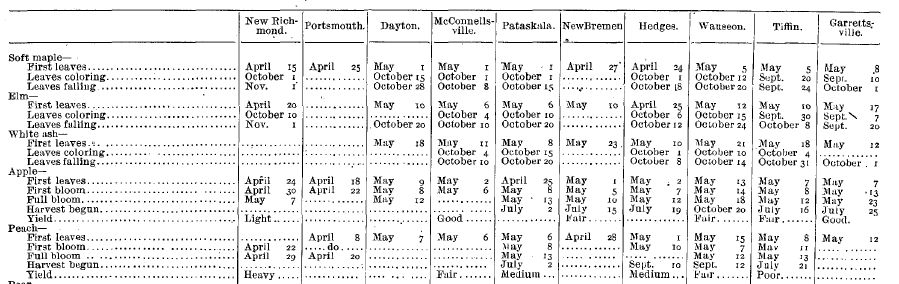
1907 is an interesting case (shown above for a few northern locations). Some tree species leafed out early, especially in the south. But the late blooming ash did not leaf out until mid to late May in most places. I looked at the temperature data, and there was a significant warm spell in late March (not as intense as 2012, but still quite warm), but then April and May were way below modern averages.
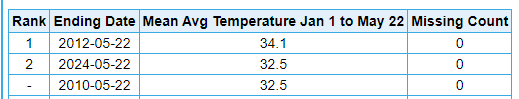
Marquette in @weatherbo's territory has been nearly as warm in 2024, as Cleveland in 1904.
-
2 hours ago, weatherbo said:
These are maple but there's plenty of ash and they're leafing out as well but well behind, maybe 20% leaf out.
9 minutes ago, TheClimateChanger said:Wow, I'm pretty shocked. I would have never thought your location in the Huron Mountains of the Upper Peninsula would have that many leaves already.
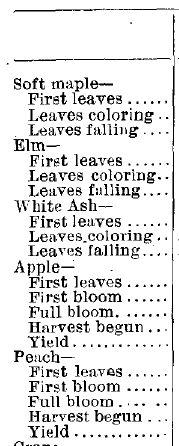
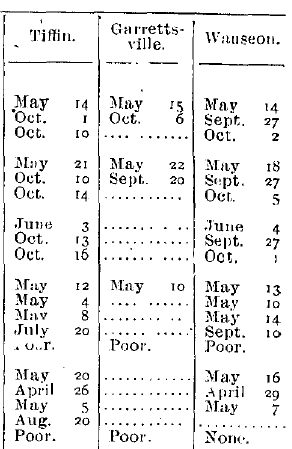
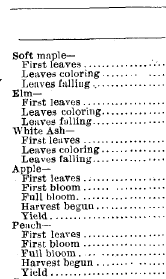
When I look at the phenological reports from the Weather Bureau's Monthly Weather Review, you seem further along than northern Ohio used to be in the early 20th century, with the first White Ash leaves not being noted until the last week or so of May into early June. Even elm were just coming into leaf. Crazy how much that's changed in the past 100 years.
1907
1908
I mean 1904, even far southern Ohio didn't have ash leaves until the second to third week of May. Blows my mind.
-
1 hour ago, weatherbo said:
These are maple but there's plenty of ash and they're leafing out as well but well behind, maybe 20% leaf out.
Wow, I'm pretty shocked. I would have never thought your location in the Huron Mountains of the Upper Peninsula would have that many leaves already.
When I look at the phenological reports from the Weather Bureau's Monthly Weather Review, you seem further along than northern Ohio used to be in the early 20th century, with the first White Ash leaves not being noted until the last week or so of May into early June. Even elm were just coming into leaf. Crazy how much that's changed in the past 100 years.
1907
1908
-
 1
1
-
-
1 hour ago, weatherbo said:
1.2" of much needed rain, everything is lush and green. Looks like some snow could skirt the northern portion of L Superior tonight.
Looking off my backyard deck, 17 days ago vs today. 60 to 75% leaf out.
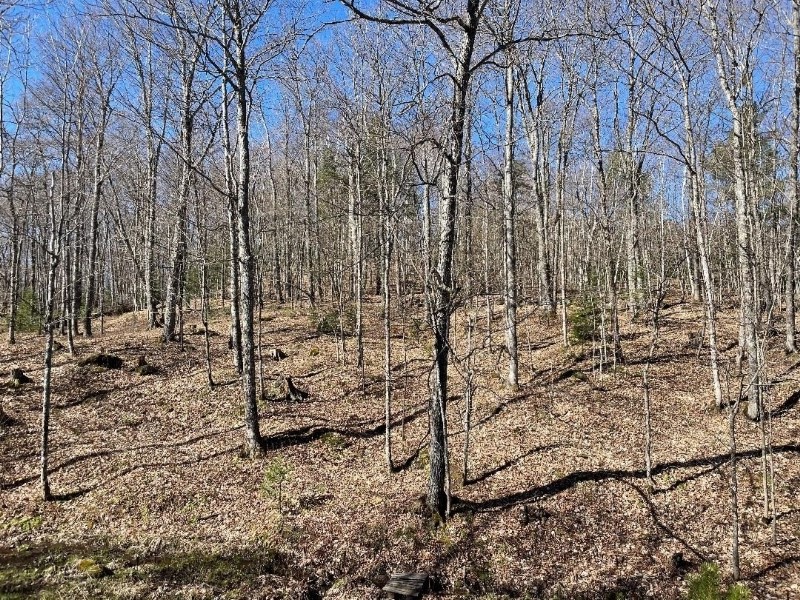
.jpg.45b0b95d846f959c0bd90156d686f790.jpg)
What tree species are we looking at here? Are these oaks? Are there any white ash? And if so, any leaves?
-
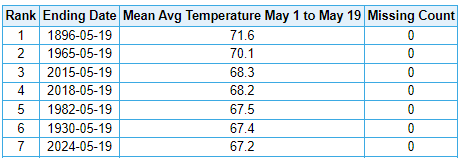
Pretty much bonus summer this month. At many of these locations, the coldest Julys are only about 1.5-2F warmer than this month, and all of them have seen numerous cooler Junes.
-
 2
2
-
-
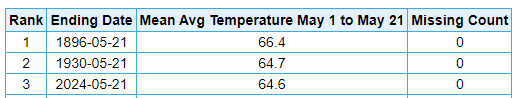
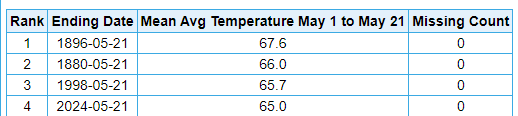
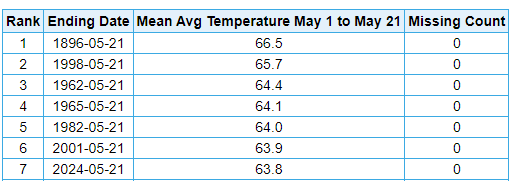
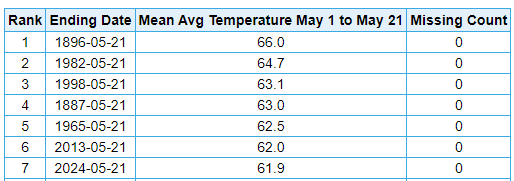
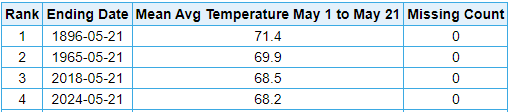
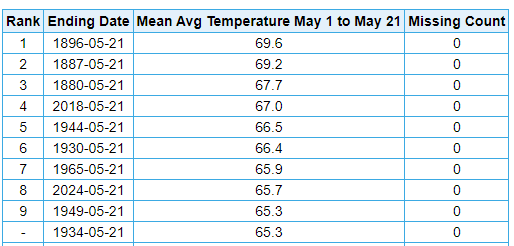
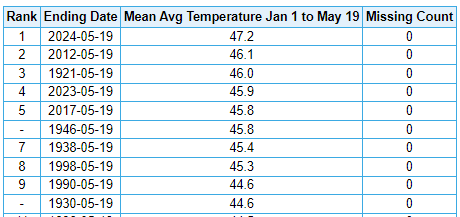
Looking like another scorching month... starting to feel like Groundhog Day at this point to be honest. Some areas could see their warmest May on record. At Mansfield, Ohio, the first three weeks of May have been the warmest on record (dating to 1916).
Cleveland
Toledo
Mansfield, Ohio

Detroit
Lansing
Dayton
-
On 5/20/2024 at 8:17 AM, TimB said:
Currently the 17th warmest May on record with a very warm stretch coming up the next 3 days. Could reach top 10 by the end of the month (3rd or 4th at PIT) the way it’s looking now. It’s starting to feel like this stretch of obscene warmth that’s been pretty much continuous since winter 2022-23 with a small break last May/June is never going to end.
Jumped up to 8th place already on the month to date, with another ridiculously warm (relative to average) day coming in today. Low was just 67F this morning.
-
A rare dust storm warning for parts of Illinois.
-
1
-
-
Wow! Not the earliest 90F+ reading on record, but only 4 years (since 1871) have seen an earlier 90F+ reading at Cleveland.
1953: May 10, 90F;
1959: May 6, 92F, May 20, 91F
1962: May 14, 91F; May 18, 91F; and May 20, 91F
2017: May 17, 90F
-
The mean temperature at Philadelphia would have to be like 60F already if there was a 12F UHI. That's a bunch of nonsense.
-
2
-
-
5 minutes ago, FPizz said:
One search that took 2 seconds. Tons of results. This is just one. Maybe you don't know how to Google correctly?
https://whyy.org/articles/philadelphia-built-environment-temperature-increase-12-degrees/
Lol. 12 degrees of urban heat island effect in Philly. Yet it's only 7 degrees warmer than the coldest spot in the entire state, at over 2,000 feet elevation near the New York border. Maybe if you are measuring the temperature of asphalt and rooftop, but I'm still having trouble verifying this from actual data. I can believe your article or I can look at actual data that shows it is BS.
Bradford

Philadelphia

-
1
-
-
19 minutes ago, TheClimateChanger said:
Can somebody help me find the 3-12C urban heat island effect? I'm having a lot of trouble finding it in the actual data.
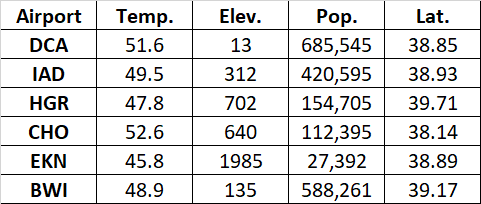
I'm just not seeing it. Here is some data for the year to date from the Mid Atlantic. It's almost like temperatures vary pretty consistently with latitude and elevation, and any impact from population is pretty small (maybe a degree or so). Population figures given are for the county or district in which the airport is located [I used Loudon County for IAD, which spans two counties]. Where is this 3 to 12C figure coming from?
-
Can somebody help me find the 3-12C urban heat island effect? I'm having a lot of trouble finding it in the actual data.
-
 1
1
-
-
On 5/18/2024 at 5:12 AM, chubbs said:
You are giving us the Tony Heller denial explanation: Urban Heat Island, bias adjustment, blah, blah, blah.
Why would the heat island effects at Philadelphia, Atlantic City, Wilmington and Allentown all be the same? Seems very unlikely. The airports are all different, with different levels of urbanization and airport growth. And you have zero evidence to support your UHI assertion. Even more unlikely the bias adjustments for Chester County are the same as the UHI impacts at the regional airports. But wait there is more. The raw temperature measured at Coatesville and East Nantmeal (Chescowx) agree with the airports and NOAA. Whats the problem in your own data? Urban heat Island or is it bias adjustment?
No there's a much simpler explanation. Chesco is warming and your latest data concoction is way off. The reason is in your comment Regarding the sites in more detail yes there was as a % more lower elevation sites in the past....which likely skewed those results too warm Finally there is something we can agree on. But its more than elevation. As outlined above multiple factors have skewed your station mix.

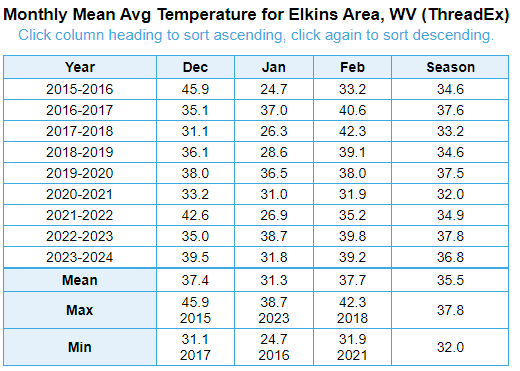
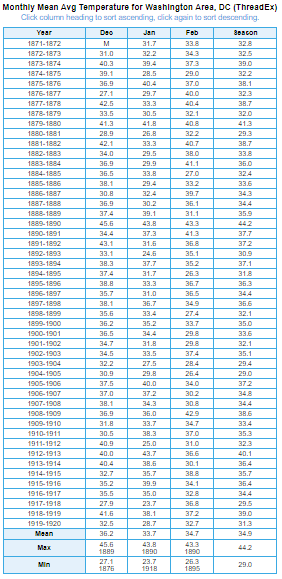
We really need to cut all the urban heat island nonsense out. When Elkins, West Virginia, a remote, very rural town at 2,000 feet elevation and a location that historically averages 80" of snow each year, has average winter temperatures that easily exceed those of 19th Century and early 20th century Washington, D.C. [basically sea level], urban heat island effect is not a significant factor.
-
1
-
1
-
-
6 minutes ago, TheClimateChanger said:
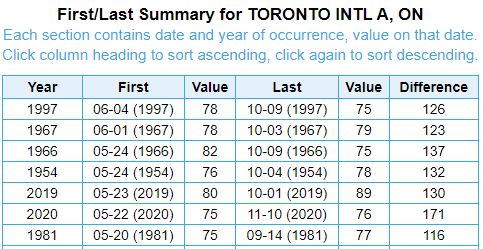
Interestingly, there were 5 years in the first 48 years of record in which the first 80F did not occur until July. This implies a historical odds of such an event being a bit more common than 1 in every 10 years. The latest first 80F reading at Toronto is July 16, 1851, when the mercury climbed to 82F.
At Pearson International Airport in more recent years. The first 75F in 2019 occurred on May 23, and in 2020 on May 22. Latest is June 4, 1997.
-
6 minutes ago, TheClimateChanger said:
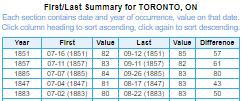
Not too uncommon. These are all the years at downtown Toronto in which the first reading of 75F occurred on or after today's date (May 20). The temperature shown is the temperature on the date of the first 75F+ reading. Particularly in the 19th century, it was fairly common for the first 75F reading to hold off until June.
The latest first 75F+ reading occurred on June 26, 1851, when the mercury climbed to 78F.
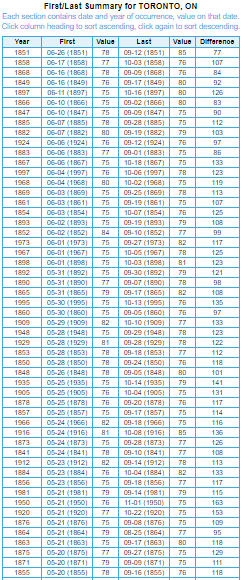
Interestingly, there were 5 years in the first 48 years of record in which the first 80F did not occur until July. This implies a historical odds of such an event being a bit more common than 1 in every 10 years. The latest first 80F reading at Toronto is July 16, 1851, when the mercury climbed to 82F.
-
1
-
-
On 5/12/2024 at 10:51 AM, mississaugasnow said:
Toronto has yet to hit 75F this year. Hottest its been is 71F
@Snowstorms @michsnowfreak what would be the best site to see the latest Toronto has gone without seeing 75F? April was also the 2nd rainiest month since 1840 haha. Just stuck in neutral in winter and now spring.
Not too uncommon. These are all the years at downtown Toronto in which the first reading of 75F occurred on or after today's date (May 20). The temperature shown is the temperature on the date of the first 75F+ reading. Particularly in the 19th century, it was fairly common for the first 75F reading to hold off until June.
The latest first 75F+ reading occurred on June 26, 1851, when the mercury climbed to 78F.
-
1
-
-
If you look at a place like Oklahoma City, the comparison is even starker.
Fully 32 years, almost all from prior to the 21st century, were as cool or cooler than Morgantown in 2024 for the period from January 1 through May 19.
And 45 years, no more than 0.5F warmer.

So at those levels, 2024 in Morgantown has seen temperatures that would have been expected about once every three years historically in OKC, and nearly every other year if you include years within 1/2 degree Fahrenheit.
-
4 hours ago, TimB said:
Currently the 17th warmest May on record with a very warm stretch coming up the next 3 days. Could reach top 10 by the end of the month (3rd or 4th at PIT) the way it’s looking now. It’s starting to feel like this stretch of obscene warmth that’s been pretty much continuous since winter 2022-23 with a small break last May/June is never going to end.
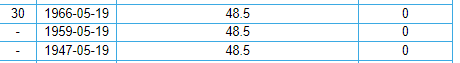
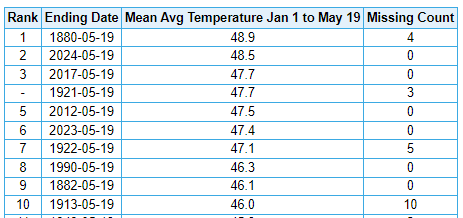
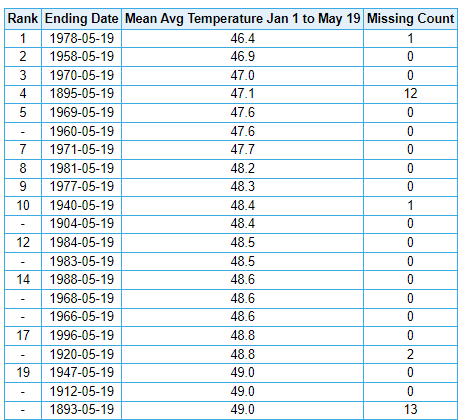
It will be interesting to see if we can sustain this. At Morgantown, the mean temperature so far this year has been 48.5F.
If you look at a place like Raleigh-Durham, NC, you can see 13 years were as cool or cooler, and 21 years within 0.5F of that figure, clustered generally within a 100-year period. Temperatures that low no longer occur in Raleigh-Durham, so including the full nearly 140 years of data would produce a incidence far below what the historical incidence. You can see that when the airport opened in that time frame from the late 1950s through 1980s, temperatures as low or lower than 2024 in Morgantown would have occurred about 1 in 4 years.
Even Greenville-Spartanburg, South Carolina has had 10 years as cool or cooler. While there's nearly 130 years of record, they were all clustered in the first 80 or so years of the POR, implying a historical incidence of about 1 in 8 years.
While still below the median, you can see temperatures like those at Morgantown so far this year were still fairly common in the 20th century in the Carolinas. Definitely within the envelope of a normal 20th century climate of the Carolinas, and about normal for 20th century Oklahoma City [albeit with cooler highs & warmer lows - less continentality].
-
2 hours ago, TimB said:
Currently the 17th warmest May on record with a very warm stretch coming up the next 3 days. Could reach top 10 by the end of the month (3rd or 4th at PIT) the way it’s looking now. It’s starting to feel like this stretch of obscene warmth that’s been pretty much continuous since winter 2022-23 with a small break last May/June is never going to end.
I think all the Canadian wildfire smoke screwed us in May and June last year. Even when it wasn't noticeable on the surface, there was almost always some concentration in the atmosphere. The next strong El Nino should be interesting.
-
1 hour ago, IWXwx said:
Temperature Forecast Fail
7th warmest May on record to date at Dayton, with very warm weather forecast over the next week or so. Plenty of room to climb on this list.
Still solidly in first place on the year to date, more than a degree warmer than 2012.
-
1
-
-
12 minutes ago, Bubbler86 said:
Your taxes are more than 7K a year? That is exorbitant for PA. I do know of some schools districts near Reading they were that high, Mine are close to 2500 and my home is in the 300-400K range. Florida is very unaffordable on almost all aspects right now. An 1800 sq foot house in the middle of the state, surrounded by old trailers, is 350K. Just 10 years ago that same home was hovering around 150K. The salaries here are not able to match the cost of real estate or rent so lots and lots and lots of unsold homes.
Weird. We paid just under 400k in 2018, and ours is $10k a year between city, county and school.
-
24 minutes ago, Bubbler86 said:
We are having to stay inside most of the day so do not feel too jealous...unless you have 1-5 Mill to get a place right on the coast (in a desired area) living here is like living in a frying pan. Also, the house insurance and taxes on my old place near Ocala, a simple 1800 ft home, is 7K a year now. That least piece is ironic because anyone that comes here to retire is taking on what is almost a mortgage to pay those two items yearly. I enjoy my less than half that totals in PA.
Wow, more affordable than I would have thought. Our property taxes alone dwarf that.
Report: Another Year of Record Heat for the Oceans
in Climate Change
Posted
Lots of talk about the oceanic heat wave, but not much mention of the incredible marine heat wave in the Great Lakes.
If we look at the water temperatures at the Buffalo crib, where water temperatures have been recorded continuously since 1927, we can see a new daily record was set by an astounding 4F. Also, a whopping 11F above the average reading for May 23rd.
By contrast, the record low for today's date is 32F from 1971 - yes, it was still frozen. On this date in 1936, during the so-called hottest summer on record, the water temperature was a frigid 37F - the ice having broken up just about a week prior.
Even Lake Ontario off Rochester is up to 58F today, as shown above.