ORH_wxman
-
Posts
93,092 -
Joined
-
Last visited
Content Type
Profiles
Blogs
Forums
American Weather
Media Demo
Store
Gallery
Everything posted by ORH_wxman
-
Hingham technically snuck in with 1" at obs time. But maybe they had 8am obs time...id have to look up their specs.
-
I may have officially still had an inch or two of slush at 7am last year....but it was so disgusting I'm not even counting that as a white Xmas. It was funny because Xmas eve was amazing....like 50-55 but still a foot of snow OTG and filtered sun. My boys were outside most of the day playing in it and we had a fire going in the fire pit outside. It was quite festive....almost a Reggae-fest atmosphere you see at ski areas in late March on those warmish days. If it weren't for the horrific rainstorm that started later that night, it probably would have just been a typical warm day that melts 3 inches of pack but not much else.
-
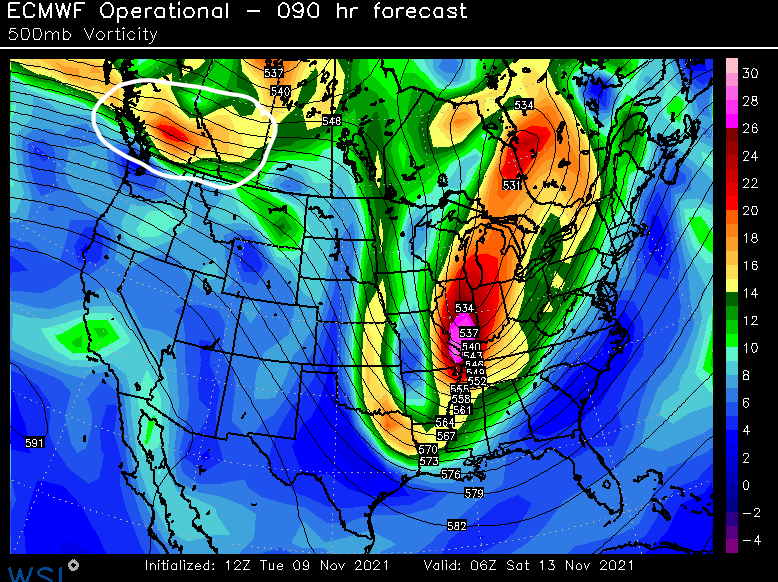
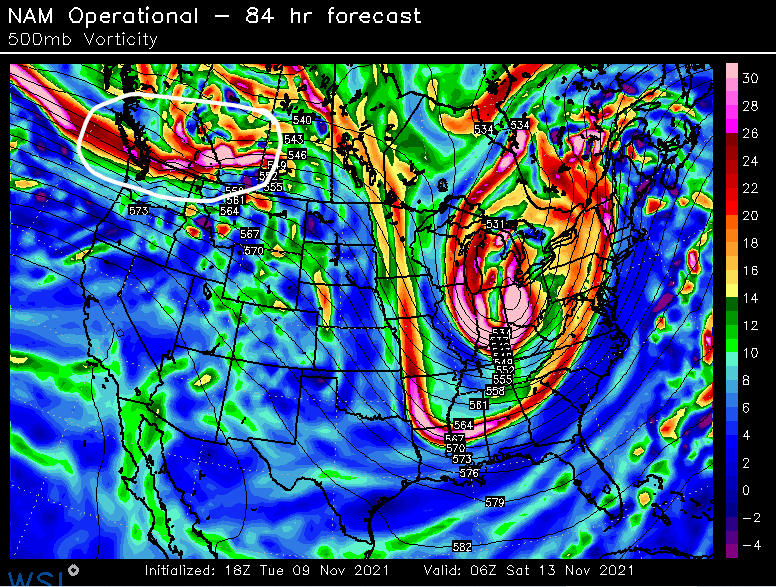
Getting back to the "threat" next week....as Tip said, this wave is probably going to cause some model waffling. It comes in screaming on kind of a "flat" flow. You can see it here at 90 hours on the Euro And even now the 84 hour NAM at 18z "sees" the wave as well. This is the one to watch....you have the lead deep trough out ahead of it and that wave will try to amplify into the back side of that large trough. That's kind of what you are looking for this early in the season because you typically want some fresh CAA to put a decent antecedent airmas in place. It's not the greatest airmass, but might be enough for interior and esp elevations. Something to watch at least....we'll see if it is still there in another 48 hours.
-
On the flip side, there were some places (mostly S of pike) that did not get a white Xmas in 2002 because they had bare ground and the snow didn't start accumulating until about 8-9am in spots. So that was deceptive too. I think some spots in far SE MA had this happen in 2017 too...the rain flipped to snow there around 7am but they didn't have an inch yet...so it officially goes down as a brown Xmas even though they prob were snowing 2" per hour between 7-9am.
-
For ORH, White Xmas happened in 2000, 2002, 2005, 2007, 2008, 2009, 2010, 2012, 2013, 2017, 2019. That's 11 out of 21...so a little over 50%. if we use the Hingham coop in place of BOS since BOS doesn't keep snow depth data any longer, then we have white Xmas in 2000, 2002, 2007, 2008, 2009, 2010, 2012, and 2017. That's 8 out of 21 or just under 40%.
-
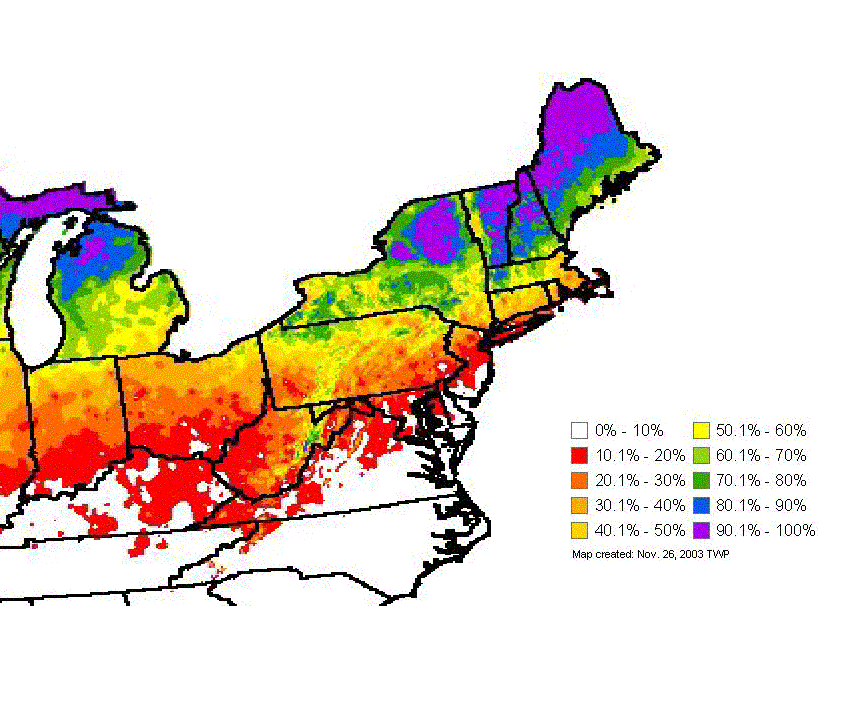
Old climo map I had on my files:
-
ORH is about 60-65%....BOS (keep in mind that is logan in the harbor) is about 20-25%. Most of metro-west like 128 to 495 is prob closer to the 40-50% range.
-
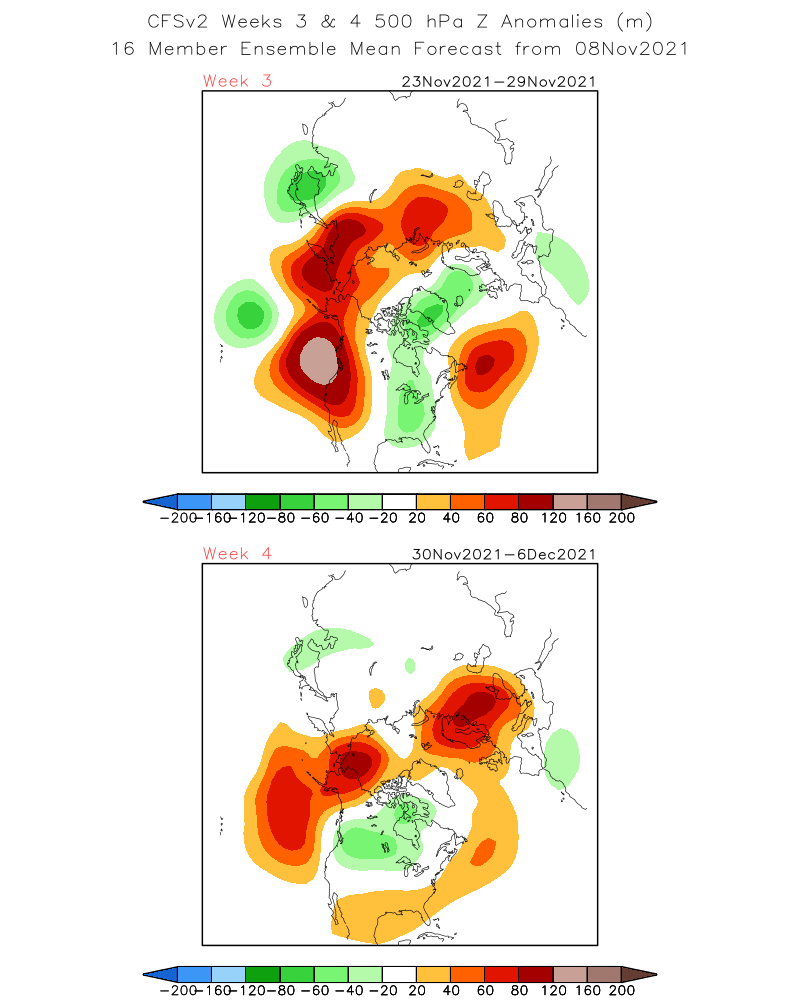
Something cooking on the Euro at D6....GGEM showed this too but the GGEM was more for NNE elevations. Euro might be for SNE too.
-
The week 4 map has the WPO block little bit west of ideal, but given the time frame, it’s prob fine for now. You shift that a touch East and we’re in business for December. Also, Atlantic doesn’t look terrible...get that a little more blocky and we’d have more wiggle room. And goes without saying...things could shift in a less favorable direction too. But most of the guidance is definitely going with the theme of dumping some frigid air into Canada...CFSv2 likes it too...has the higher heights up north further east which is what we’d want.

-
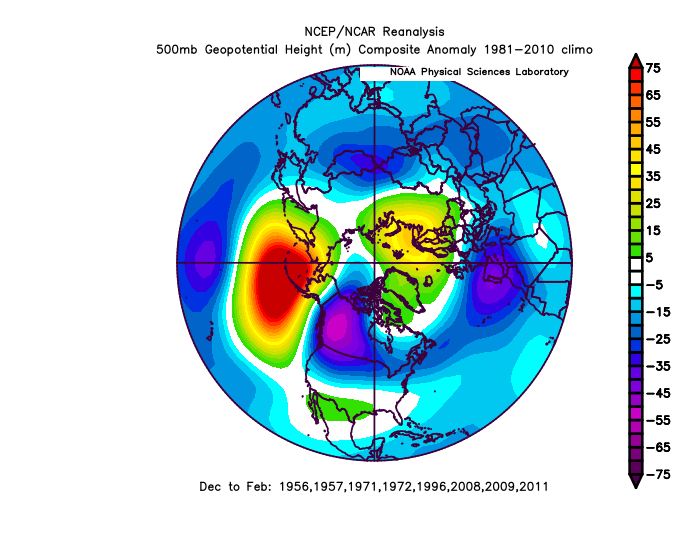
If you have a La Nina winter with a severe -PNA where the core of the low height anomalies is over the PNA region in western Canada, the key to having it still be a very good winter is the WPO region to the west and also not having a hostile Atlantic. I made a composite below of the "good" La Ninas that had this general PNA pattern:
-
Gonna freeze there again. Amazing.
-
It would be worth it if you were preserving a snow pack. But it’s the worst when there’s no tangible benefit to the cold.
-
Those temp anomaly maps look like a crappy El Niño. Lol.
-
Yeah this is the definition of “fake cold”. Super inverted radiational cooling nights...but if it started precipitating, the temps would be like 44F...lol. Fake warmth usually happens in spring when the sun angle produces an extreme low level lapse rate. Like those days where it’s a high of 61F but 850 temps are -2C so a bowling ball snowstorm could happen the next day.
-
That system next week is def watchable for NNE...even if synoptically it ends up as a snoozer, it would likely give some decent upslope behind it. Just another step down.
-
That was an all-timer. Really the only other comparable one in the past 30 years was Jan 1996...you might be able to throw December 17, 2000 in there too. You'll have a White Xmas up there this year.
-
Ironically, NYC went their 2nd longest white christmas drought on record between 1931-1944....14 consecutive years without a white Xmas. Only the 16 consecutive years between 1967-1982 was longer. Their current drought is 11 years (2010-2020).
-
Ensembles have been pretty consistent in the pattern shift in the PAC. There will likely be some winter threats in the final 10 days of the month for some on this forum assuming no major changes....obviously in November that favors NNE elevations, but can't rule out further south or lower down either.
-
I don’t think NYC ever averaged that much. Maybe the late 1800s?
-
Kevin your low is 32F so far? ORH hit 30F yesterday.
-
The xmacis site has more options/parameters I think and for the first order sites they are threaded (I.E they will combine the old site with the new site). The climod site though will have all old defunct coops though and I’m not sure if the xmacis site has those. It might only be active sites. On climod2 I can look up some random coop that was only active from 1890 to 1920 or something and I’m not sure if I can do it on xmacis...at least I haven’t figured out to yet.
-
I’ve actually already done this for larger storms for every season going back to 1950 iirc. It’s on my PC but it prob hasn’t been updated for the last couple seasons. I’ll have to post it when I’m back on my PC. I remember running frequencies of 6+ and 12+ storms at the major climo sites.
-
You can do this just by doing an Oct-Apr daily data lookup on climod2 or the https://xmacis.rcc-acis.org site and looking at the snowfall column. It’s not super fast since you have to keep changing the year to look at other winters but it’s pretty easy.
-
Ha I thought about going up to 40” on that Feb 1969 estimate for Farmington but I would’ve lowballed it anyway. That was a historic storm for much of NNE into E MA.
-
Haha, well I don’t “remember” them per day since I wasn’t alive, but I do remember most snowfall data from back then. Maybe Feb 1969? The Lindsay storm was Feb 9-10, 1969....only problem is that it prob wasn’t vacation yet? Unless it was early that year. Feb 10, 1969 was a Monday but usually vacation is presidents day and that wasn’t until a week later. The 2nd huge storm that month didn’t hit until 2/22-23 and it lasted like 5 days. (It missed NJ which is why tamarack doesn’t remember it but it gave his current stomping grounds somewhere between 28-36” I’m guessing. I don’t think it was 1967 either because after the monster on Feb 6-7 there wasn’t another warning event until late month. 1972 could have fit the bill...though that is 5 years later. Do you remember how old you were roughly? 1972 had a huge storm on 2/19 which would have been the Saturday before Presidents’ Day. Then there was another storm the next Saturday on 2/26 but it was a marginal warning event (like 7 inches or so). The sequence of events matches your description at least.