

ORH_wxman
-
Posts
93,092 -
Joined
-
Last visited
Content Type
Profiles
Blogs
Forums
American Weather
Media Demo
Store
Gallery
Everything posted by ORH_wxman
-
That’s not gonna get it done. Prob 1-2” of paste if that verifies.
-
December 2024 - Best look to an early December pattern in many a year!
ORH_wxman replied to FXWX's topic in New England
I’m hoping we can catch a break since we have a lot of cold-loading up north. One of these can produce those sneaky highs that helps us out. That’s been the hardest part recently…actually getting a high to hold for a bit. Even if it retreats eventually, you can get good events if it fights for a while ala 12/16/07 or something like that. We haven’t been able to time any confluence up there in our favor. -
3k actually has a pretty nice 2-3 hour burst of mod (perhaps briefly heavy) snow in eastern MA early Thursday. Metrowest could perhaps grab an inch or so during that if it verifies.
-
You may have some rain early in but I’d expect you to flip to snow pretty quick if you do. If you avoid rain in the first 2-3 hours of the steady stuff, you’re good. The profile cools after about midnight or 06z.
-
Yeah sharper trough it seems so it’s really developing that brief anafront look. So you get milder on the front end out east but there’s better QPF in the cold sector which does eventually push east. It helps out southwest CT a lot actually.
-
18z euro was a bit warmer than 12z. No major changes but for those on the line it would make a difference.
-
Gonna be on the line here right near 495. Hopefully having several hundred feet of elevation will help a bit too. I think for folks further east you want to root for a sharper trough which will help redevelop precip on the cold side of the boundary like I was mentioning to Scott earlier. Almost an anafront look early Thursday morning.
-
Scooter throwing furniture in the basement on that map.
-
Yeah your area up through N ORH County on the west side of the spine is where I'd favor right now for best accumulations....assuming you don't have any issues with 925-950mb temps but I think you're far enough NW to avoid any significant problems.
-
Your area and other higher terrain in the deep interior could get decent ratios....some of the guidance has good snow growth and if you're pulling a 31F sfc temp, then you'll get 10 to 1 or better. I think the skeptical part of me is more questioning whether a half inch of liquid actually falls versus something like a quarter inch or 3 tenths.
-
18z GFS still really croaking Kevin up through ORH county. Even central CT would do pretty well.
-
Yeah its almost an anafront type setup if you sharpen the shortwave....you get developing precip parallel to the flow on the cold side of the boundary. Hopefully that's a trend that increases as we get closer.
-
December 2024 - Best look to an early December pattern in many a year!
ORH_wxman replied to FXWX's topic in New England
Weeklies try to reload the Aleutian low and rebuild a PNA ridge leading into the week of Xmas and keeps it around to some extent through New Years....we'll see how that actually plays out, but that could offer another window at something. There will be a lot of cold to tap into if we spike a ridge since the EPO/WPO cross polar setup stays constant over the top.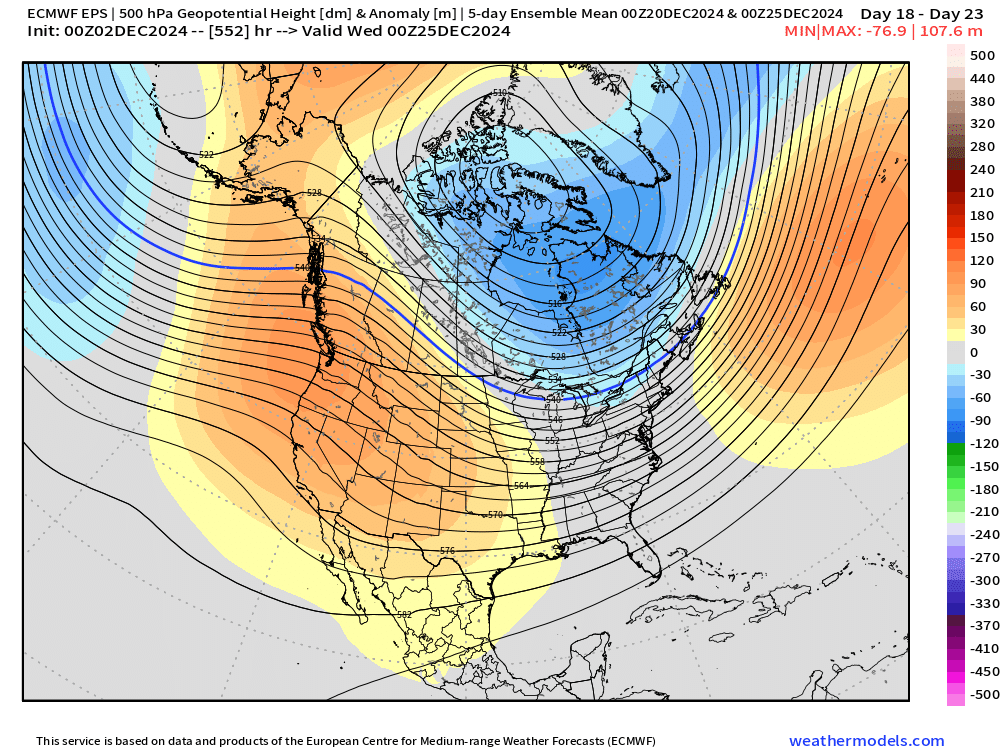
-
18z NAM juiced up quite a bit. Esp CT into central MA.
-
This event has fairly steep low level lapse rates so the source of warmth will be from ground-upward. Not a situation where we have elevated warm layers.
-
It is def warmer than GFS...but still likely cold enough for the areas we were already talking about in the interior from near Kevin up through ORH hills.
-
There's still something unsettling about the Canadian suite giving almost zero precip while the GFS is trying to spit out low-end warning level snows in some spots. I'm guessing the canadian suite is mostly out to lunch, but the GFS is likely too juiced. Euro/NAM seem like a decent compromise right now hedging more toward GFS.
-
Kevin does well on SW flow in the BL. His terrain actually causes noticeable upslope in that direction unlike a NE wind. His area to W ORH hills will prob do the best in SNE.
-
December 2024 - Best look to an early December pattern in many a year!
ORH_wxman replied to FXWX's topic in New England
GGEM has an icing threat 12/11-12/12....16 year anniversary, hard to believe. -
Some pretty decent snow growth profiles on the GFS for central CT up through central MA and even getting up into NE MA. GFS BL is decently cold too so I'd expect accumulations easily in the elevations and prob even lower areas too near 495 and down toward N Windham county and NW RI if that verified.
-
Compressed flow seems like it's going to limit this upside to advisory levels outside of northern half of Maine perhaps. But yeah, if it can dig just a bit more, then maybe there would be more widespread 3-5" amounts over interior....but as of now, I'd keep expectations more in the 1-3" range and hope you get a higher lolli. This is kind of trying to pop late which always makes me a little nervous....the radar will look ghastly until the 11th hour and stuff tries to almost redevelop over us early Thursday.
-
NAM has a nice ribbon from near Kevin up through ORH....it even cools further east inside of 495 as we get toward daybreak and they might pick up an inch or two. Might be tough right on the coast, but there's a brief burst of lift when it's cold enough.
-
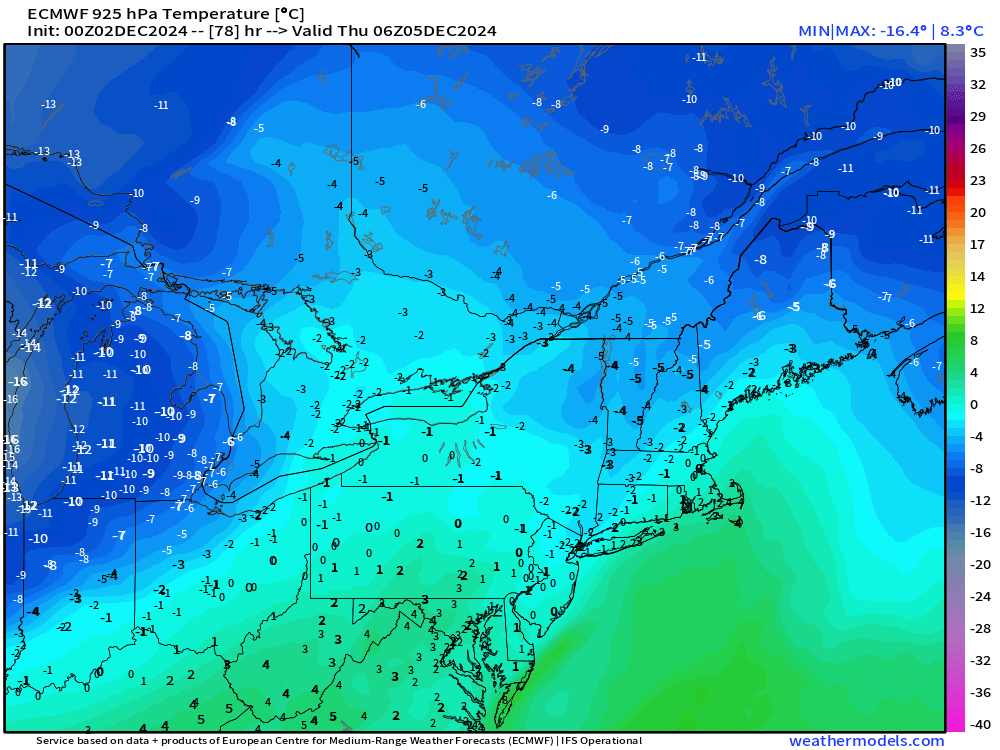
06z euro was def one of the juicier runs. That might get some advisory snows into ORH hills and maybe even near Kevin. I don’t have 06z but on the 00z run you can see how the 925 temps become problematic inside of 495
-
December 2024 - Best look to an early December pattern in many a year!
ORH_wxman replied to FXWX's topic in New England
Last December never looked that good down there. Models did have a big NAO block but marginal cold so it would’ve been a heavy lift south of NE if it did materialize. This is different type pattern with a huge arctic dump into CONUS but in the west…more akin to Xmas week 2022 though still a few differences from that one too. -
Gonna be tough to snow SE of 84 and E of 495 in this one.


