ORH_wxman
-
Posts
93,099 -
Joined
-
Last visited
Content Type
Profiles
Blogs
Forums
American Weather
Media Demo
Store
Gallery
Everything posted by ORH_wxman
-
Blowvember - and not named for wind potential
ORH_wxman replied to Go Kart Mozart's topic in New England
Only issue I'd like to see be avoided (assuming we get a system in the first place) is for the PV lobe to not be stretched or pushed far enough eastward....we've seen a couple different solutions since 00z last night where the true colder airmass didn't quite advect into our area prior to the system, so it ends up more marginal. That cause of it was the TPV hanging back a little bit or being just weaker in general which prevent that stronger push of high pressure. Could still snow in that setup, but it would prob be much wetter and more elevation-dependent for accumulations. -
Blowvember - and not named for wind potential
ORH_wxman replied to Go Kart Mozart's topic in New England
That's the type of profile where latent cooling can help a lot too. Melting all those -3C to -4C aggregates is gonna use up a lot of energy and cool the BL. But obviously you want heavy rates to maximize the cooling. -
Blowvember - and not named for wind potential
ORH_wxman replied to Go Kart Mozart's topic in New England
The EPO/WPO situation is why I have some cautious optimism about December right now. Impressive how it reloads and stays solidly negative on the EPS and GEFS all the way though the first week of December with no signs of breaking down. We’ll still have to worry about the trough diving down a bit too far west at times (this actually happened on the euro last night which turned our snowstorm next weekend into a front ender that changes to rain) but at least when you have the cross polar flow, you have a legit source region. Guidance also tries to start linking it up with western ridging as we go into December so maybe we can get a larger scale system when that happens. -
Blowvember - and not named for wind potential
ORH_wxman replied to Go Kart Mozart's topic in New England
Both were pretty cold right before the event. 2002 had a quick arctic shot a few days after the event where I think temps got near 0. -
Blowvember - and not named for wind potential
ORH_wxman replied to Go Kart Mozart's topic in New England
Yes. 2002 and 2003 both had events on 12/5. -
Blowvember - and not named for wind potential
ORH_wxman replied to Go Kart Mozart's topic in New England
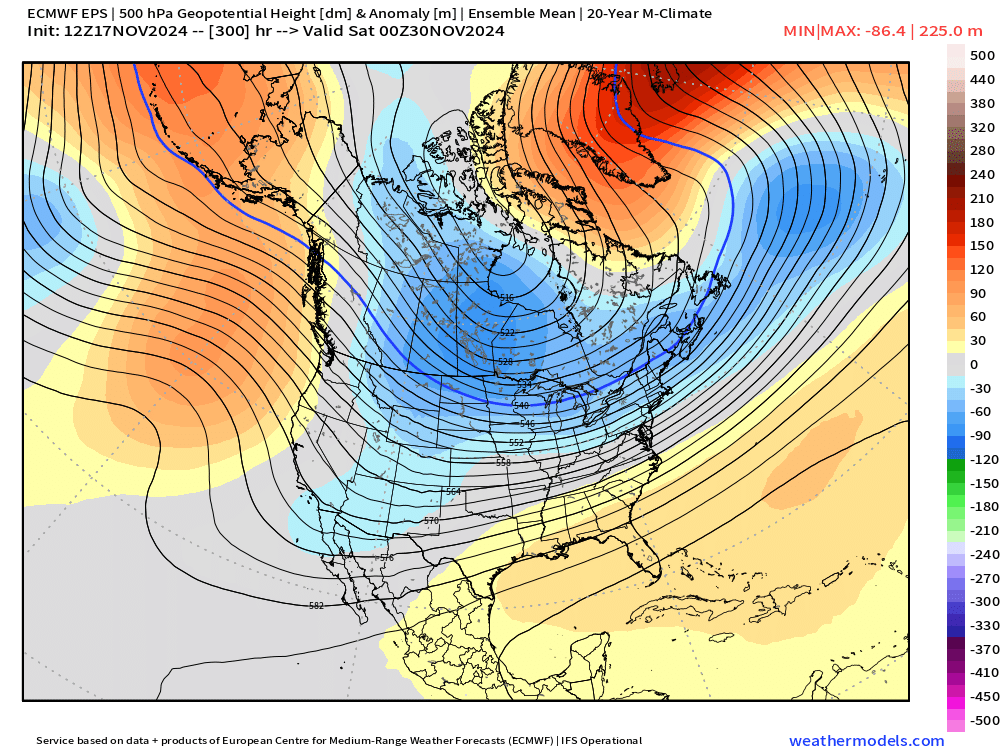
For those who like visuals…you can see what I mean on the H5 plot here. Stretched out TPV lobe to our north and northeast which really holds that high in by acting as a brick wall and forcing the confluence with the trough moving eastward. That look has been largely absent the last couple winters.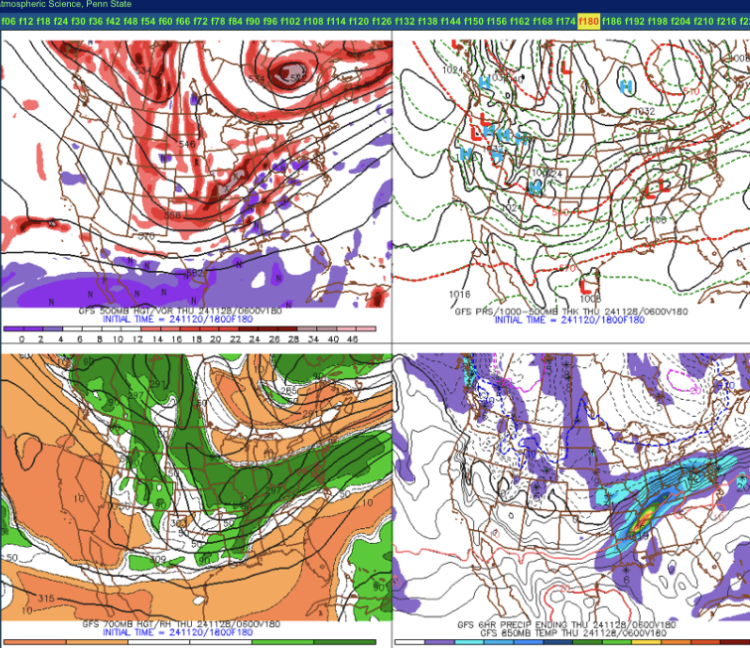
-
Blowvember - and not named for wind potential
ORH_wxman replied to Go Kart Mozart's topic in New England
One thing very nice synoptically about that setup is the TPV stretch lobe to our north and northeast. It really acts as a brick wall holding in a pretty legit airmass. That’s obviously key this early in the season to realizing any significant winter threat. -
Blowvember - and not named for wind potential
ORH_wxman replied to Go Kart Mozart's topic in New England
Thanks man. Being a truth-seeker isn't easy on that topic....my style is def more suited for the weather side. I wouldn't dismiss Friday night so handily....I'm not expecting some huge surprise snowstorm, but there could def be a burst of moderate or even heavy snow over elevated interior with that deep ULL moving just underneath us. I think temps would mostly prohibit any accumulation (except again, higher terrain if we cna get a moderate burst or better)...but first flakes are possible for many. Could even be a nasty cold steady rain on the coastal plain for a few hours friday night. We'll see, but unstable atmosphere with a bit of inflow should always be watched a bit. -
Blowvember - and not named for wind potential
ORH_wxman replied to Go Kart Mozart's topic in New England
Or posting empirical-based election predictions in OT while simultaneously trying to avoid getting dogpiled. At least there’s a pattern worth tracking. More than we can say for 80% of the last two winters. -
Blowvember - and not named for wind potential
ORH_wxman replied to Go Kart Mozart's topic in New England
Yeah this is why I’m questioning whether we revert to a 2-3 week torch after early December. I could def see a relaxation but if that WPO/EPO is going to keep reloading, then it would be difficult to remain AN for long stretches. We’ll see though…we’ve been faked out before on some of this longer range N PAC stuff the last few winters but at least we already have the good WPO/EPO in place this time. -
Blowvember - and not named for wind potential
ORH_wxman replied to Go Kart Mozart's topic in New England
I like that there's no real sign of breaking down the -WPO/EPO in the extended range on ensembles. That's going to be a key on whether December can sustain some good cold and snow chances or if we just get a 7-10 day transient period from near T-day to Dec 5th or so. -
Blowvember - and not named for wind potential
ORH_wxman replied to Go Kart Mozart's topic in New England
Yes. I was just joking to Scott further up in the thread in when the last time we saw a good high in eastern Ontario and western Quebec was? I can’t remember one at all recently. I think maybe the Feb 2023 event but my god, it’s been like pulling teeth to get one. Meanwhile, the weather gods were tossing them out like Halloween candy in the 2000s/2010s. I remember some of those SWFEs when it looked bad a few days out and then all of the sudden inside of 96 hours, “hey that high north of CAR has really trended stronger. We might get a warning front end thump”. Recently, Quebec highs have trended over the Flemish cap. -
Blowvember - and not named for wind potential
ORH_wxman replied to Go Kart Mozart's topic in New England
Yeah I think we'd be happy with anything at this point....nevermind the Euro solution of threatening to break November snowfall records that were set back in the November 26-27, 1898 storm. -
Blowvember - and not named for wind potential
ORH_wxman replied to Go Kart Mozart's topic in New England
D8-9 EPS is definitely favorable on the synoptics....this isn't a deep full-wavelength event, but it's pretty classic for an early season redeveloper....note the relatively shallow shortwave over the center of the country and you have west-based -NAO weakness and a strong 50/50 sig. You'll need all of those this early in the season to hold the high in place otherwise you just won't be able to overcome the antecedent warmth offshore this early. What we don't have a stout western ridge, which is why this probably would come in at a bit of a shallow angle....so you'll need that confluence. But at least the synoptics are there. We'll see if it still holds in another few days.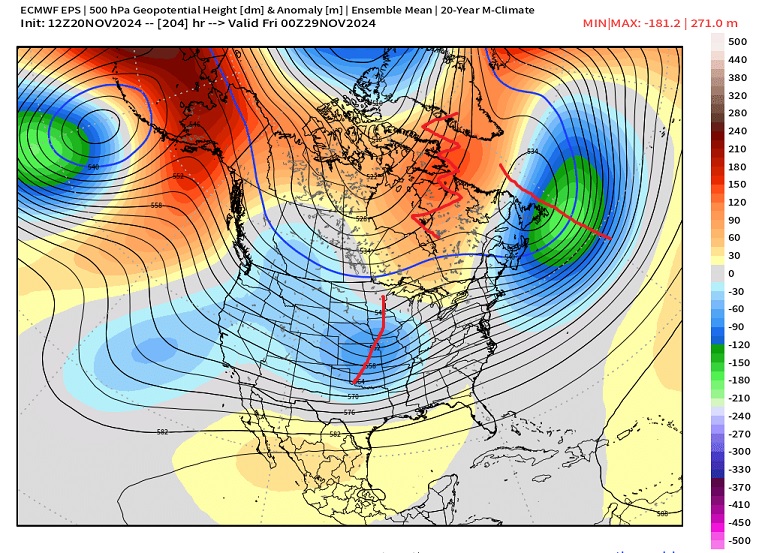
-
Blowvember - and not named for wind potential
ORH_wxman replied to Go Kart Mozart's topic in New England
The system is long occluded by the time that ULL moves south of us so it's gonna be favoring different areas on almost every run. I don't think there's much accumulation potential but the higher terrain near you and even down through ORH and NE CT could see a coating if they get into a heavier burst or two. But right now, it's mostly "first flakes" novelty potential here. Without an arctic airmass, it's pretty marginal....esp lower elevations. Type of thing where it;s 38F and then maybe it drops to 35F or 34F in a heavier burst with wet flakes. Seems like we get into a more true semi-arctic airmass by later next week which is why there could be a shot at something next weekend if the cards fall right. -
Blowvember - and not named for wind potential
ORH_wxman replied to Go Kart Mozart's topic in New England
When was the last time we saw a high in eastern Ontario/western Quebec when a system approaches us from the southwest? -
Blowvember - and not named for wind potential
ORH_wxman replied to Go Kart Mozart's topic in New England
Congrats @scooter on the GFS for 11/29-30 -
@powderfreak, looks like a decent upslope event potential this weekend. Cold airmass too coming in for Tday and beyond as well. Good news for the World Cup at Killington.
-
Blowvember - and not named for wind potential
ORH_wxman replied to Go Kart Mozart's topic in New England
Gotta watch for some unstable soundings on late Friday night and into early Saturday. GFS actually has some nice bursts of heavy wet snow even into lower elevations of SNE. But these are the types of things you won't really be able to get a good handle on until much closer. But when it's really cold aloft and you have 8C/km ML lapse rate in a saturated sounding, doesn't take much to get a few bursts.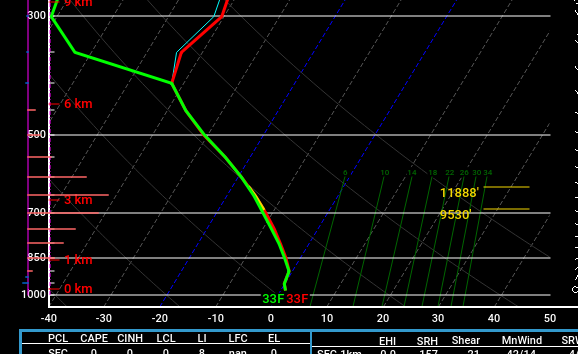
-
Blowvember - and not named for wind potential
ORH_wxman replied to Go Kart Mozart's topic in New England
Yep...to totally bust the drought, we'll need a very juicy winter. Finger's crossed we get it and most of it is frozen. -
Blowvember - and not named for wind potential
ORH_wxman replied to Go Kart Mozart's topic in New England
Yes we will need a lot more to fill the reservoirs and lakes back up a bit, but the fire danger will be massively reduced after this event. -
Blowvember - and not named for wind potential
ORH_wxman replied to Go Kart Mozart's topic in New England
I'm 99% sure the first Clark's meeting was Dec 2013 right before Christmas....I think it was the 23rd. -
Blowvember - and not named for wind potential
ORH_wxman replied to Go Kart Mozart's topic in New England
Dec 2017 was pretty good up here as well. Really 2017, 2019, and 2020 were all solid Decembers. With the exception of 12/17/20 though, they all sucked in SE MA to be fair to Brett. But we’ve had 3 garbage Decembers in a row now so hopefully this one can break the streak. -
Blowvember - and not named for wind potential
ORH_wxman replied to Go Kart Mozart's topic in New England
EPO and especially WPO are looking a lot better than recent years. We’ll see if that can maintain. @Typhoon Tip and I mentioned it a few times already and we talked about it last winter too. WPO has been kind of a turd in the punchbowl recently (it has even muted some of the recent -EPO bursts) and there’s a pretty strong signal it will be more favorable to start this cold season. That doesn’t guarantee us great results but it does mean we won’t underperform the cold dumps into Canada so when things do try to move SE, they are coming from a potent source region. It’s loading the dice a bit better for us than previously. -
Blowvember - and not named for wind potential
ORH_wxman replied to Go Kart Mozart's topic in New England
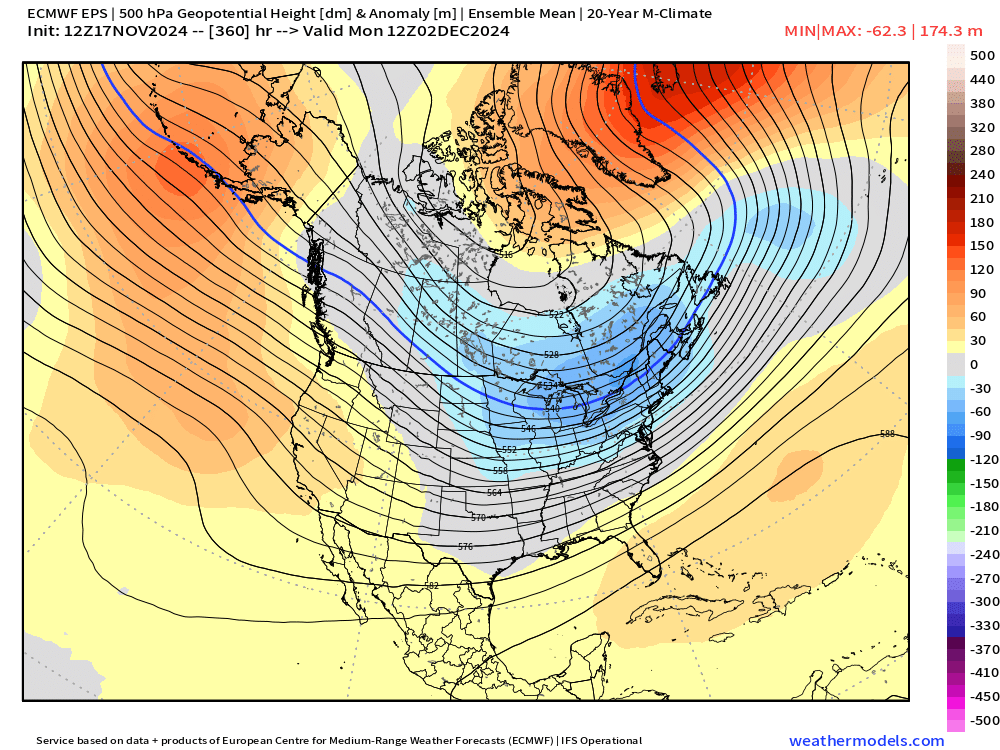
Forgetting about next week’s system for a minute, the EPS continue to trend too toward a colder start to December (and very end of November) This is actually looking a lot colder from a hemispheric pattern perspective than even a few runs ago. We’ll see how it looks as we get closer but this would likely be an interesting pattern to follow in early December if it maintains.