ORH_wxman
-
Posts
93,099 -
Joined
-
Last visited
Content Type
Profiles
Blogs
Forums
American Weather
Media Demo
Store
Gallery
Everything posted by ORH_wxman
-
Yeah your area is basically a lock for it I think.
-
Correct. Tonight is mainly north of rt 2. But as the mesolow passes by us overnight, it is going to tuck the sfc cold back south into MA. I think anyone from NE MA outside of 128 into central MA needs to pay attention. Could get quite icy…assuming we drop temps into that 30-31F range and not 32-33F. Some of the guidance has upper 20s in NE MA and in that Rt 3 corridor near ASH to Billerica.
-
There could be a big problem with FZDZ over much of the interior (esp pike northward) tomorrow and into tomorrow evening. Big cold tuck showing up on guidance. The question is how far below freezing it drops. There’s a decent difference between 31.5F and 29F
-
December 2024 - Best look to an early December pattern in many a year!
ORH_wxman replied to FXWX's topic in New England
Yeah makes a big difference for NW New England. VT never warm sectors and dendrite-land maybe for only 3-5 hours. Diminishes winds too except out in eastern half of SNE they are still ripping. -
December 2024 - Best look to an early December pattern in many a year!
ORH_wxman replied to FXWX's topic in New England
I don’t think the tuck will directly affect wind potential. The tuck happens well before any wind event. The winds will be almost totally dependent on the main sfc low track and strength…a weaker low traveling almost overhead will keep winds to a min while a very strong low further west will cause them to rip. -
December 2024 - Best look to an early December pattern in many a year!
ORH_wxman replied to FXWX's topic in New England
3k cold tucks nearly into BOS. There could be some problems in NE MA and SE NH. I mentioned this yesterday and a little while ago @wx2fish mentioned it. -
December 2024 - Best look to an early December pattern in many a year!
ORH_wxman replied to FXWX's topic in New England
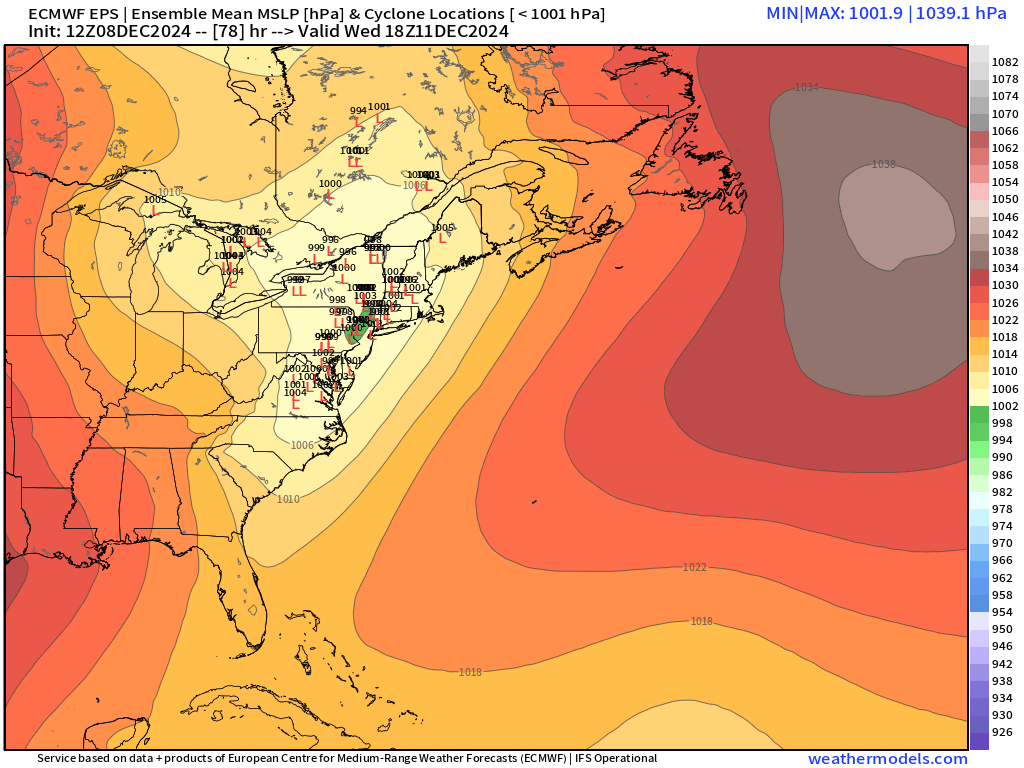
Still some decent spread on ensembles for 78 hours out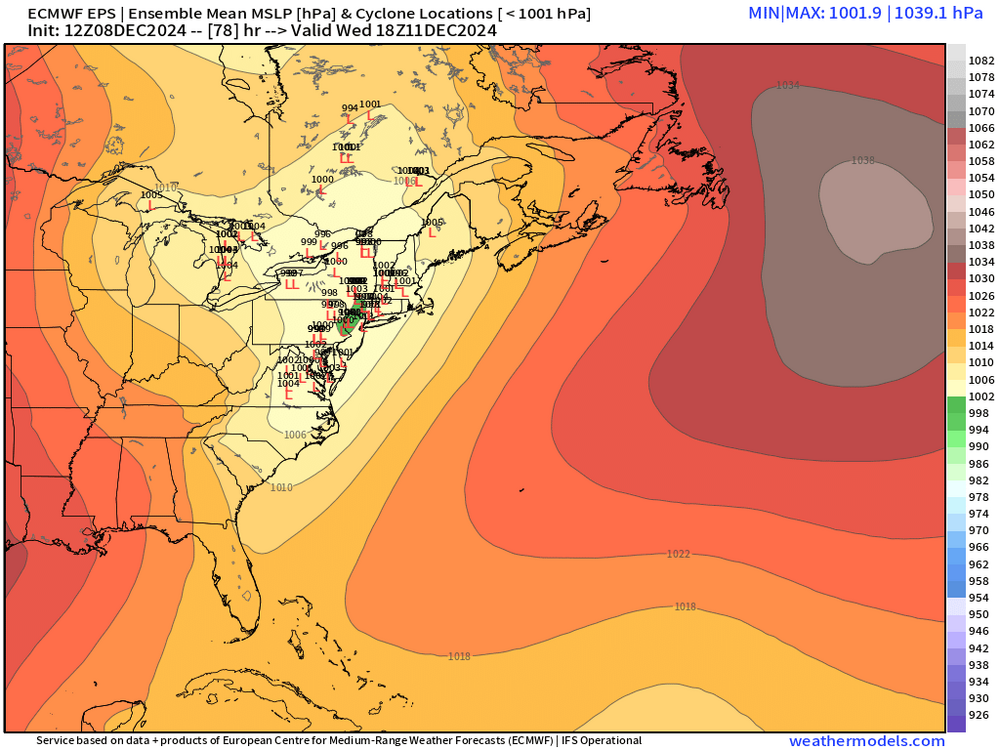
-
December 2024 - Best look to an early December pattern in many a year!
ORH_wxman replied to FXWX's topic in New England
NAM is def solidly east of other guidance. GFS was furthest west. GFS solution would be warm sector right into Canada. Something like NAM would keep interior CNE/NNE wedged almost the whole event. -
December 2024 - Best look to an early December pattern in many a year!
ORH_wxman replied to FXWX's topic in New England
Dec ‘89 had a huge snowstorm in Savannah I think on the 23rd-24th. Epic for them. -
December 2024 - Best look to an early December pattern in many a year!
ORH_wxman replied to FXWX's topic in New England
Def looks a lot better post-D10 than the last couple cycles. -
December 2024 - Best look to an early December pattern in many a year!
ORH_wxman replied to FXWX's topic in New England
Let’s rip to 60 on GFS that’s pretty solid. -
December 2024 - Best look to an early December pattern in many a year!
ORH_wxman replied to FXWX's topic in New England
I don’t think pure dooming is any better fwiw. There’s legit disagreement around the week of Xmas. -
December 2024 - Best look to an early December pattern in many a year!
ORH_wxman replied to FXWX's topic in New England
Hopefully it looks more like the 06z GFS at the end. Split flow with very poleward PNA ridge. Keeps central/eastern Canada and even down into NE in the icebox. -
December 2024 - Best look to an early December pattern in many a year!
ORH_wxman replied to FXWX's topic in New England
PNA ridges rolling over into central US while WPO tries to go positive will torch us. Aleutian low is supposed to retrograde which would give a much colder pattern but if it takes it’s time then it will make Xmas week pretty mild. -
December 2024 - Best look to an early December pattern in many a year!
ORH_wxman replied to FXWX's topic in New England
There’s actually a pretty decent cold tuck signal showing up. Doesn’t really occur until after most of that first batch of precip but it could end up affecting NE MA and SE NH later Tuesday with freezing drizzle or black ice. -
December 2024 - Best look to an early December pattern in many a year!
ORH_wxman replied to FXWX's topic in New England
There was one just a few years ago I think in 2019. It wasn’t quite this prolific for amounts but it was like 6-7” and then 1-2” east of the spine. I remember winter hill had like 2” while 10 miles west had 6”. -
New England Winter 2024-25 Bantering, Whining, and Sobbing Thread
ORH_wxman replied to klw's topic in New England
Lol that thing belongs in a hotel lobby. Epic. Great tree though. -
December 2024 - Best look to an early December pattern in many a year!
ORH_wxman replied to FXWX's topic in New England
Nobody in CAD land is getting wiped out from Wednesday. Warm sector won’t last long enough. Could argue your area never gets warm sectored at all depending on which guidance we use. -
December 2024 - Best look to an early December pattern in many a year!
ORH_wxman replied to FXWX's topic in New England
Yeah he’s in Clinton MA which is a decent spot but not for the 12/5 event. That was one of the worst spots. They got a bit of downslope but also it was a QPF min there up into NE MA and SE NH. -
December 2024 - Best look to an early December pattern in many a year!
ORH_wxman replied to FXWX's topic in New England
Yeah in 2020 I had cover from 12/5 until the grinch storm. 2017 was the last time we had good cover well before Xmas (12/9) and made it last right through the holidays. It’s hard to keep early December snow cover this far south. -
December 2024 - Best look to an early December pattern in many a year!
ORH_wxman replied to FXWX's topic in New England
Still snow covered in most of my yard but the south facing torch spots are bare on the street. But at least it feels and looks like winter for the most part. Better than the last 3 Decembers which were just hot garbage…and an emphasis on the “hot”. -
December 2024 - Best look to an early December pattern in many a year!
ORH_wxman replied to FXWX's topic in New England
Anafront snows...mostly in VT....doesn't look like much further east. -
December 2024 - Best look to an early December pattern in many a year!
ORH_wxman replied to FXWX's topic in New England
Don’t love the track of it. Screams pretty quick dryslot after the initial isentropic burst but we’ll see. I’m sticking with C-1” here but can’t totally rule out getting lucky with 2”. -
December 2024 - Best look to an early December pattern in many a year!
ORH_wxman replied to FXWX's topic in New England
Could be a nice fluffy advisory event for NNE tonight. That’s a good look on the clipper. I think down here in pike region I’d go C-1”. Maybe some 2” lollis in N ORH county over to Berks. -
December 2024 - Best look to an early December pattern in many a year!
ORH_wxman replied to FXWX's topic in New England
Clipper might not drop any accumulations south of rt 2. We’ll see. We really wanted it about 50-100 miles south. Too bad we couldn’t get midweek further east too. There’s def going to be an anafront band of snow with it but it’s going to be west of us.