Greg
-
Posts
2,043 -
Joined
-
Last visited
Content Type
Profiles
Blogs
Forums
American Weather
Media Demo
Store
Gallery
Everything posted by Greg
-
As I stated earlier his map is definitely good, but the 30+ zone will be slightly smaller in area coverage than what his map includes based upon NOAA and the National Weather Service in Norton.
-
This map you have here is shows why the area of 30" + by NOAA/National Weather Service in Norton have a more conservative swath. They are very particular about specifics. They don't like 5-7" differences in a town over, not to mention in some of the same towns. So, as I stated before they data cleanse and smooth over the numbers.
-
It's in old weather Coop Data but seems to not be there anymore for some reason. Don't know why it was taken off or discontinued. I took and overlapped of the '78 storm with '26 and even though areas in a relatively narrow band got 30"+ from this to the southeast, it appears that '78 still has a deeper and larger swath over a greater area.

-
"Don’t do it" 2026 Blizzard obs, updates and pictures.
Greg replied to Ginx snewx's topic in New England
It tracked good 40 to nearly 50 miles south of the Benchmark. it appears to be what the widespread consensus appears to be right now. -
Seekonk had 27" in '78.
-
That 50" right there is a little low. I have about 61"-62" on the season so far.
-
"Don’t do it" 2026 Blizzard obs, updates and pictures.
Greg replied to Ginx snewx's topic in New England
I don't mean to be or sound like a jackass, but Corey does make a fairly good point here. Not to mention he went around several towns and did a measurement himself. That snow down there was more dense than fluffy. The compaction would not go down that fast even after about 12 hours, trust me. But it appears that because of the wind and also what Corey showed us as he approached Warwick Airport with that big drift to one side of the road which we could all clearly see, I believe the errors may have been due to the drifting and measuring old snow depth included. (Snow on the ground before the storm) Even Corey showed us that when he stuck the ruler into a drift it came out to 30" where he is located in his town which is pretty close to the 32"officially reported. That really leads me to believe many may have measured the drifts vs the flatter/settled snowfall. This also doesn't have to do with any 6-hour measurements of wiping off the board which I'm personally not a fan of but that's another story. -
Excellent find! I remember looking at those. It's very possible that it snowed a little longer afterwards and was never updated at that time is the only conclusion. Only a 0.6" difference between the two. 26.4" was the widely accepted total back then.
-
Both those snowfall totals that beat 1947 were measured differently then back then. I believe these were measured and wiped off the board every 6 hours vs back then letting it accumulate until the storms ending. Unfortunately, it is what it is. Unless someone can go back and find a settled depth (If recorded) and has the power to change those numbers. Again, it is what it is.
-
"Don’t do it" 2026 Blizzard obs, updates and pictures.
Greg replied to Ginx snewx's topic in New England
Temps do indeed count very much so. Also, if this system tracked about a good 50-75 further north there is no guarantee that the primary banding would have set up like Feb. 9, 2013, in Central and Eastern CT. The Symmetry and 850's of this storm were a little different vs 2013. -
"Don’t do it" 2026 Blizzard obs, updates and pictures.
Greg replied to Ginx snewx's topic in New England
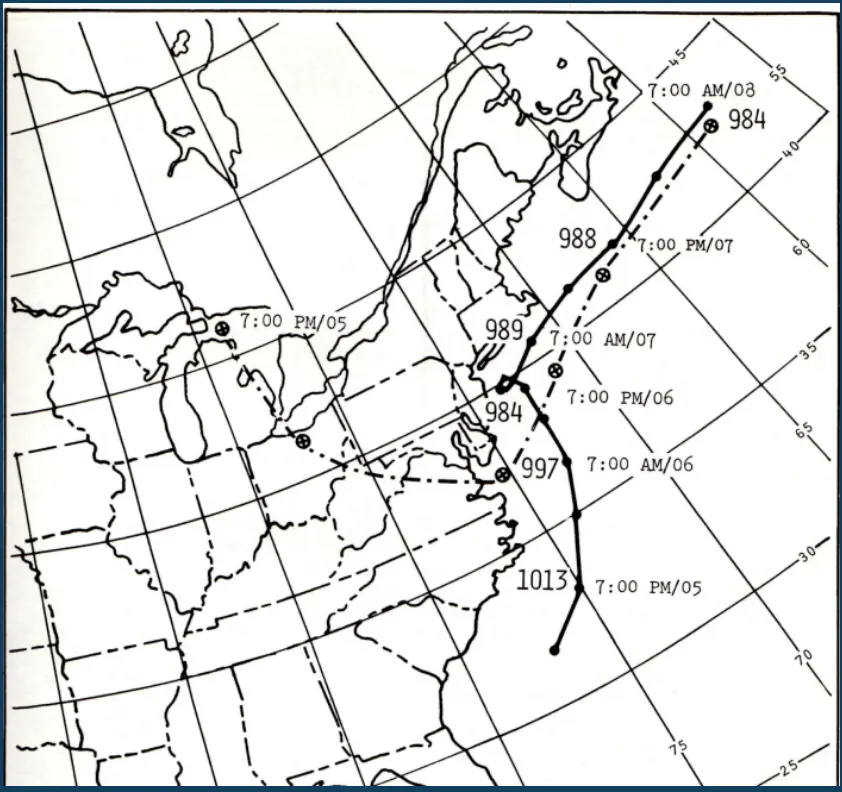
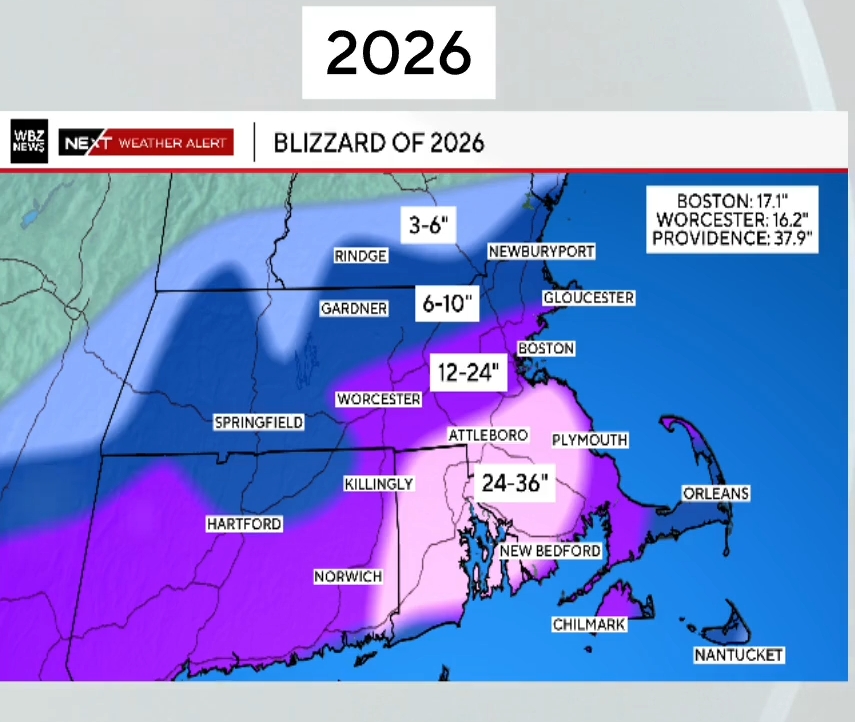
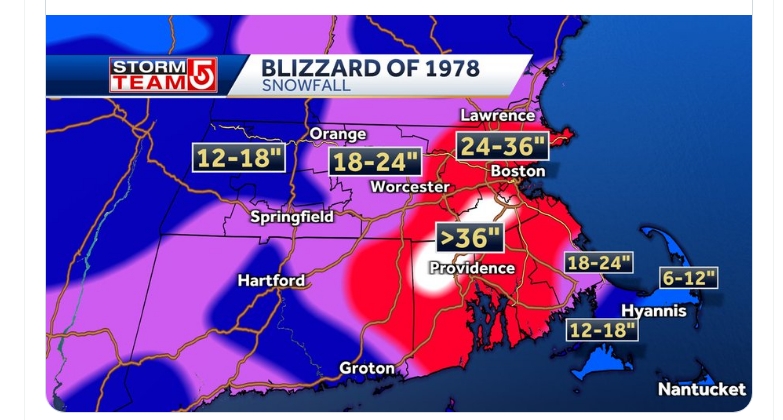
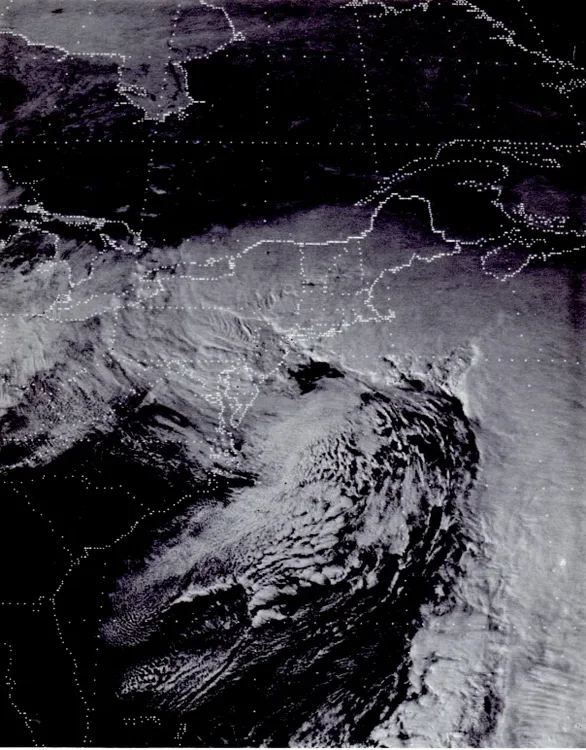
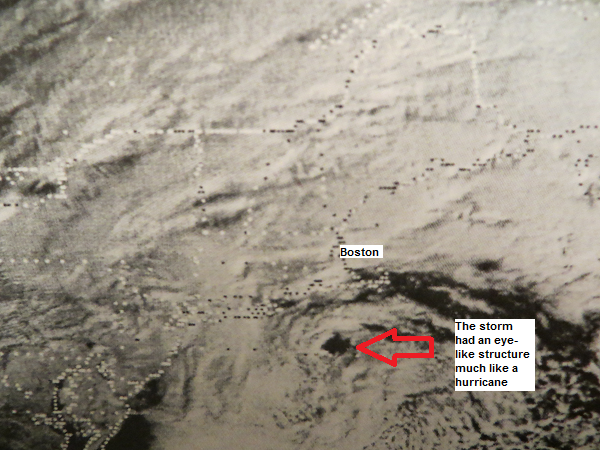
As you can see in the final snow totals in '78, the Providence area (Especially northern half) to Boston area and North Shore due to storms intensity and positioning (Track) is primarily the reason. The Blizzard of 2026 was actually more intense central pressure wise but about 70-75 miles further south than where '78 was not to mention the capture in '78 was off the coast of New Jersey not North Carolina like '26 was. Big difference in where it was captured and track inside the Benchmark. Temperatures back then was actually colder in the morning (Upper teens to Mid 20's) then rose to the upper 20's to low 30's (well inland around Worcester area low to mid 20's) with the exception of the far Southshore Cape and Islands where temps hit the mid to even upper 30's for a relatively short time as the storm made its closest pass. Storm track is crucial in storms like this one and of course in '78. Blizzard of 1978 Blizzard of 2026

-
Clipper Fires In Wednesday Feb 25 Disco/ Obs
Greg replied to Damage In Tolland's topic in New England
Moderate snow falling here 18.0F -
"Don’t do it" 2026 Blizzard obs, updates and pictures.
Greg replied to Ginx snewx's topic in New England
Correct! I don't believe for a second that if this storm center moved a good 50 to closer to 75 miles north of its trajectory, this would somehow loose its moisture and dump less snow. If anything temps in the low to mid 30's are not usually deemed the most ideal temp for accumulating snow despite what this storm did in that ribbon from southern Providence to the Bridgewater area. Most are in the upper 20's and low 30's at best and hold/carry the most moisture possible without dying out not to mention dendrite formation. If I went by that line of thought, then a supper Blizzard of '78 would never be possible here in the heart of our viewing area (Providence Aera to the Boston Area) which we all know happened so not sure where those Mets got that. I also know the 30"+ area snowfall coverage in '78 actually enveloped a larger area.
-
That 21" in Andover looks little high/suspect. Here in Wilmington there was about 13"-14" (according to my best measurements) Wakefield had about 18" and the other spotter down Wilmington Road near Pinehurst had 15.2".
-
"Don’t do it" 2026 Blizzard obs, updates and pictures.
Greg replied to Ginx snewx's topic in New England
'78 was actually a little inside of the Benchmark which is why a much more region wide (Heart of our viewing area) was affected back then vs a relatively smaller swath with this particular storm. Quite a difference in results back then then. HFD, ORH and BOS areas Ect. (Blizzard of February 6-7, 1978, Closest Pass) -
"Don’t do it" 2026 Blizzard obs, updates and pictures.
Greg replied to Ginx snewx's topic in New England
17.1" -
"Don’t do it" 2026 Blizzard obs, updates and pictures.
Greg replied to Ginx snewx's topic in New England
GFtKO3sWUAASPkq.j
-
"Don’t do it" 2026 Blizzard obs, updates and pictures.
Greg replied to Ginx snewx's topic in New England
Boston's highest depth of the 2015 Winter was 37.0" and also in 1978 in the northern half of Rhode Island was also deemed a 200-year storm at the time. -
"Don’t do it" 2026 Blizzard obs, updates and pictures.
Greg replied to Ginx snewx's topic in New England
That 40" was unofficial. Nobody knows how that was measured, even the local Mets found it suspect with the surrounding areas. -
"Don’t do it" 2026 Blizzard obs, updates and pictures.
Greg replied to Ginx snewx's topic in New England
We'll sort of but not entirely for the state itself in general. -
"Don’t do it" 2026 Blizzard obs, updates and pictures.
Greg replied to Ginx snewx's topic in New England
Just curious, what was wrong with their measurements of the past? Too high, too low? -
"Don’t do it" 2026 Blizzard obs, updates and pictures.
Greg replied to Ginx snewx's topic in New England
True, but the discussion is not really about liquid ratios per se, it was mostly about measuring snowfall. The amount of liquid in let's say 10" of snow can vary more than one believes. The storm 3 weeks ago was very fluffy, like the great lakes, but was measured mostly uniformly across the board. -
"Don’t do it" 2026 Blizzard obs, updates and pictures.
Greg replied to Ginx snewx's topic in New England
That's the general sense but what I wrote above is mostly because of inaccurate or lots of snowfall data metrics that are all over the place. In other words, too many cooks in the kitchen using different methods than using a single one. Coops with the settled snowfall is more trustworthy data. As long as the CoCoRaHS match or come in within reason to the Coop data, it is accepted. If it looks way off it is not recorded or data cleaned. Sometimes as people can see some bad/off data gets though on the PNS reports. -
"Don’t do it" 2026 Blizzard obs, updates and pictures.
Greg replied to Ginx snewx's topic in New England
Actually, it is not a true rule. Many COOPS that I see and I'm one of them, do it the "Old School" method. We use a board but don't clear it off every 6 hours. We wait till the storm ends or every 24 hours. If a storms longer in duration than that, then we clear the board. In a storm like this, we take multiple measurements in the a "snow survey" area and get an average and report. A snow gauge can be used for far less windy storms, but I find them a little on the inaccurate side. They are better used for collecting rainfall. The National Weather Service in Norton, MA does show rules on this. In fact, I find some of the rules a little on the ridged side. This can be found on their site.