

Cobalt
-
Posts
4,865 -
Joined
-
Last visited
Content Type
Profiles
Blogs
Forums
American Weather
Media Demo
Store
Gallery
Posts posted by Cobalt
-
-
45 minutes ago, psuhoffman said:
I agree with @CAPE that our next modoki Nino is a great test case. We underperformed our last Nino. The excuses have some validity. But if we underperform the next one…it’s starts getting harder to ignore the obvious. If we get a modoki next year and DC gets 40” then maybe it’s been more a temporary cycle. I think it’s part both. Maybe 70/30 bad pattern cycle v climate. This would have been a bad period in any decade given the pac longwave pattern. But I think it’s been made worse. I’m curious myself to see how “muted” our snowfall is once we get a truly good and long term sustained pattern where we can’t make any excuses if it fails to produce prolific snowfall.
It seems to me that our winter troubles are amplified whenever the Pacific isn't close to perfect. In recent memory 2013-2014/2014-15 were our last big +PNA/-EPO winters and those absolutely worked in the East, but out West they were near wall to wall record warm. +EPO/-PNAs do the same to us in the East. Anything in between and the firehose is muted somewhat but you can definitely tell where margins are lost. In the past 10 years or so it seems like the Pacific has entered the driver's seat and overpowers any other influence, positive or negative. That especially hurts us in La Ninas that still need some blocking help for the larger type storms, so now on top of needing a perfect pacific look you require at least some blocking in the AO or NAO domains. The 18-19 Nino did underperform but it was DCA's only AN snowfall winter since 15/16 and that was the last winter that had respectable cold readings at DCA as well. In my mind the change in base state has us faltering in La Ninas more but I guess there hasn't been enough El Ninos to accumulate sufficient data.
-
 7
7
-
-
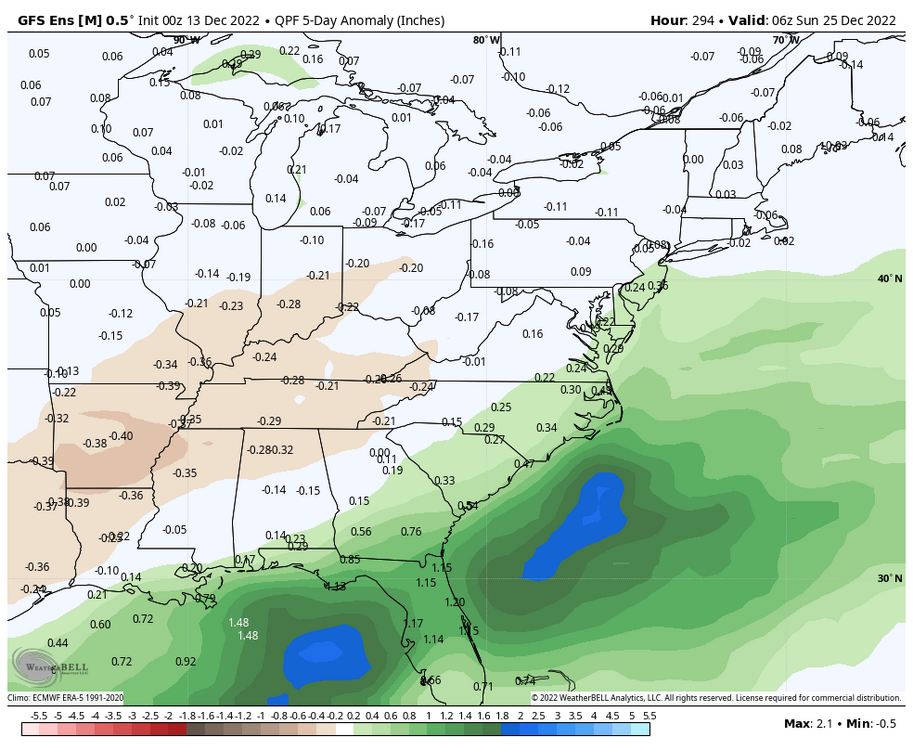
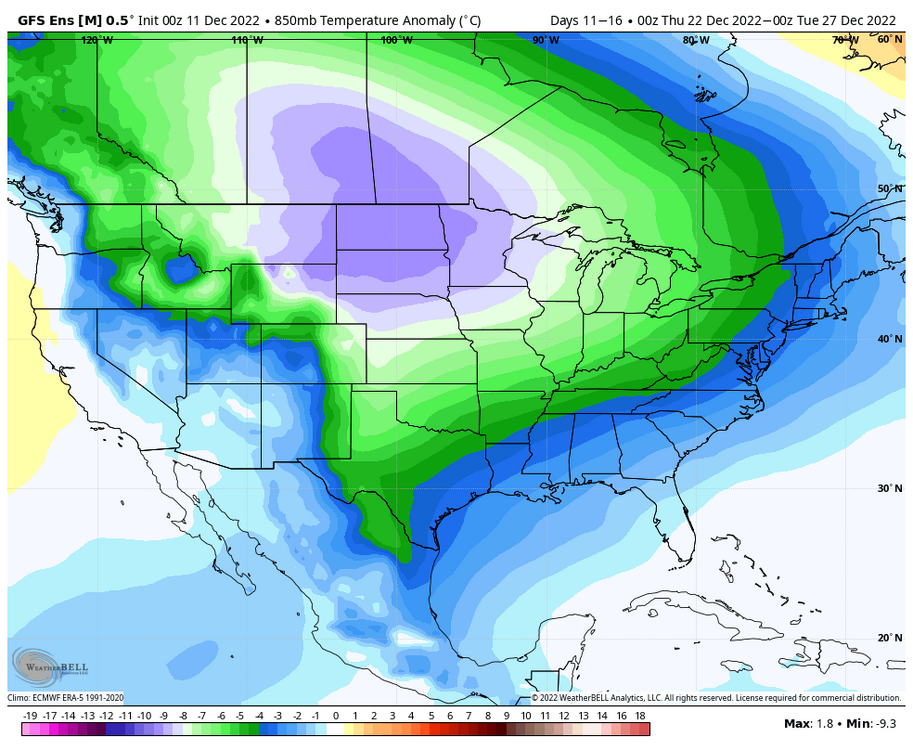
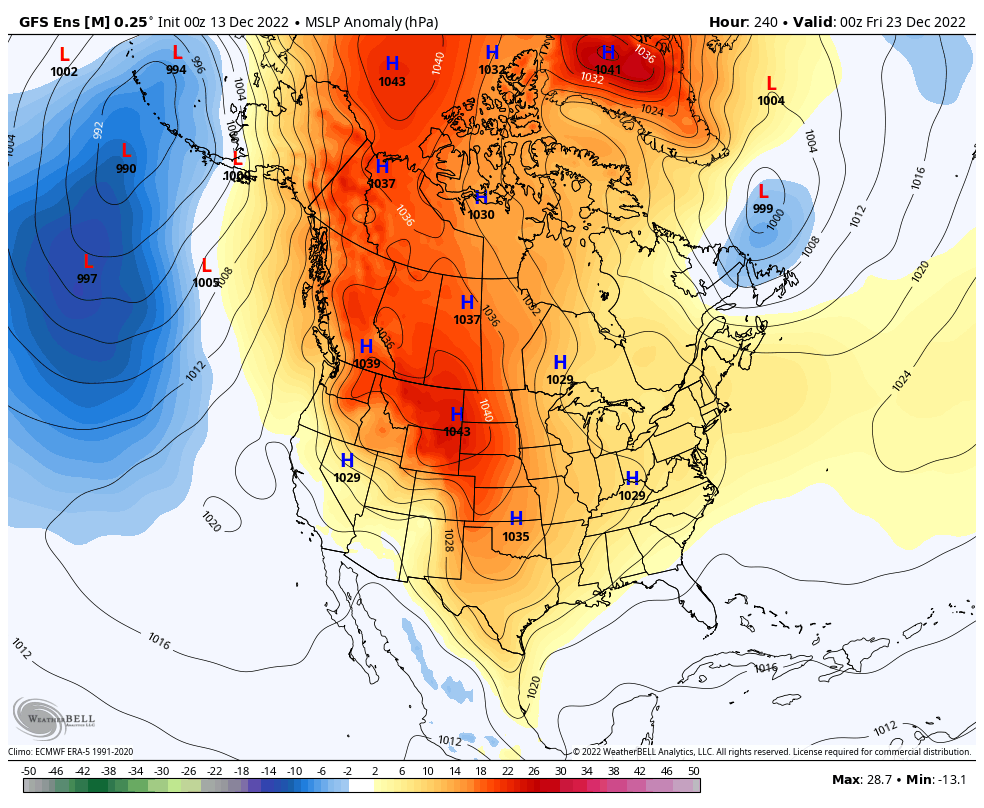
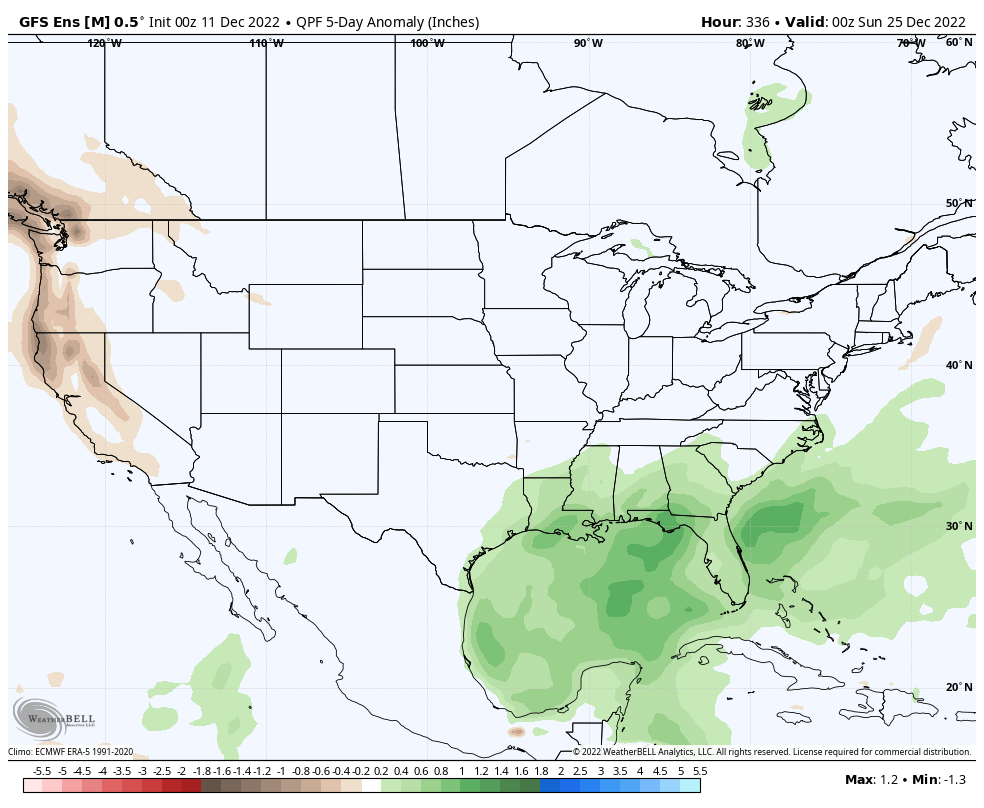
Still a crazy amount of cold behind that system.. 30F departures below normal from the Gulf of Mexico to the Montana/Canadian border.
As per Euro, DCA challenges the record cold max for the 24th set in 1989 of 23F (25F on Euro), and the 4th coldest Christmas high w/ 26F as depicted. If it can't be snowy, at least some anomalous cold will make Christmas feel "wintry".
-
3
-
-
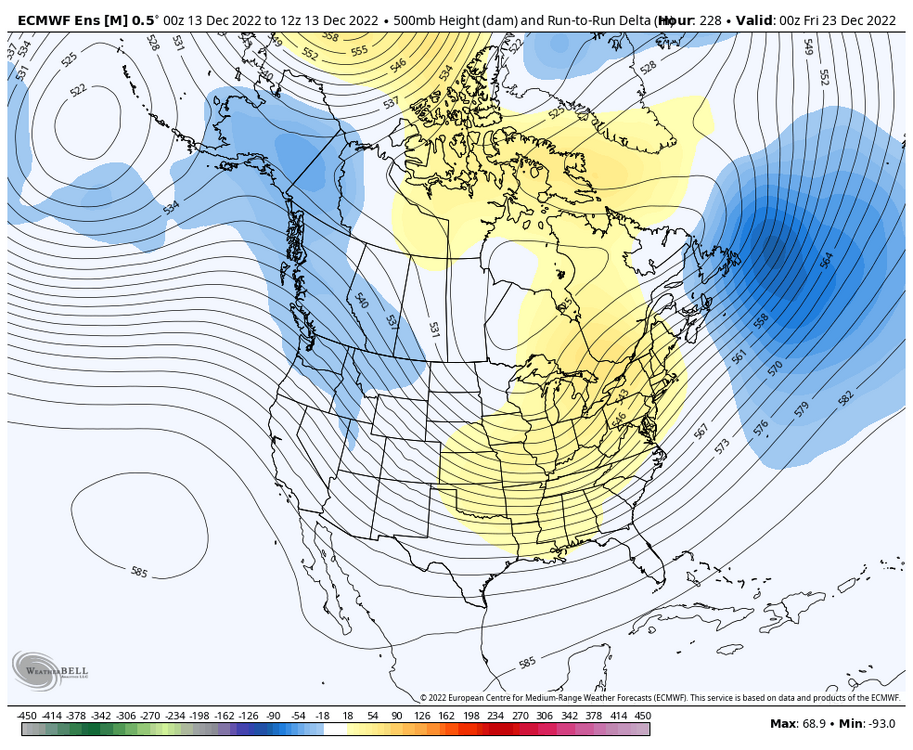
Pretty substantial shift..
.thumb.gif.6fd4f22be4451623494d4673d5595c4f.gif)
-
1
-
-
16 minutes ago, psuhoffman said:
You’re both not wrong. You’re pointing out WHY this setup could go wrong despite a crazy -AO and west based NAO block. And you’re right. But it also might not just be bad luck either. You’re right that without lower heights under a block it’s impacts are muted. But we’ve now seen several bouts of -NAO ruined by an eastern mid lat ridge linking up over recent years and by a hostile pac. And I’ve seen research that both might be related to at the very least long term cycles if not permanent changes due to warming. And even if the persistent TNH that’s been killing us isn’t directly related it is being enhanced by the hot tub formerly known as the Gulf. I see some repetitive patterns here.
This would also explain why it appears as if December is becoming a non-winter month faster than any month after, right? From what I've seen, we can get those domains to "play nice" once we're farther into the season when those anomalously warm regions of water have had ample chance to cool down, but they're mostly hostile the earlier we are into the season. That especially doesn't sit well with La Nina regimes as they're much more likely to be frontloaded. It also seems to have knock-on effects when we're dealt an excessively unfavorable pattern very early on, something like the +EPO in late Dec 2020-Jan 2021 and of course Dec 2015 where it took 3-4 weeks for cold air to reach our side of the hemisphere once again. Quite the frustrating game we have to play.
-
 1
1
-
-
The ICON is still well.. the ICON, but a sizeable positive shift w/ regards to how it handles the TPV. Doesn't get anywhere near resembling a GFS scenario, but maybe we could at least avoid the dreaded pre-Christmas 60s torch?

-
4
-
-
2 minutes ago, WxUSAF said:
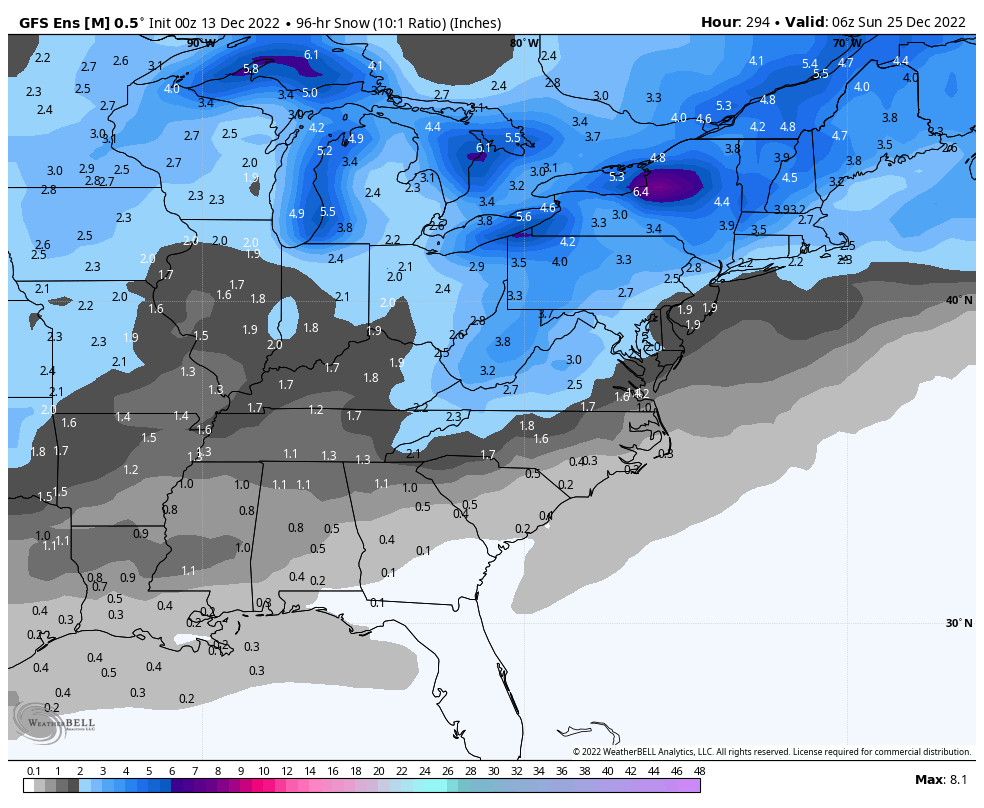
We’re basically at D7 for the storm being on our door step. Long way to go but I like where we sit for now. I’d like to see us in a similar position (with wiggle room to maintain a nice event) around 0z Sunday.
Everyone should also remember that even an area wide 3-6” type event would be HIGH TIER for mid-Atlantic La Niña December’s.
At my location back home 3.6" during the entire month would make it the snowiest December since.. 2009 lol. Gotta stay humbled by climo after seeing those 2 GFS runs back to back, and of course it's good to know that we're just now at the start of our tracking season.. anything this early is gravy

-
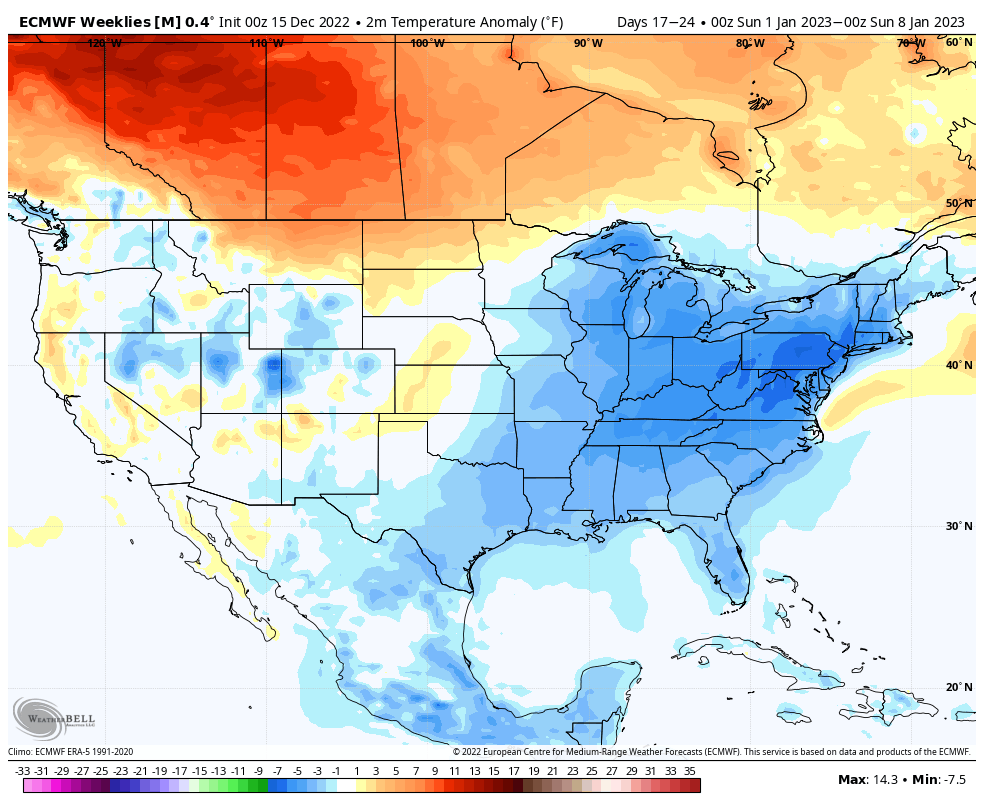
While we wait for the GFS, Euro Weeklies continue w/ the cold into early January. Of course a lot of this is weighted towards next week's cold snap, but the weeklies depict negative departures through much of January.
.thumb.png.9741e84824ee2c7e214089c1899b8622.png)
This would be for the first week of January, showing cold anomalies continue with a pretty decent look up at h500.

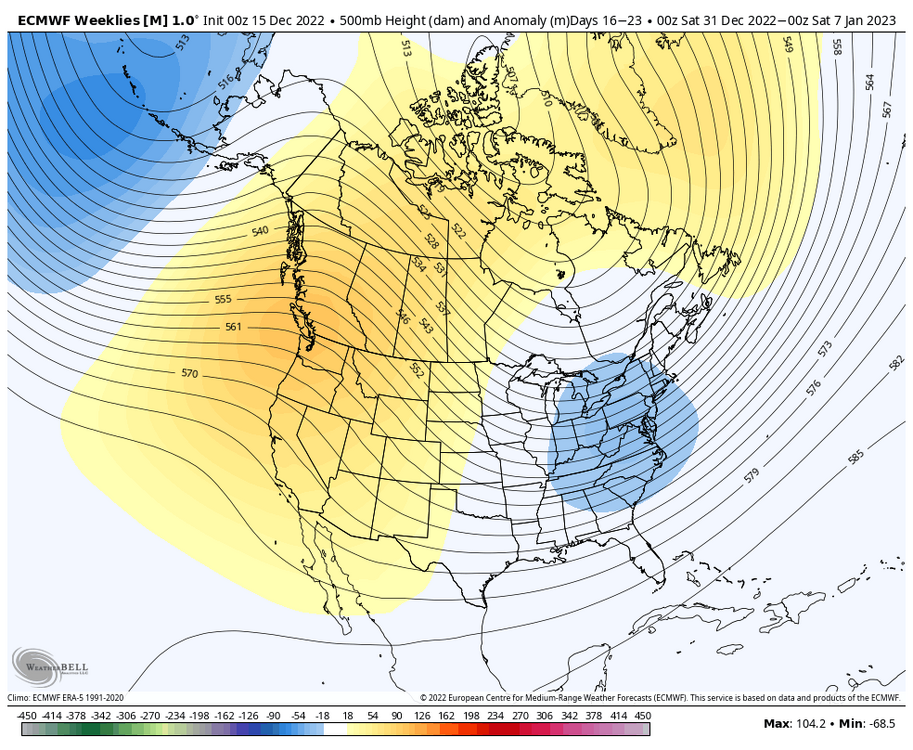
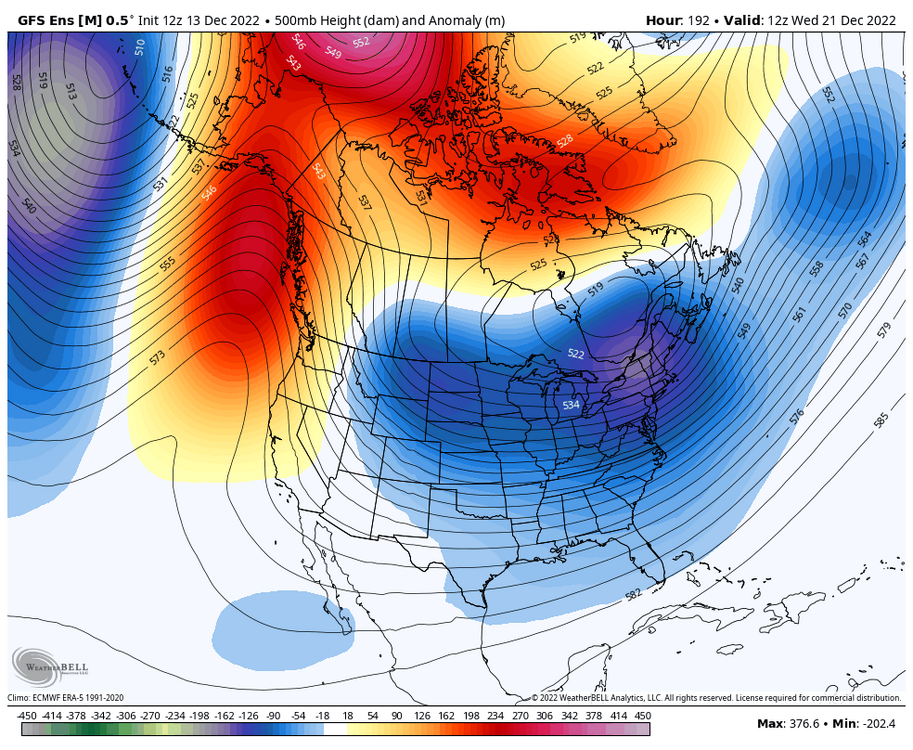
Verbatim we play with that Aleutian low attempting to encroach mainland Alaska, but not enough to conduct a fully-fledged onslaught of Pacific air. The 12z EPS looked like it would go on and do that, but that look plays out near the Day 12-15 range so there's still a lot of uncertainty w/ regards to the Pacific. Also correct me if I'm wrong, but isn't that Aleutian low more characteristic of an El Niño? I recall most of the seasonal models parking an Aleutian ridge over that domain.
-
5
-
-
For the data-obsessed weather geeks like myself out there, it looks like the team that creates the NESIS snowfall map graphics went back and filled in the gaps for some of the storms from the 2000s-today. The graphics don't look as polished as some of the earlier ones, but it's nice to see some love for the storms that were somewhat prolific, but might've just not been considered at the end of their respective seasons. You can find that data here:
https://www.ncei.noaa.gov/access/monitoring/rsi/nesis
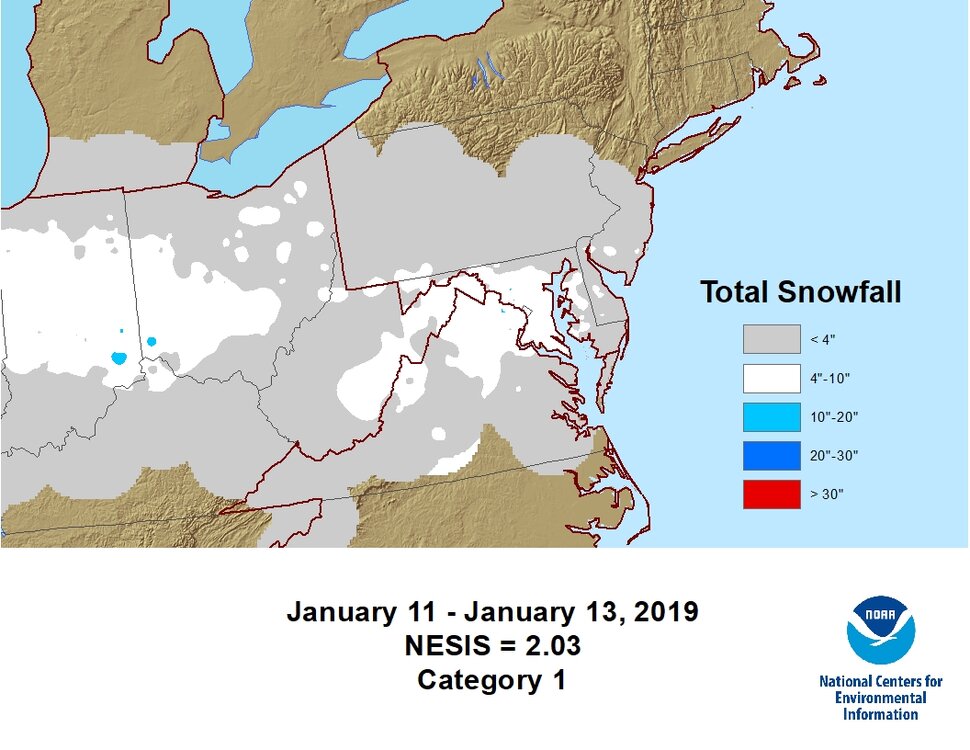
This was a personal favorite of mine.
-
7
-
-
On 10/27/2022 at 4:18 PM, Cobalt said:
That look on the EPS reminds me a lot of November 2017. Not identical, but overtop there are definitely similarities to the start of the month in both figures.

While the month wasn't 1:1 at h500, November 2017 did have an extreme -EPO event, much like what we had during the middle of last month. That year also featured a prolific Arctic outbreak during the last week of December into early January.
The main difference between these two timeframes is that December 2017 was more positive in the AO and NAO domains than what we're dealing with now. Not hostile, but it was definitely a pacific driven pattern.
That timeframe had some impressive cold. According to @RodneyS, December 26th through January 8th 2018 averaged 22.5 degrees at DCA, which was the coldest such 2 week stretch since January 10-23, 1994. That arctic outbreak concluded with a major storm for our subforum's Eastern region on January 4th, but wintry threats continued through mid January. We will see if additional Greenland/Arctic blocking allows for this stretch to be snowier than that was for our general subforum, although I'm unsure if this timeframe will rival that one in terms of temperature departures.
-
2
-
 2
2
-
-
9 minutes ago, Heisy said:
Let’s hope the euro is having issues dealing with the western energy/ridge, ugh…

.Euro doesn't have the single digits all the way down to San Diego anymore so that's a start at least
-
This is workable.

.thumb.png.e4f6002ca6b4901e5331f146587f83a4.png)
-
4
-
-
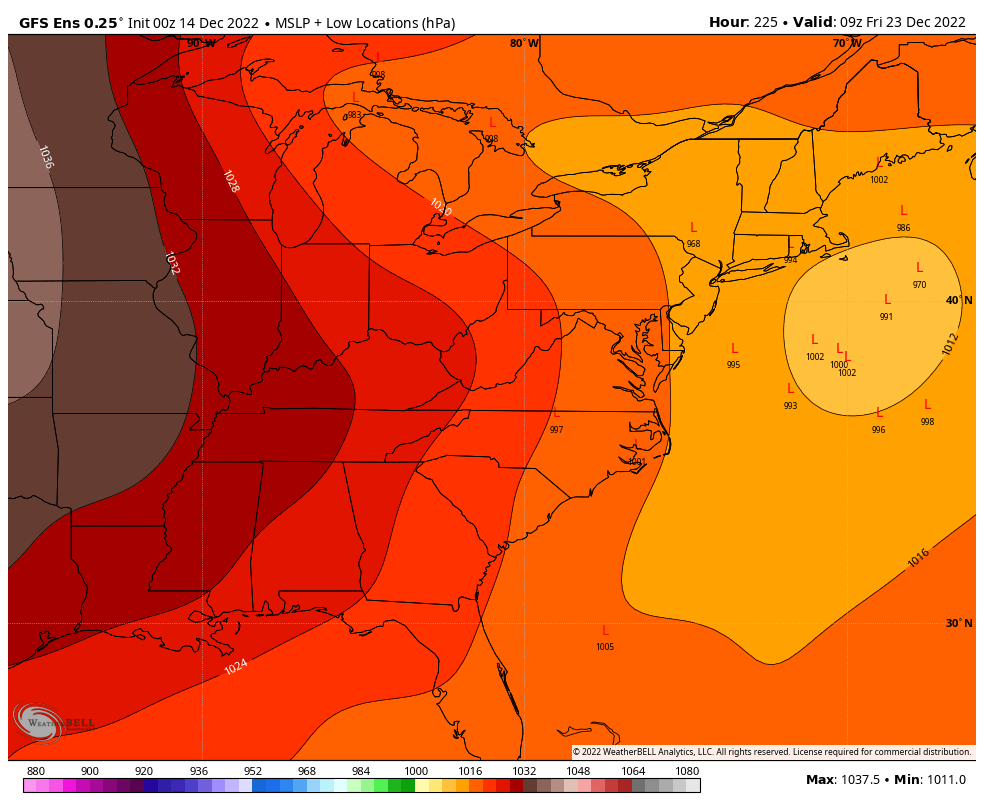
5 minutes ago, cbmclean said:
I had thought that record was broken a few years ago in Mongolia.
I believe they're referring to the US record. Now, if the GFS had been right about setting a new global record, it would've been with the 1101mb high over Greenland that was forecast about a week back by that model. Needless to say, I don't think that verified.
-
36 minutes ago, osfan24 said:
But I know 2016 has it beat. And possibly the first 2010 storm. It was probably pretty comparable to 2003.
I'm not sure if this was the case in 2003 or 1996, but the first Feb 2010 storm stands out to me because of how wet the snow was initially. I'd imagine it was less than 10:1 until things really got going during the overnight hours, and that set down the perfect base for snow to cling onto trees and poles. I recall several massive trees falling overnight, and we didn't have power until after the second storm. Never had either of those things happen in the 2016 storm as that was very powdery in nature.
-
8 minutes ago, WxUSAF said:
Much more of a coastal-dominant lean on the 18z GEFS vs 12z
Improvements in both the PNA region and in blocking over Baffin Island as per the last 2 GEFS runs. If we are to believe that the GEFS has been handling the pacific domain better than the EPS during this blocking regime, this would be an ample test for that.
.thumb.gif.10c1c83b237463d333eab70c63a3c719.gif)
-
8
-
-
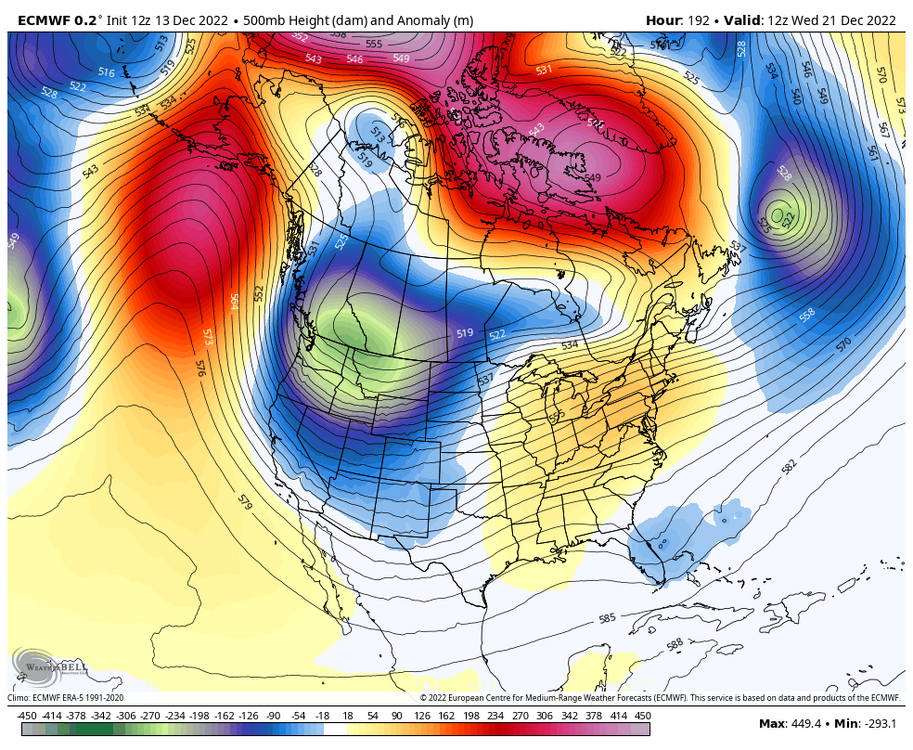
I see two distinct camps. Euro OP looks to be part of that cluster of LPs over the great lakes.
.thumb.png.3e39c840e5793f257c3e7bc5c4472383.png)
Despite a slight trend in heights to favor the Euro OP over the CONUS (not enough to resemble or cave to the OP however), check out the run to run change of lower heights near the 50/50 region. I would like to see that be picked up in future ensemble runs.
-
5
-
-
4 minutes ago, Ji said:
No concern at all

Just a small difference..
-
3
-
 1
1
-
-
0z GEFS depicts a pretty favorable window for snowfall from the 20th-24th. Seems to be a few members that followed the OP which would explain some of the greater westward totals, so definitely not as much of a sign of suppression on these panels.
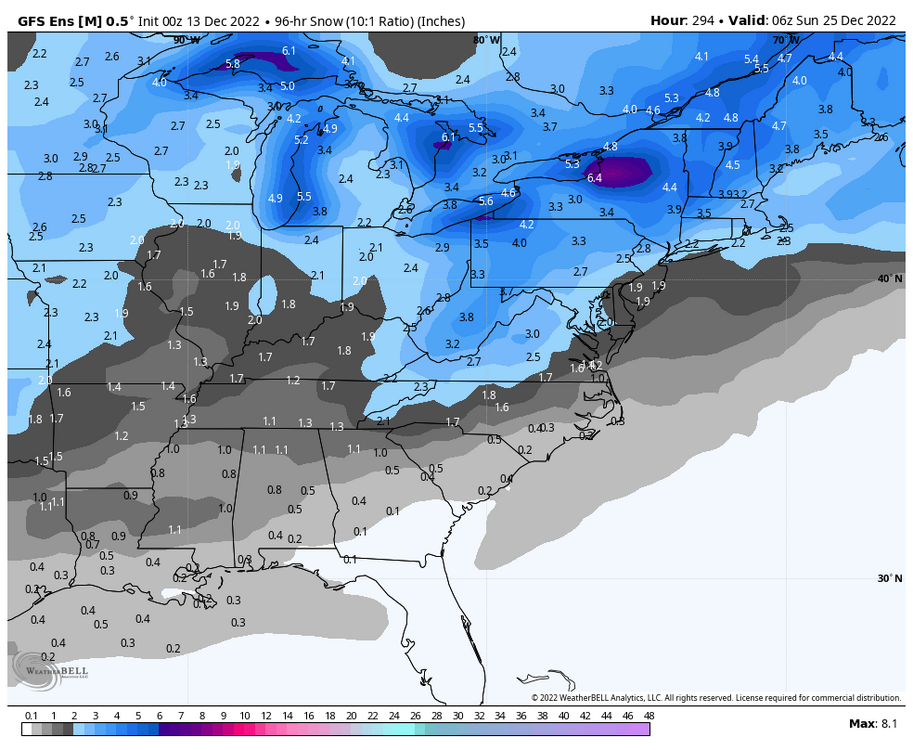
What I like to see is the appearance of a low pressure system in the 50/50 region as per the GEFS mean, it looks like that's been picked up on the recent ensemble runs.
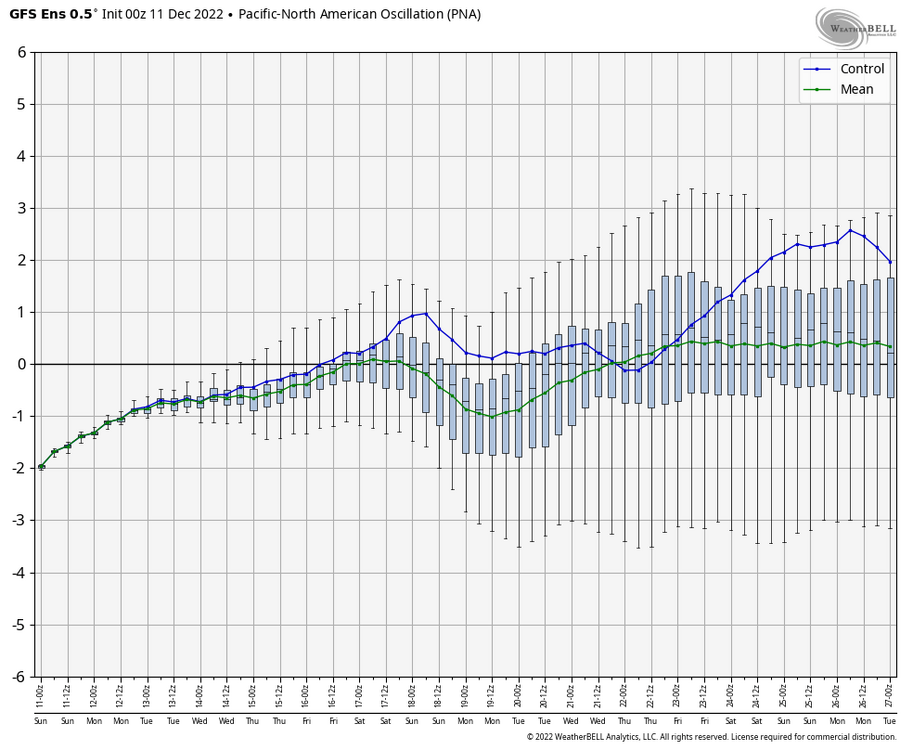
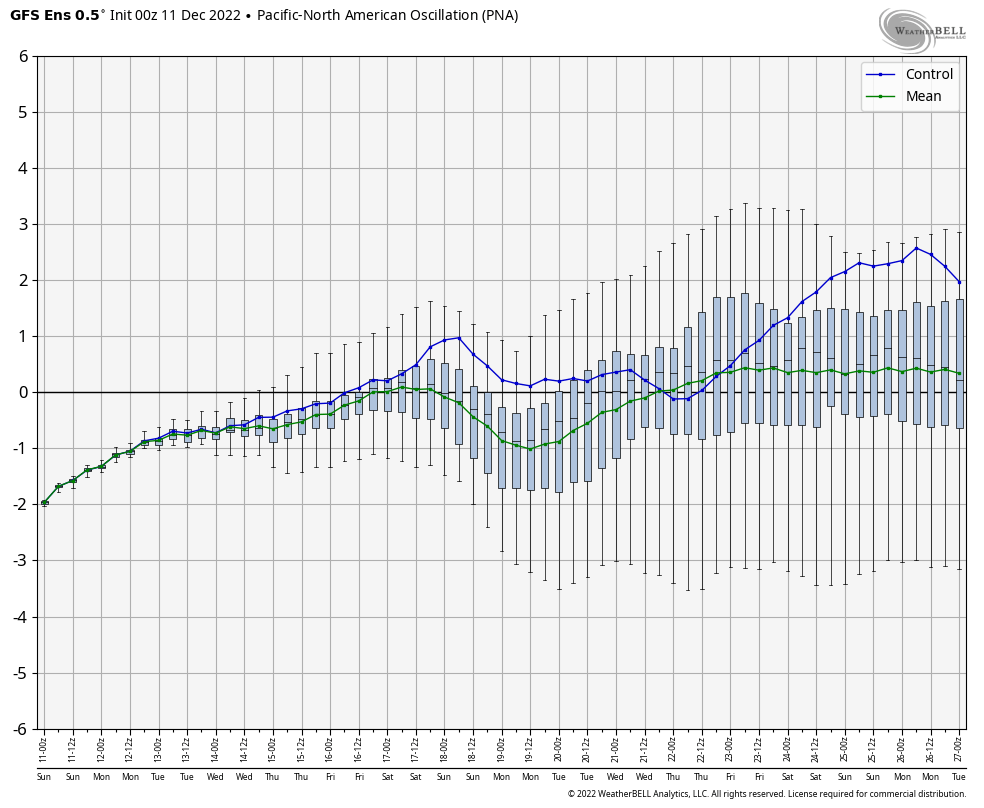
PNA begins to spike during this timeframe as well, so the teleconnections definitely bode well for a train of systems during the week leading up to and after Christmas.
EPS quite likes an idea of a 22nd-24th event as well. +PNA popping and -AO nearing -5 would make me somewhat hopeful for this window.

-
12
-
1
-
-
Seeing all of the discussion of some crazy cold makes me desperately want a PDII type cold smoke event, low teens or even single digits with heavy snow falling. I can't really remember the last time we had a WSW+ type event with temperatures in the teens for most of the event, maybe Jan 2019?
-
10 minutes ago, clskinsfan said:
Anyone know where I can find Northern Hemisphere upper air maps for December of 1983? That is the king of December arctic outbreaks for me. We were -7 on Christmas morning here.
https://psl.noaa.gov/data/composites/hour/ This site gives you a lot of parameters to mess around with, so you can change the timeframe and metrics depicted on the map. Definitely a recipe for an icebox as shown in that panel.
-
1
-
-
On 12/11/2022 at 7:30 PM, psuhoffman said:
That hasn’t been my experience. Just going back over some notably great patterns…
Feb 2021 is one that stands out to me in recent memory. I had to look back at the h500 maps and it looks like we actually had a +PNA during the first half of that blocking period in January. The issue was that there had been a raging +EPO that helped in scouring out any sustained cold in Canada, so storms became shredded messes as they made their way eastwards. It took more than 3 weeks to sustain cold enough airmasses for adequate threats in the East, misses or otherwise. That was when someone (I can't remember who) brought up the data on how DC tends to reliably sustain at least one stretch during each met winter where snow doesn't fall for at least 3-4 weeks (if not more), almost regardless of the underlying patterns. That's been a way for me to mitigate expectations when favorable patterns develop and wane, and as you brought up, it typically takes some time for the stage to get set, even in our most dynamic and favorable setups.
-
2
-
-
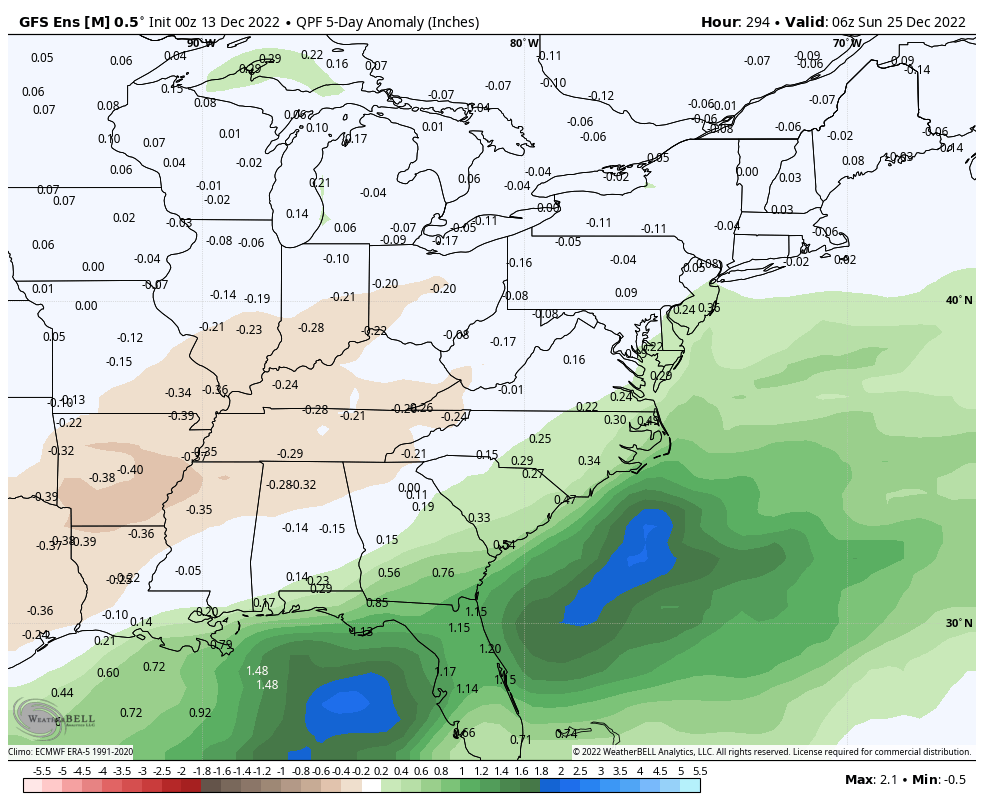
Very interesting precip and temperature depiction on the GEFS for the few days leading up to Christmas. Would imagine that a threat window emerges from this timeframe.

GEFS has PNA nearing neutral or even slightly positive during this timeframe to. Coupled with an -EPO and a -AO/-NAO that are slightly rising, that definitely can't hurt.
-
4
-
-
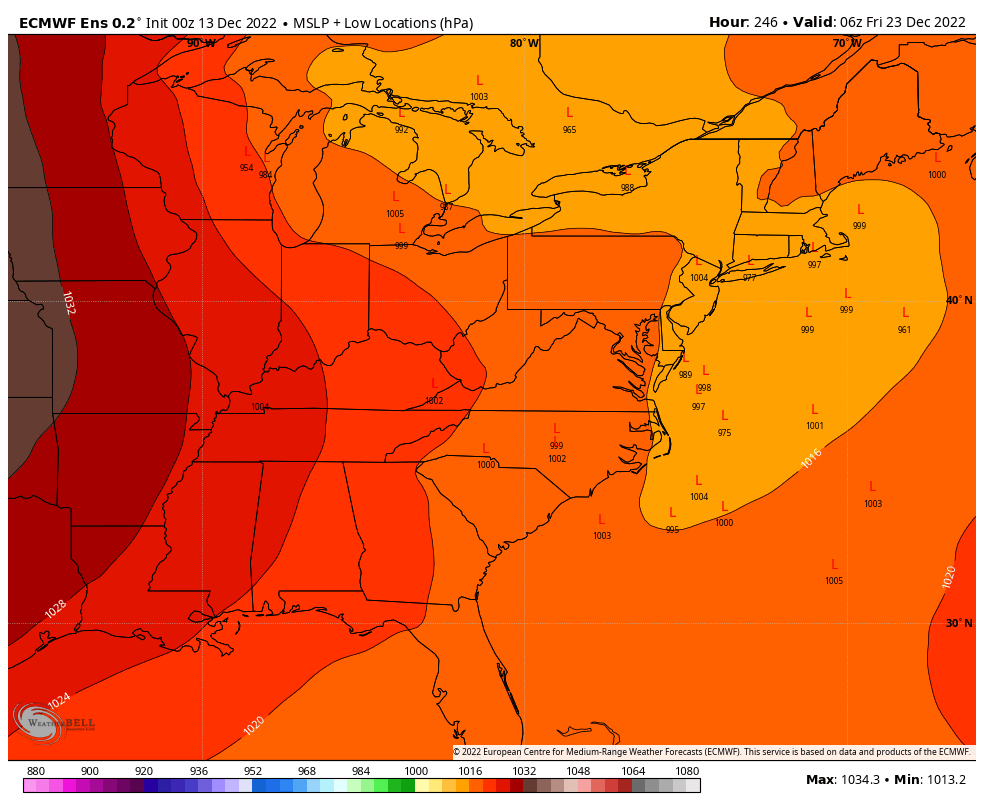
19 minutes ago, CAPE said:
Primary low stronger and further north, and all that HP across the top is a tad weaker. The ultimate outcome is still TBD with this one.
Yeah, that primary lp rotting away near the border of North Dakota does not bode well for us. The Euro has swapped places with the GFS and has some more favorable cold to the point where it's ~5F+ colder at the surface and 3-4C colder up at 850mb for a good bit of the general subforum at 6z Thursday, and it tracks the primary lp a good bit farther south. Still not too serviceable of an airmass, but still enough for frozen at onset.
-
I am a firm believer in the inverse Idub23 index (note the date)
On 11/22/2021 at 8:50 AM, ldub23 said:JB is right again. Here comes winter and a bitter cold Dec.
-
1
-
4
-
-
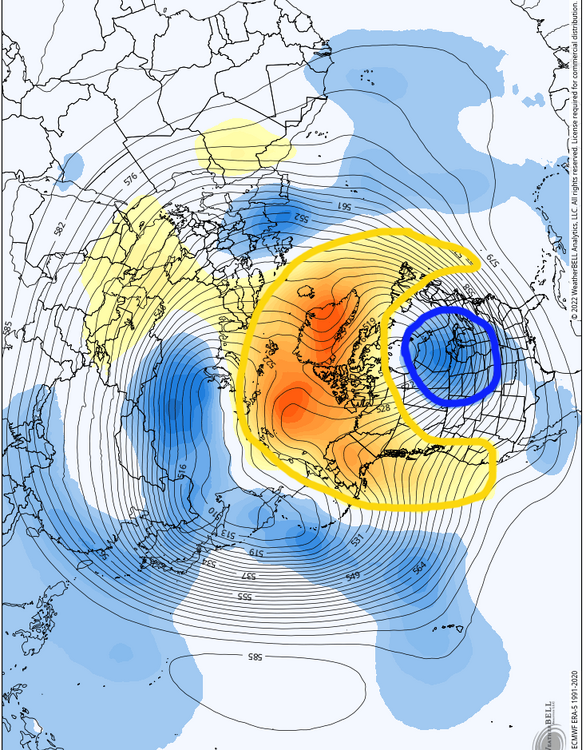
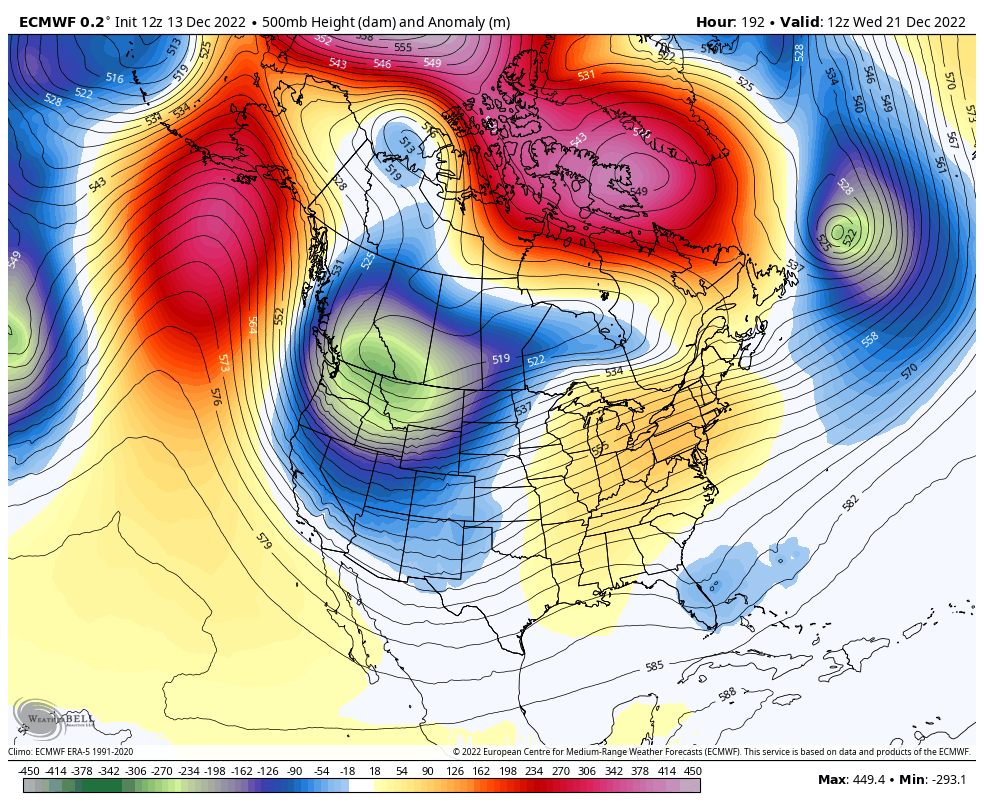
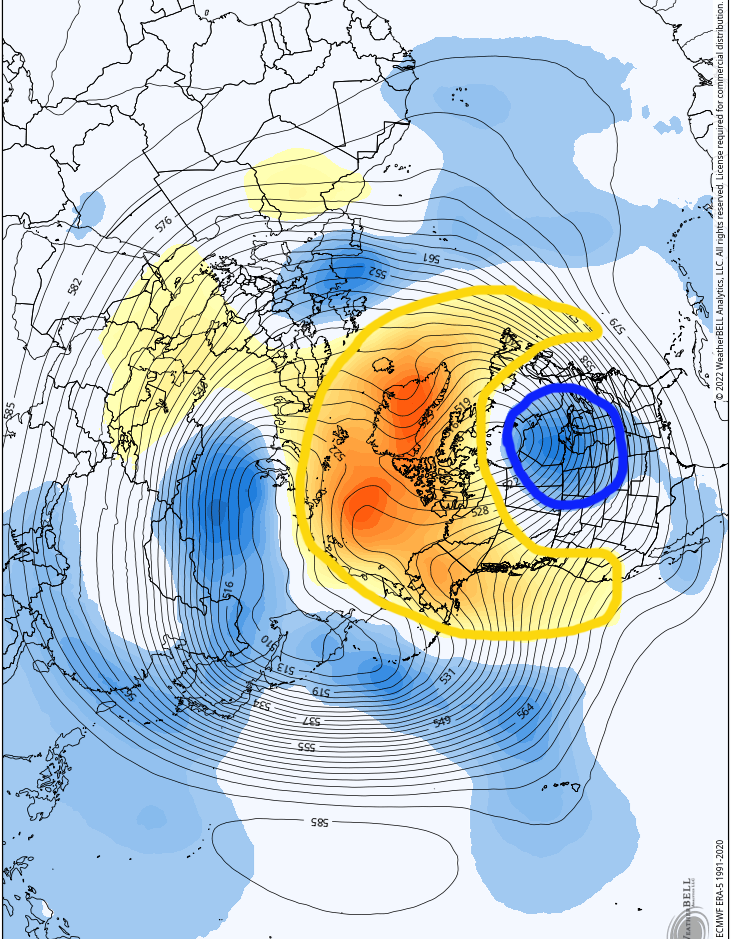
The fabled Pac-Man pattern? No wonder people are bringing up analogs from the 80s.
-
1
-
.gif.85e6bc5c673e3000c1c2dddeae7c32ff.gif)
.png.1481824ae0bd1ca8d3dbcaa875256824.png)


.png.6e1732bee3ad3639f9c5ae8269636204.png)
.gif.9d8edeea965b777d68cb473c5e37ef8a.gif)
.png.898cbbcebdae6f065260eb366c9e49a1.png)


December 22-23, 2022: Warm Rain to Arctic Chill
in Mid Atlantic
Posted
DCA's lowest temperature during the 18/19 season was 10F on 1/31. The latest single digit reading at the airport was 8F on 1/7/18. 5F as a low temperature would be the lowest that location has been since 2/20/15 (Also 5F).